0131
No observation of DIANA signals in rats at 7.0 and 17.2 Tesla1Australian Institute for Bioengineering and Nanotechnology, University of Queensland, St Lucia, Australia, 2NeuroSpin/CEA, Gif-sur-Yvette, France
Synopsis
Keywords: fMRI Acquisition, fMRI, DIANA
Motivation: Direct Imaging of Neuronal Activity (DIANA) was proposed by Toi et al. in Science 2022. Before DIANA can be adopted, key findings must be reproduced.
Goal(s): Independent reproduction of the results shown in supplemental Figure 26 of Toi et al.
Approach: Rats were scanned at 7.0T and 17.2T using a visual paradigm consisting of a 10ms blue flash every 200ms.
Results: No DIANA signal was detected, even though the temporal signal to noise ratio was sufficient to detect signal changes of 0.1%. However, a slow hemodynamic signal, much larger than the expected DIANA signal, was observed between measurements with and without stimulus.
Impact: Our failure to detect a DIANA signal in rat at 7.0T and 17.2T, echo's findings by Hodono et al. (Imaging Neuroscience) and Choi et al. (bioRxiv), indicating DIANA is not ready for use in neuroscientific studies.
Introduction
Last year Toi at al.1 published a method for the Direct Imaging of Neuronal Activity (DIANA) using MRI. Their work showed signals with millisecond temporal resolution that correlated with local field potentials measured invasively in mice. Troubling, Hodono et al.2 and Choi et al.3 failed to detect DIANA signals in humans and mice, respectively.The work of Choi et al.3 deviated from Toi at al.1 in two ways. Firstly, a stronger magnet was used. Stronger magnets not only produce larger MRI signals, but they also enhance Blood Oxygen Level Dependent (BOLD) signal changes4, which could overshadow smaller neuronal signals. Secondly, Choi et al. used continuously infused sedation, instead of intermittent injections, providing more stable anesthesia and allowing longer measurements. Although continuous injection allows long continuous measurements, it was recommended to collect individual measurements, with a short breaks in between5.
In this work, we endeavored to find DIANA signals in rats using 7.0 and 17.2 Tesla MRI, interweaving measurements with and without stimulus.
Methods
Toi et al.1 and Choi et al.2 focused on results obtained using electrical stimulation of the whiskerpad. However, visual stimuli (Fig. S26 in ref 1) showed a much larger DIANA signal (0.5% vs 0.15%). Therefore, we endeavored to detect DIANA signals using visual stimuli.Sprague Dawley rats were spontaneously breathing oxygen enriched medical air. The animals were initially anesthetized with 3% isoflurane and 0.05 mg/kg medetomidine (Domitor, Pfizer, Karlsruhe, Germany) subcutaneous (s.c.) bolus. A continuous s.c. infusion of medetomidine (0.1mg/kg/h) was started 15 min after the bolus injection and isoflurane was discontinued. The body temperature was maintained in the range of 36–37.5°C using a circulating hot water blanket. An optical fiber was placed in front of the left eye. All animal procedures were approved by the Ministère de l'Education Nationale, de l'Enseignement Supérieur et de la Recherche (France) under reference #33846-2021110918272220.
Experiments were performed using 17.2 and 7.0 Tesla MRI systems (Bruker BioSpin, Erlangen, Germany). At 17.2 Tesla a 2cm TR/RX surface coil (RAPID Biomedical GmbH, Rimpar, Germany) was used. At 7 Tesla a receive only 2x2 array coil was used in combination with a 7.2cm ID transmit volume coil (Bruker BioSpin, Erlangen, Germany).
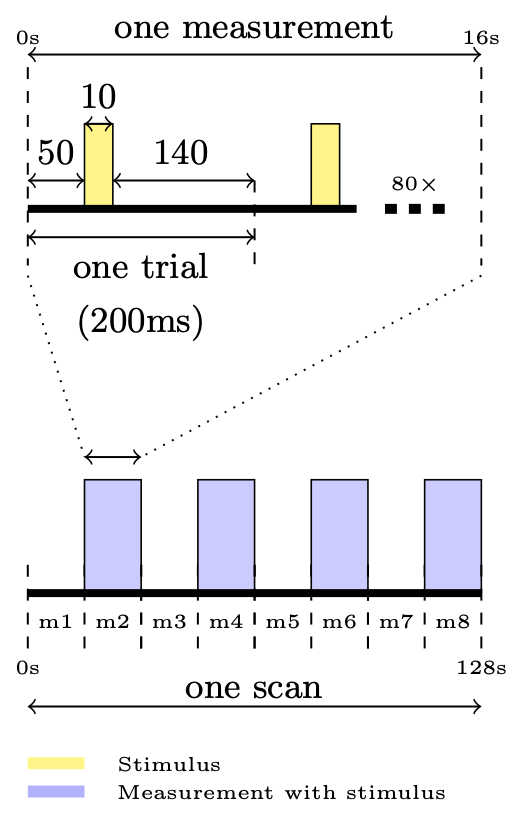
Following a BOLD based functional localizer (EPI and SPGRE based), DIANA experiments were performed using a modified version of the product SPGRE sequence in which the phase and measurement loops were swapped (TR/TE=5/1.8ms, 80x80 matrix, 250x250x1500 (μm)3, FA= 6°). To stabilize the magnetization 3200 dummy TR were played at the start of each scan2. Forty DIANA time points were collected per phase encoding step, repeated 80 times to fill all of k-space (16s per measurement). The stimulation consisted of 10ms LED-on and 190ms LED-off (Fig.1). Each scan the stimulus was kept off during odd numbered measurements. Ninety-two scans were collected across four rats, for a total of 368 measurements with and 368 without stimulus, at 7.0 and 17.2 Tesla.
When short ISI are used, the BOLD signal settles into a plateau with small signal variations on top6. To investigate the contribution of hemodynamic signal variations in DIANA experiments, we also obtained SPGRE images with traditional phase encoding (same imaging parameters).
Results & Discussion
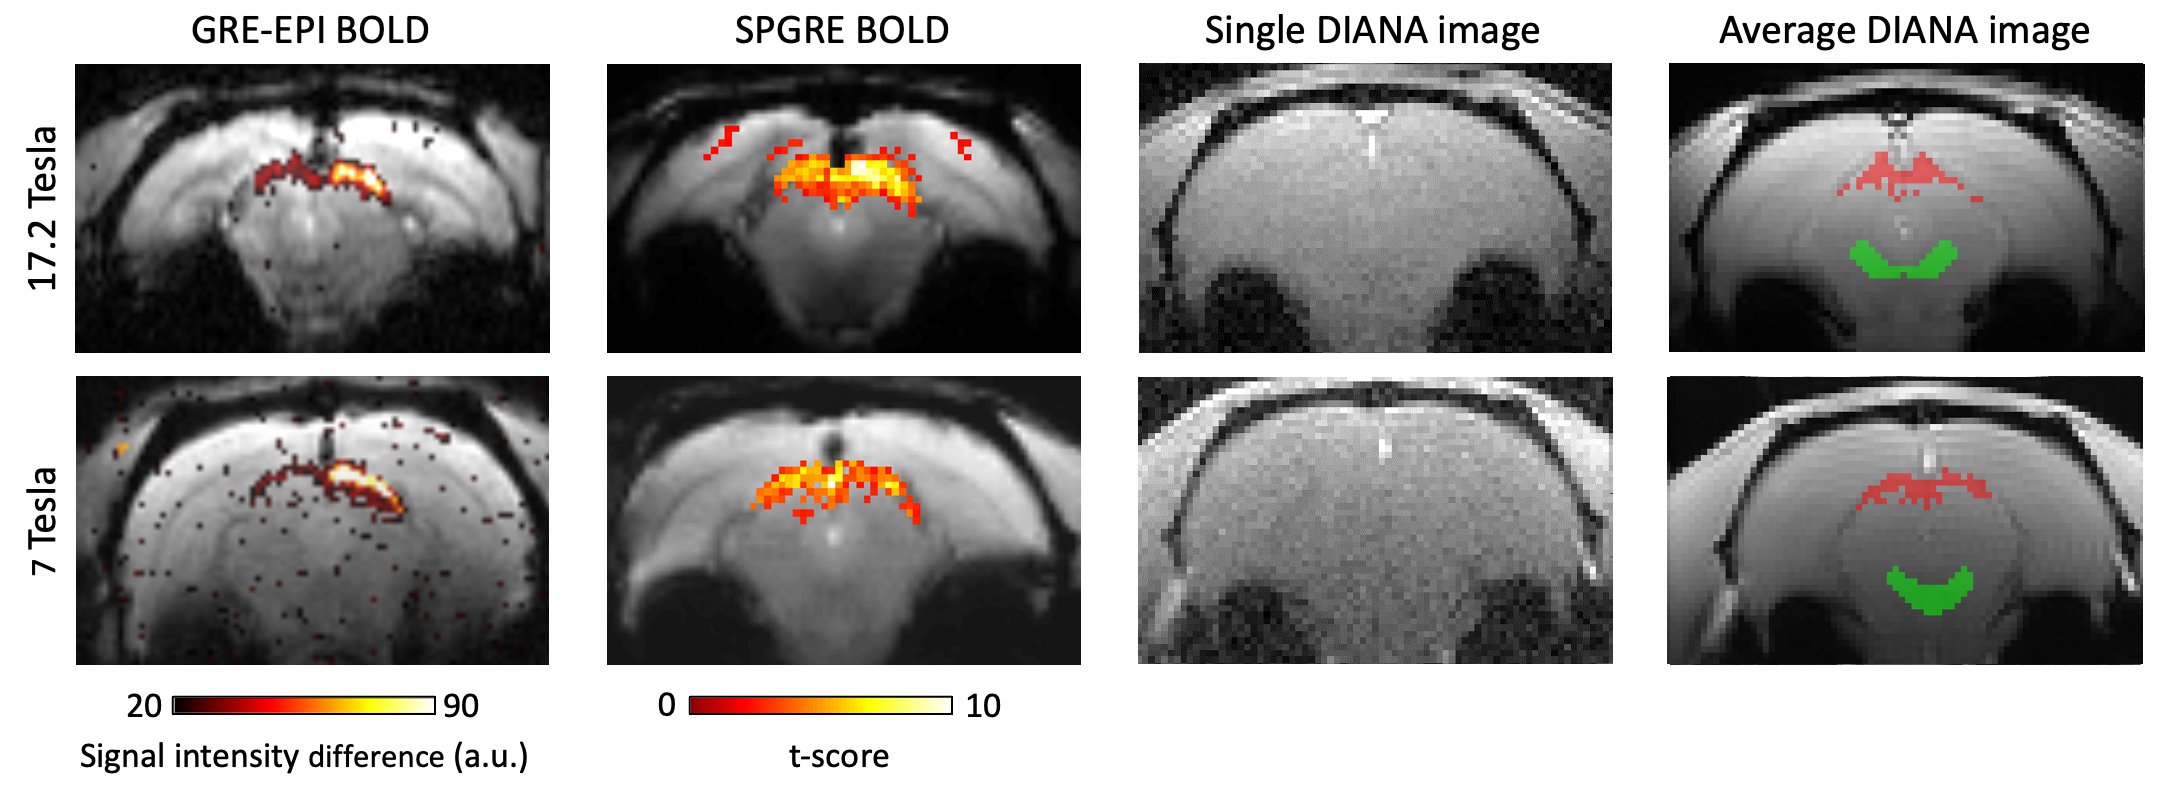
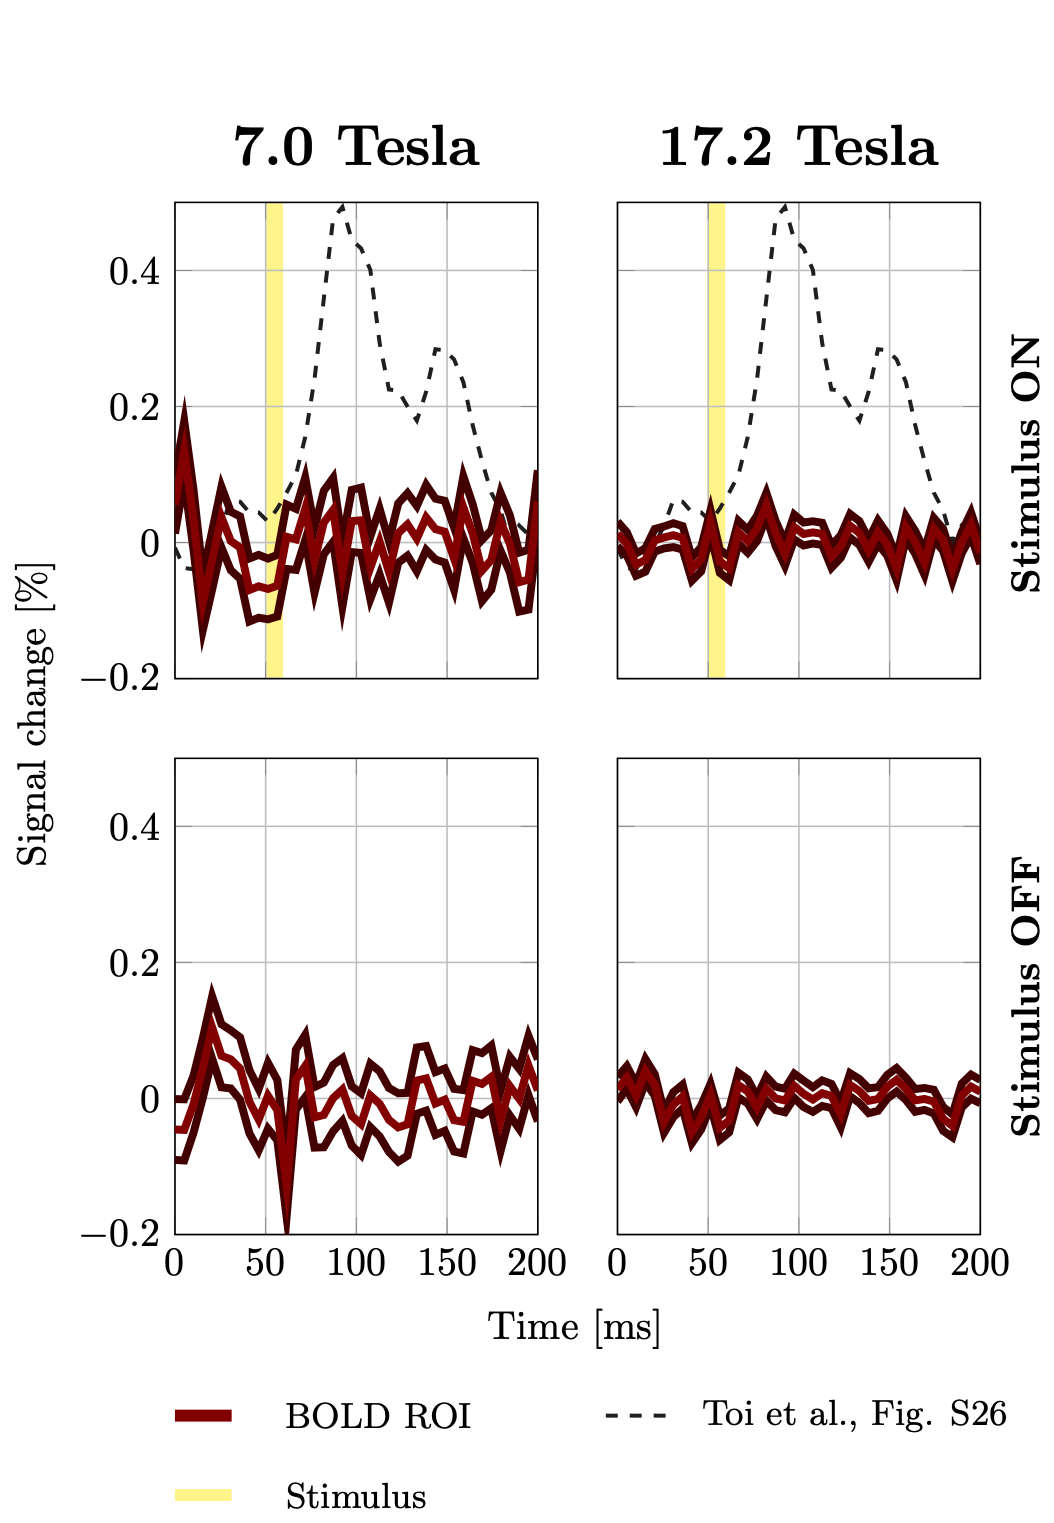
Fig.2 shows exemplary t-score maps obtained using the BOLD functional localizer (left column) the SPGRE BOLD measurement in the target slice (middle column) and a representative DIANA image with the SPGRE-BOLD based ROI super imposed (right column).Fig.3 shows the trial averaged DIANA signals. The top row shows the trial averaged signal in the BOLD ROI with the stimulus on. No distinct signal peak was observed at either field strength. For comparison, the expected DIANA signal based, on Fig. S26 in Toi et al., is shown in the background (dashed). The bottom row shows the trial averaged signal measured measurements without stimulus. Signals collected with and without stimulus look very similar. The estimated tSNR was ~80 and ~200 at 7.0 and 17.2 Tesla.
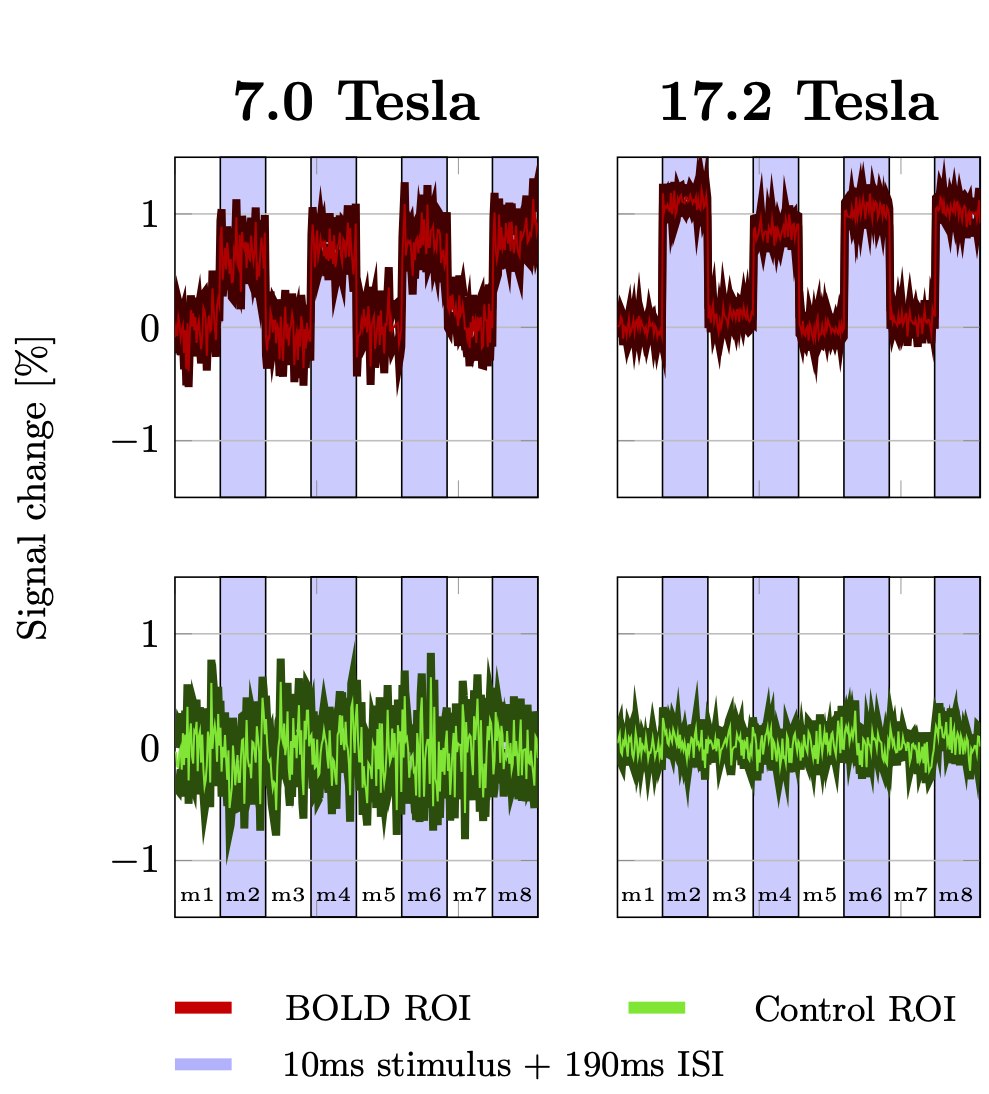
Fig.4 shows the average time course of the signal throughout one DIANA scan. With the stimulus ON, the signal increased by 0.7(1.1)% at 7.0(17.2) Tesla. No obvious signal changes were observed in the control ROI.
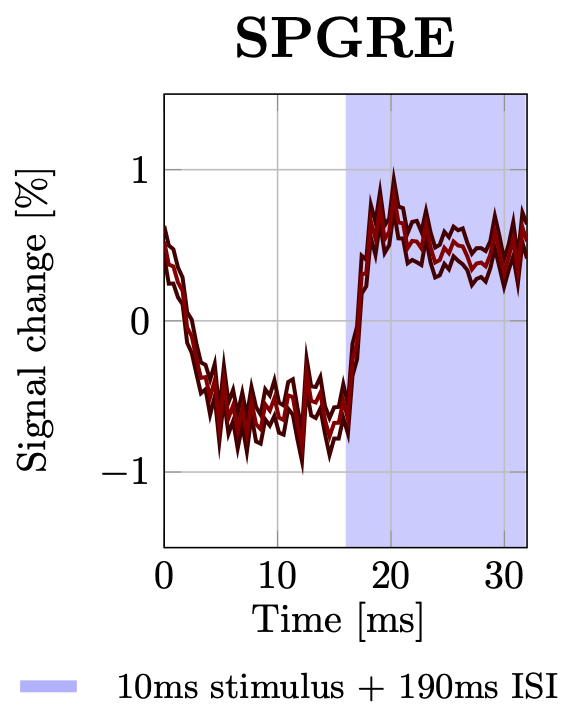
Fig.5 shows a clear (~1.5%) transient hemodynamic signal change (17.2 Tesla) captured using SPGRE measurements (0.4s temporal resolution). The hemodynamics remain unstable throughout the first couple of seconds of the DIANA measurement, suggesting we may be looking for ripples in a sea of hemodynamic waves.
Conclusion
Our failure to detect the DIANA signal, echoes findings by Hodono et al.2 and Choi et al.3, indicating DIANA is not ready for use in neuroscientific studies.Acknowledgements
This research was supported by the Australian government through Australian Research Council (ARC) Future fellowship grant (FT200100329) and by CIEL laboratory at CEA-Saclay.References
- Toi, Phan Tan, et al. "In vivo direct imaging of neuronal activity at high temporospatial resolution." Science 378.6616 (2022): 160-168. doi: https://doi.org/10.1126/science.abh4340
- Shota Hodono, et al. "Initial experiences with Direct Imaging of Neuronal Activity (DIANA) in humans." Imaging Neuroscience 1 ( 2023): 1–11. doi: https://doi.org/10.1162/imag_a_00013
- Choi, Sang-Han, et al. "No Replication of Direct Neuronal Activity-related (DIANA) fMRI in Anesthetized Mice." bioRxiv (2023): 2023-05. doi: https://doi.org/10.1101/2023.05.26.542419
- Ogawa, Seiji, et al. "Brain magnetic resonance imaging with contrast dependent on blood oxygenation." proceedings of the National Academy of Sciences 87.24 (1990): 9868-9872. doi: https://doi.org/10.1073/pnas.87.24.9868
- Park. "In vivo direct imaging of neuronal activity at high temporal and spatial resolution" In the Q&A following the talk at the International society of magnetic resonance in medicine (ISMRM) 2023 #Invited talk in the "New Currents: New Contrast Mechanisms to Image Neuronal Activity." session.
- Lewis, Laura D., et al. "Fast fMRI can detect oscillatory neural activity in humans." Proceedings of the national academy of sciences 113.43 (2016): E6679-E6685. doi: https://doi.org/10.1073/pnas.1608117113
Figures