0128
Exploring the sensitivity limits of neuronal current imaging with MRI and MEG in the human brain1Institute for Diagnostic and Interventional Neuroradiology, Support Center for Advanced Neuroimaging (SCAN), University of Bern, Bern, Switzerland, 2Center for Mind/Brain Sciences, University of Trento, Rovereto (Trento), Italy
Synopsis
Keywords: Bioeffects & Magnetic Fields, Multimodal, Spin-lock, Pulse sequence design, New Signal Preparation Schemes
Motivation: In-vivo use of Spin-lock (SL) rotary MR saturation contrast, despite encouraging phantom studies, raises questions about its sensitivity and practicality in neural magnetic field imaging.
Goal(s): Determine if SL contrast effectively maps human neuronal activation, evaluating its sensitivity and localization against MEG and 3T BOLD-fMRI.
Approach: Thirteen volunteers underwent SL-based scanning during visual stimulation, alongside BOLD and magnetoencephalography, with phantom experiments validating the paradigm and processing pipelines.
Results: Preliminary analysis revealed significant activation in the expected visual region for three subjects in SL contrast maps. Low detection was attributed to sensitivity limits estimated in the phantom, falling below MEG-estimated neural fields.
Impact: We assess Spin-lock 3T MR contrast for human neuronal activation mapping. Promising initial results highlight the need for refinement due to sensitivity limitations in neural field detection, supported by phantom MRI and MEG measures.
Introduction
Spin-lock (SL) rotary saturation contrast can detect neuronal oscillatory biomagnetic fields [1]. By applying a spin-lock pulse, the resonant frequency of the spin system is reduced to match the frequency of a target biomagnetic field, leading to local MR signal saturation. Prior phantom studies achieved sensitivity limits as low as 0.06nT[2], but in-vivo applications remain scarce and show reduced sensitivity [2,3]. This study assessed the sensitivity of two SL-based sequences for functional mapping by targeting biomagnetic fields during visual stimulation in healthy volunteers. Magnetoencephalography (MEG) and BOLD-fMRI were used as benchmarks, and phantom experiments estimated sensitivity limits under identical MRI acquisition parameters.Methods
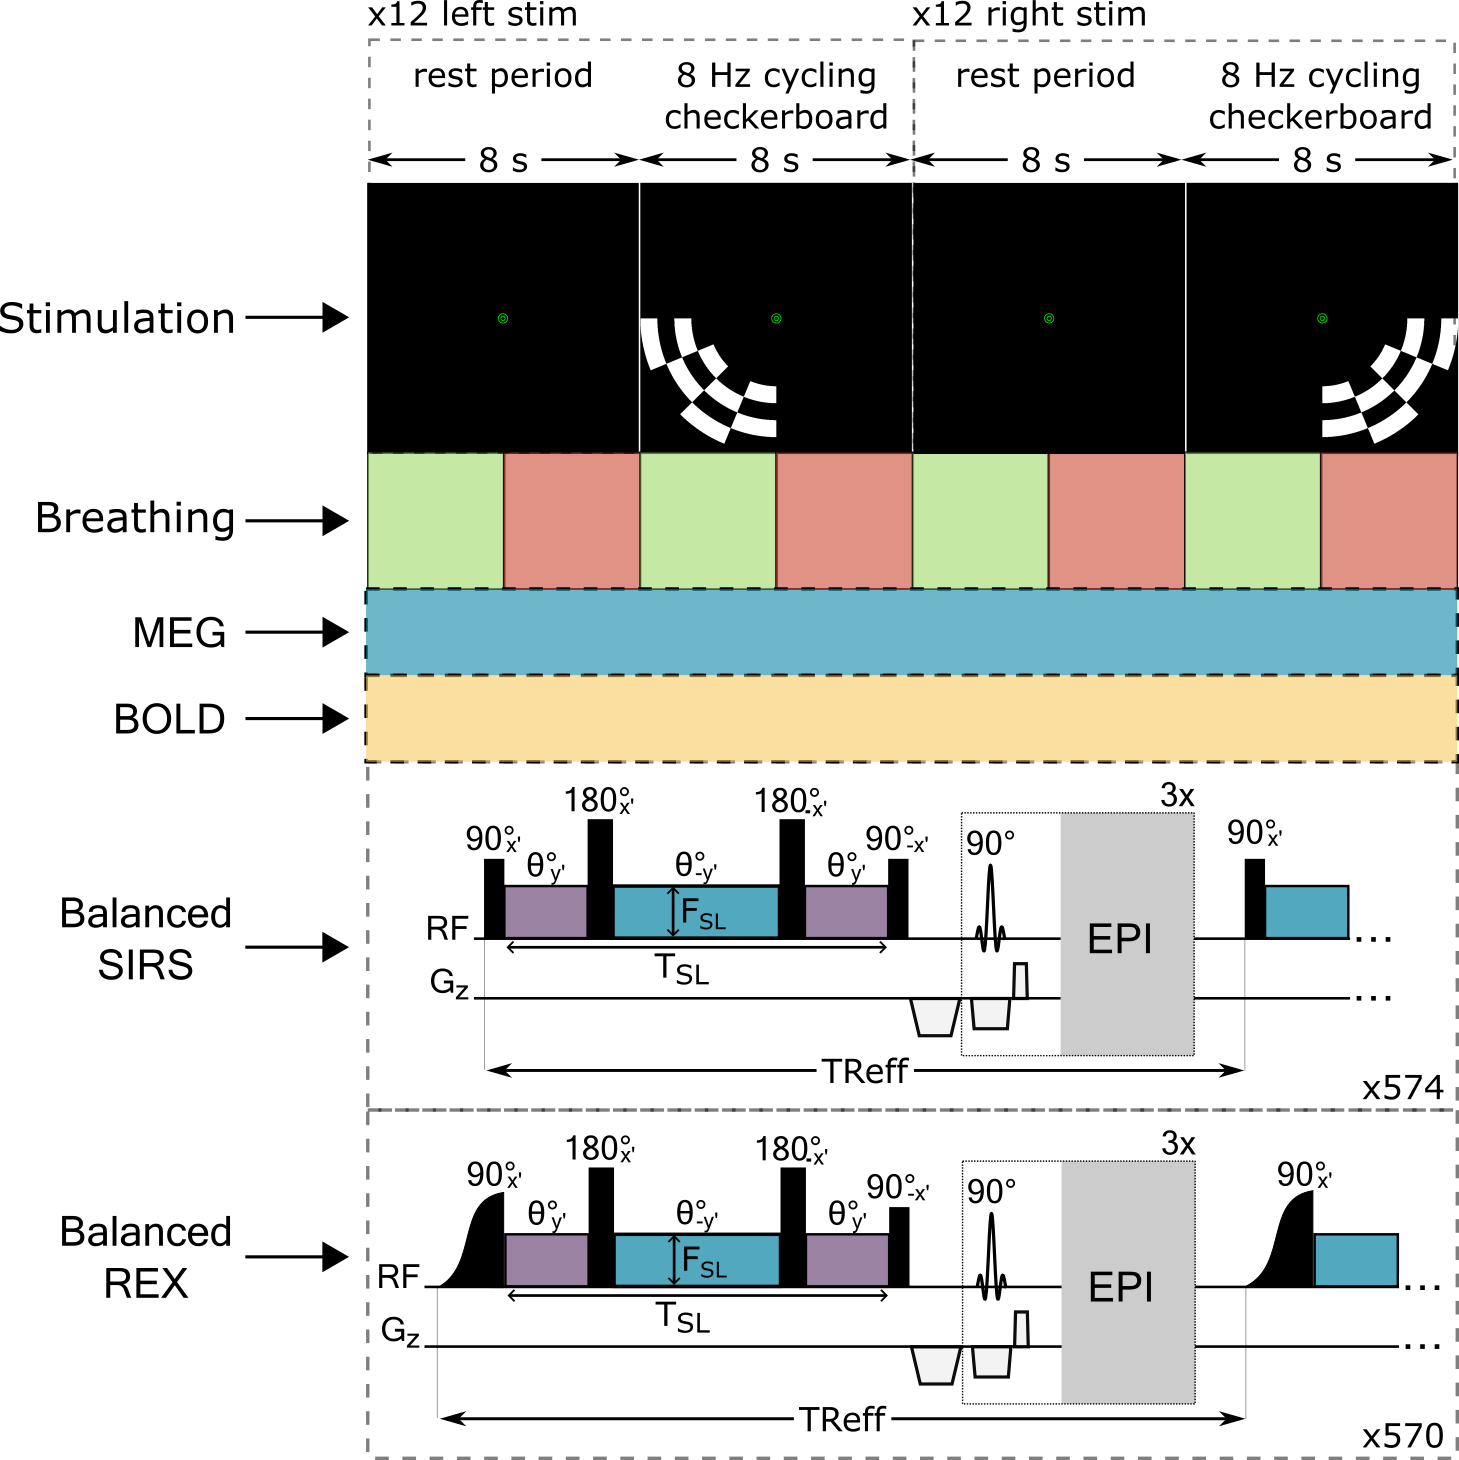
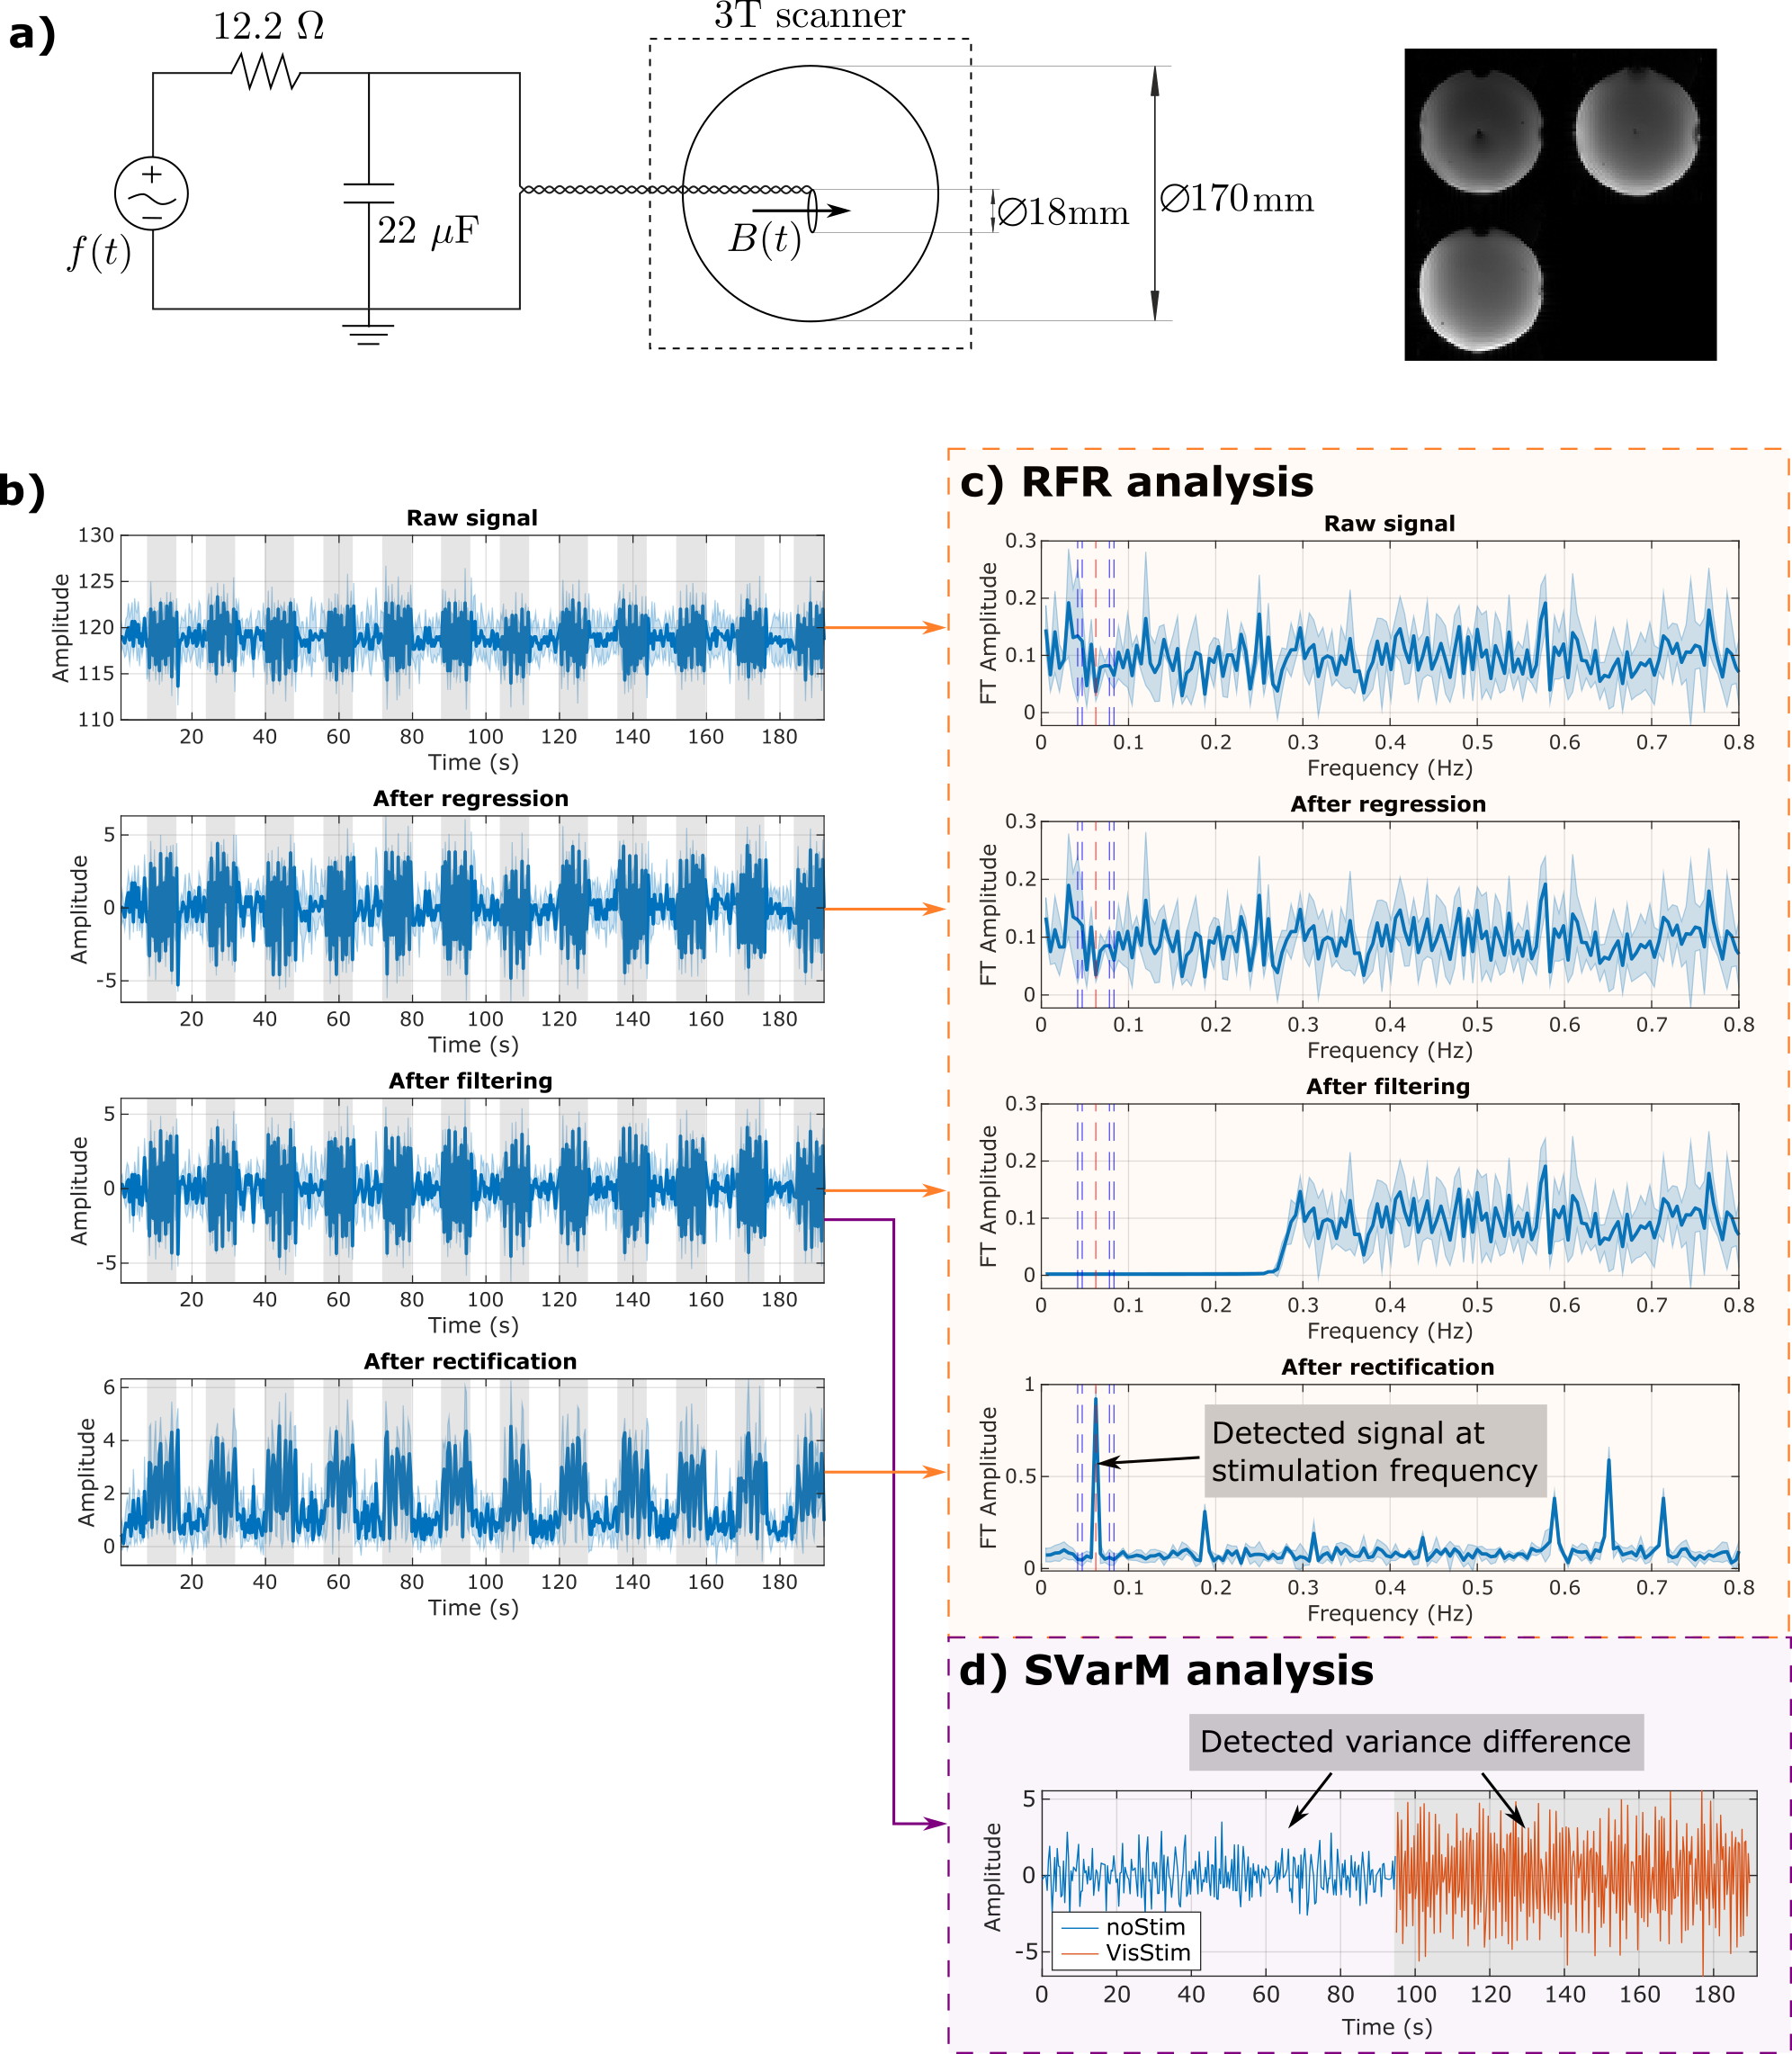
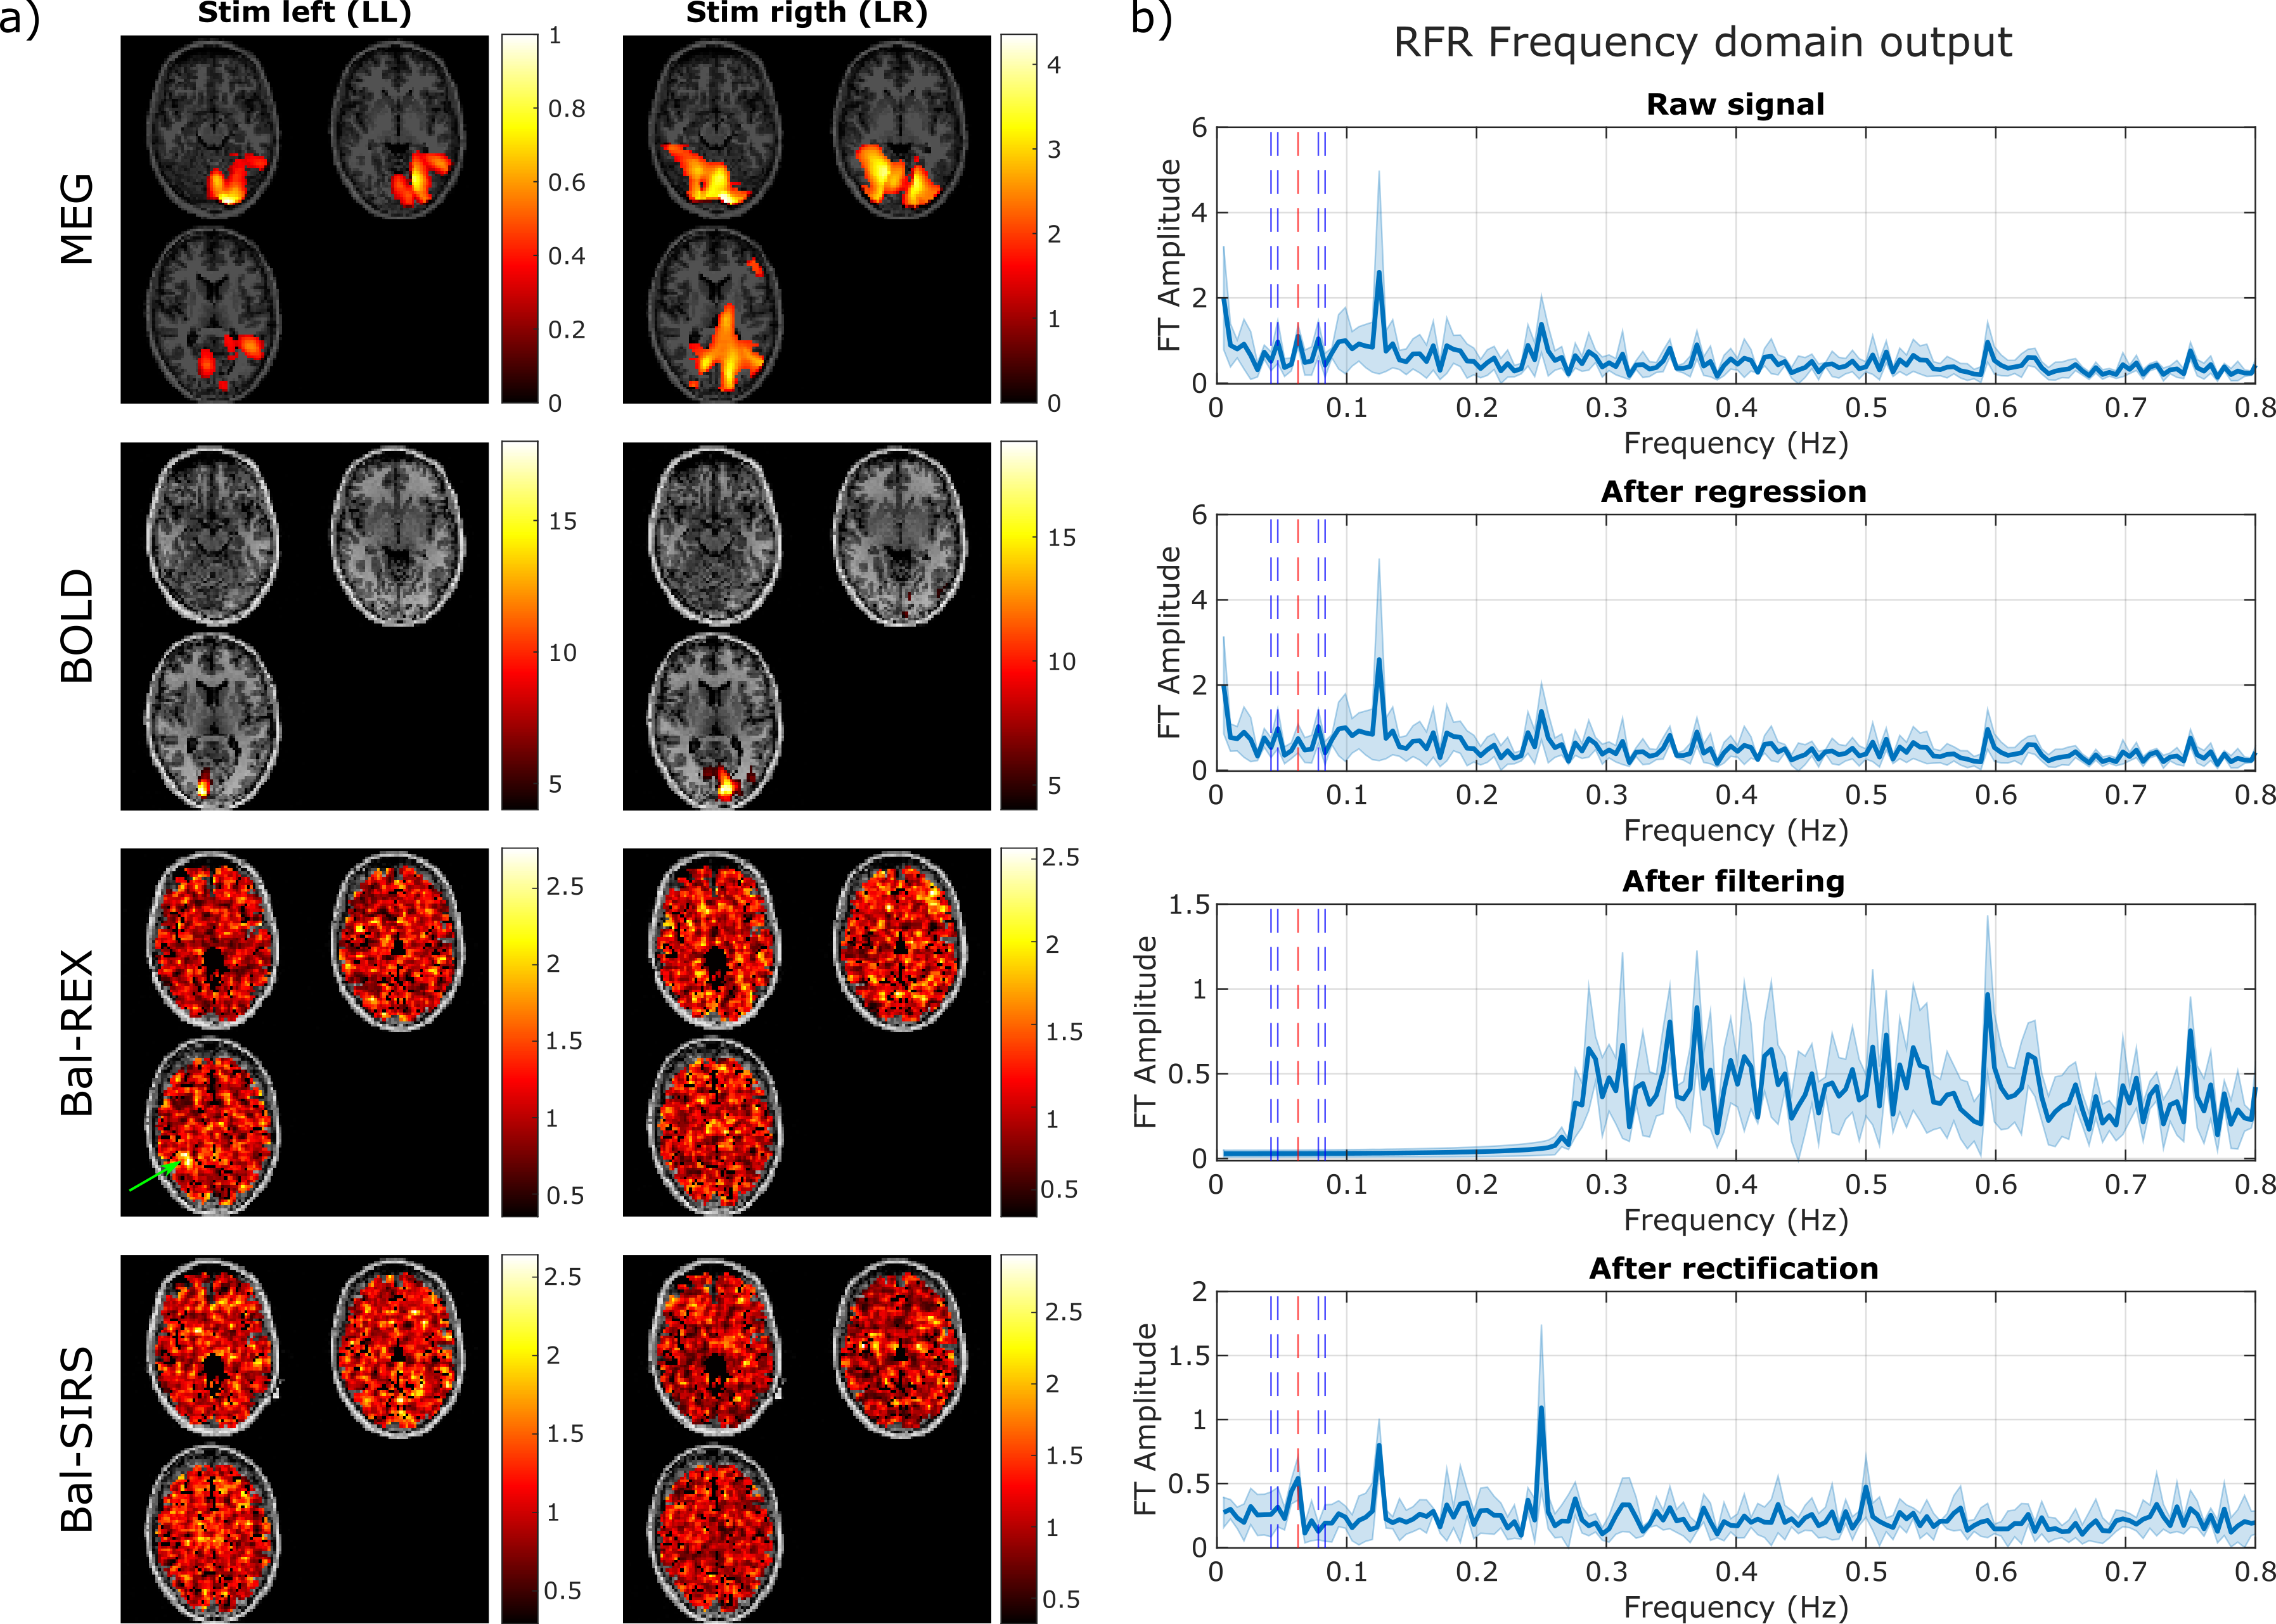
Thirteen healthy volunteers underwent scanning on a 3T whole-body scanner (Prisma, Siemens, Germany) and magnetoencephalography (VectorView, Elekta, Finland). In both modalities, participants viewed 8-second black and white checkerboard quadrant stimuli cycling at 8 Hz to induce second harmonic oscillatory brain responses at 16 Hz. These stimuli alternated with 8-second black screens. The first 12 checkerboard stimuli were in the lower left (LL) visual field, followed by 12 in the lower right (LR). In MR, Breathing was indicated via a fixation point color change every 4 seconds (Fig 1a). This protocol was applied for three MR sequences: balanced stimulus-induced rotary saturation [4,5] (Bal-SIRS, Fig 1b), balanced Rotary Excitation [6](Bal-REX, Fig 1c), and standard BOLD acquisition. All three sequences shared the same EPI readout with three slices covering the visual cortex with matrix size = 64x64x3, voxel size = 3.4x3.4x5mm3, flip angle 90°, TE = 29.8 ms, acquisition time 6.4min. Standard T1 anatomical data was also acquired.The sensitivity limit was estimated for the Bal-SIRS and Bal-REX sequences using an electrical phantom [4] (Fig 1a) that replicated the expected biomagnetic fields induced by visual stimulation (Fig 2b). SL post-processing involved the refocusing-filtering-rectification (RFR) [2] and Statistical Variance Mapping (SVarM) [7] procedures. Both pipelines include cortical parcellation to mitigate BOLD effects by regressing the intra-parcel voxel time course average. A high-pass filter further reduces low-frequency confounds (Fig 2 b). The RFR rectifies voxel time courses, converting random-phase signals to cyclic signals at the stimulation frequency (Fig 2c). Contrast maps represent the power of the RFR signal at the stimulation frequency (0.0625 Hz). Instead, SVarM separates data into on and off blocks and tests for significant differences by Levene’s test on variance (Fig 2d). Standard SPM-based GLM analysis assessed the BOLD responses.
From MEG planar gradiometers data, the source of oscillatory biomagnetic activity was localized using Dynamic Imaging of Coherent Sources [8] and co-registered to T1 anatomical MRI. Activity stemming from the left/right stimulation was contrasted with activity at resting state to exploit regions of interest where the stimulation-induced biomagnetic activity at 16 Hz significantly differed from spontaneous ongoing oscillations. A permutation-based non-parametric approach was used for statistical analysis.
Results
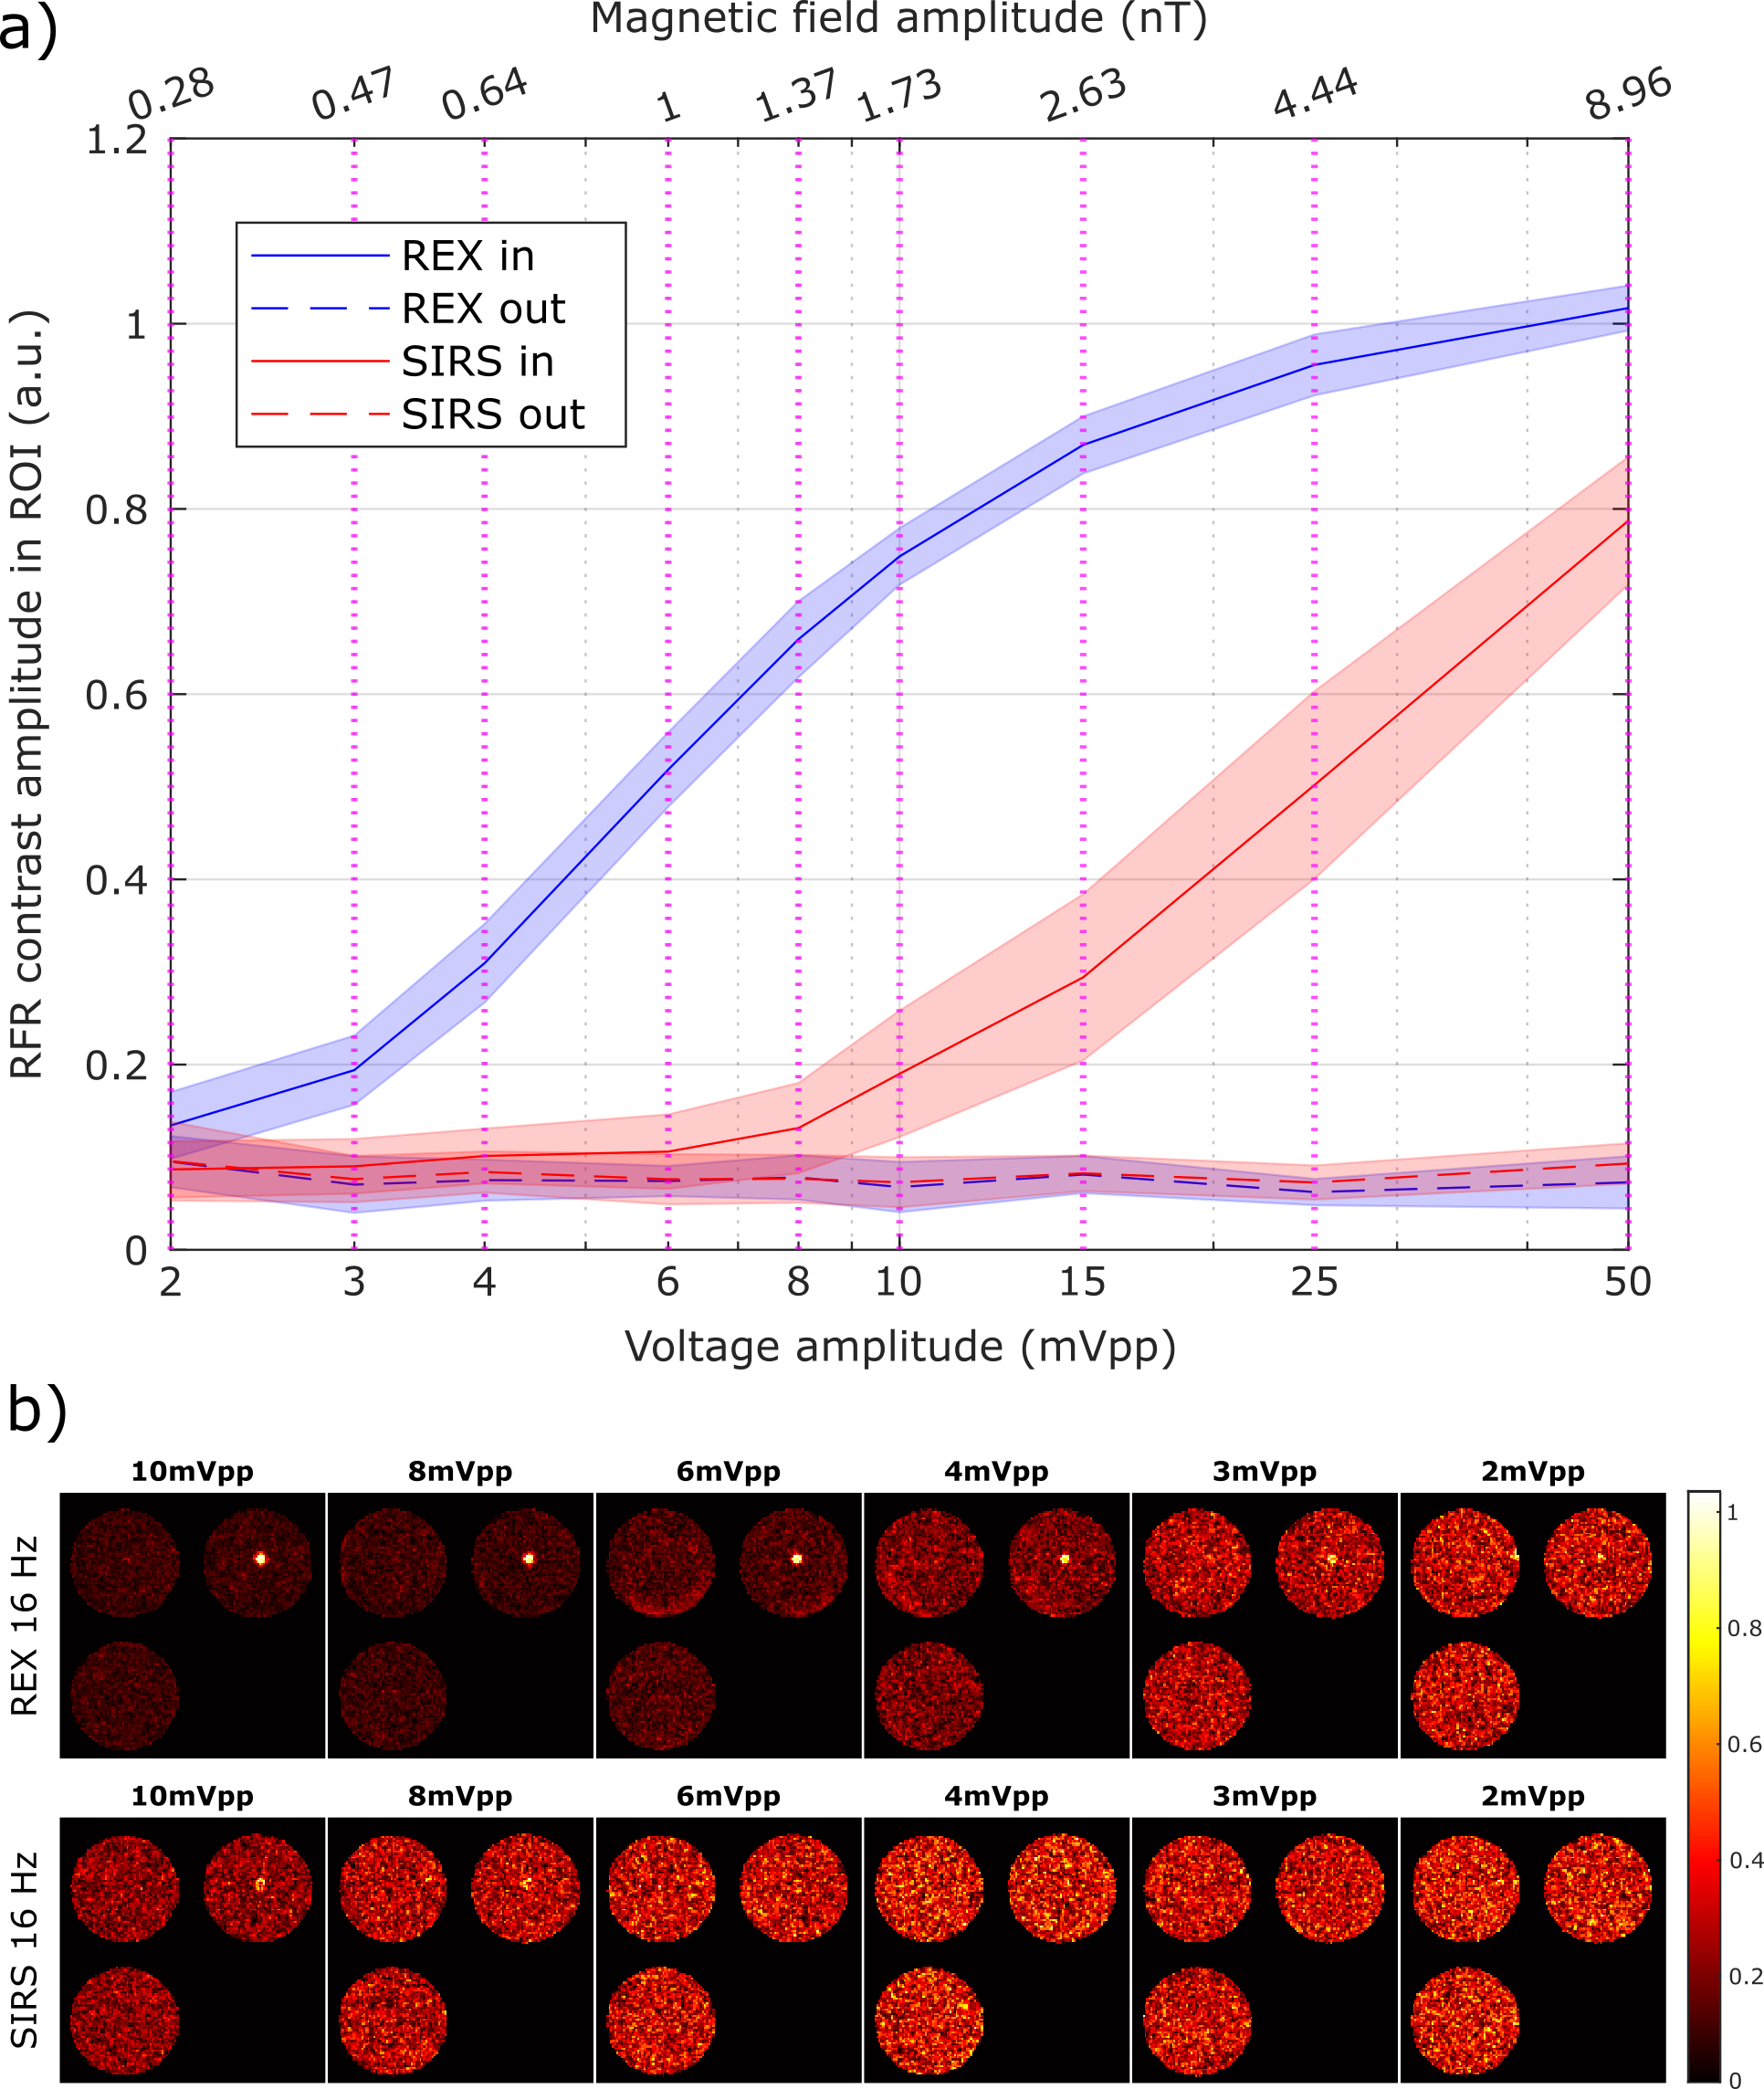
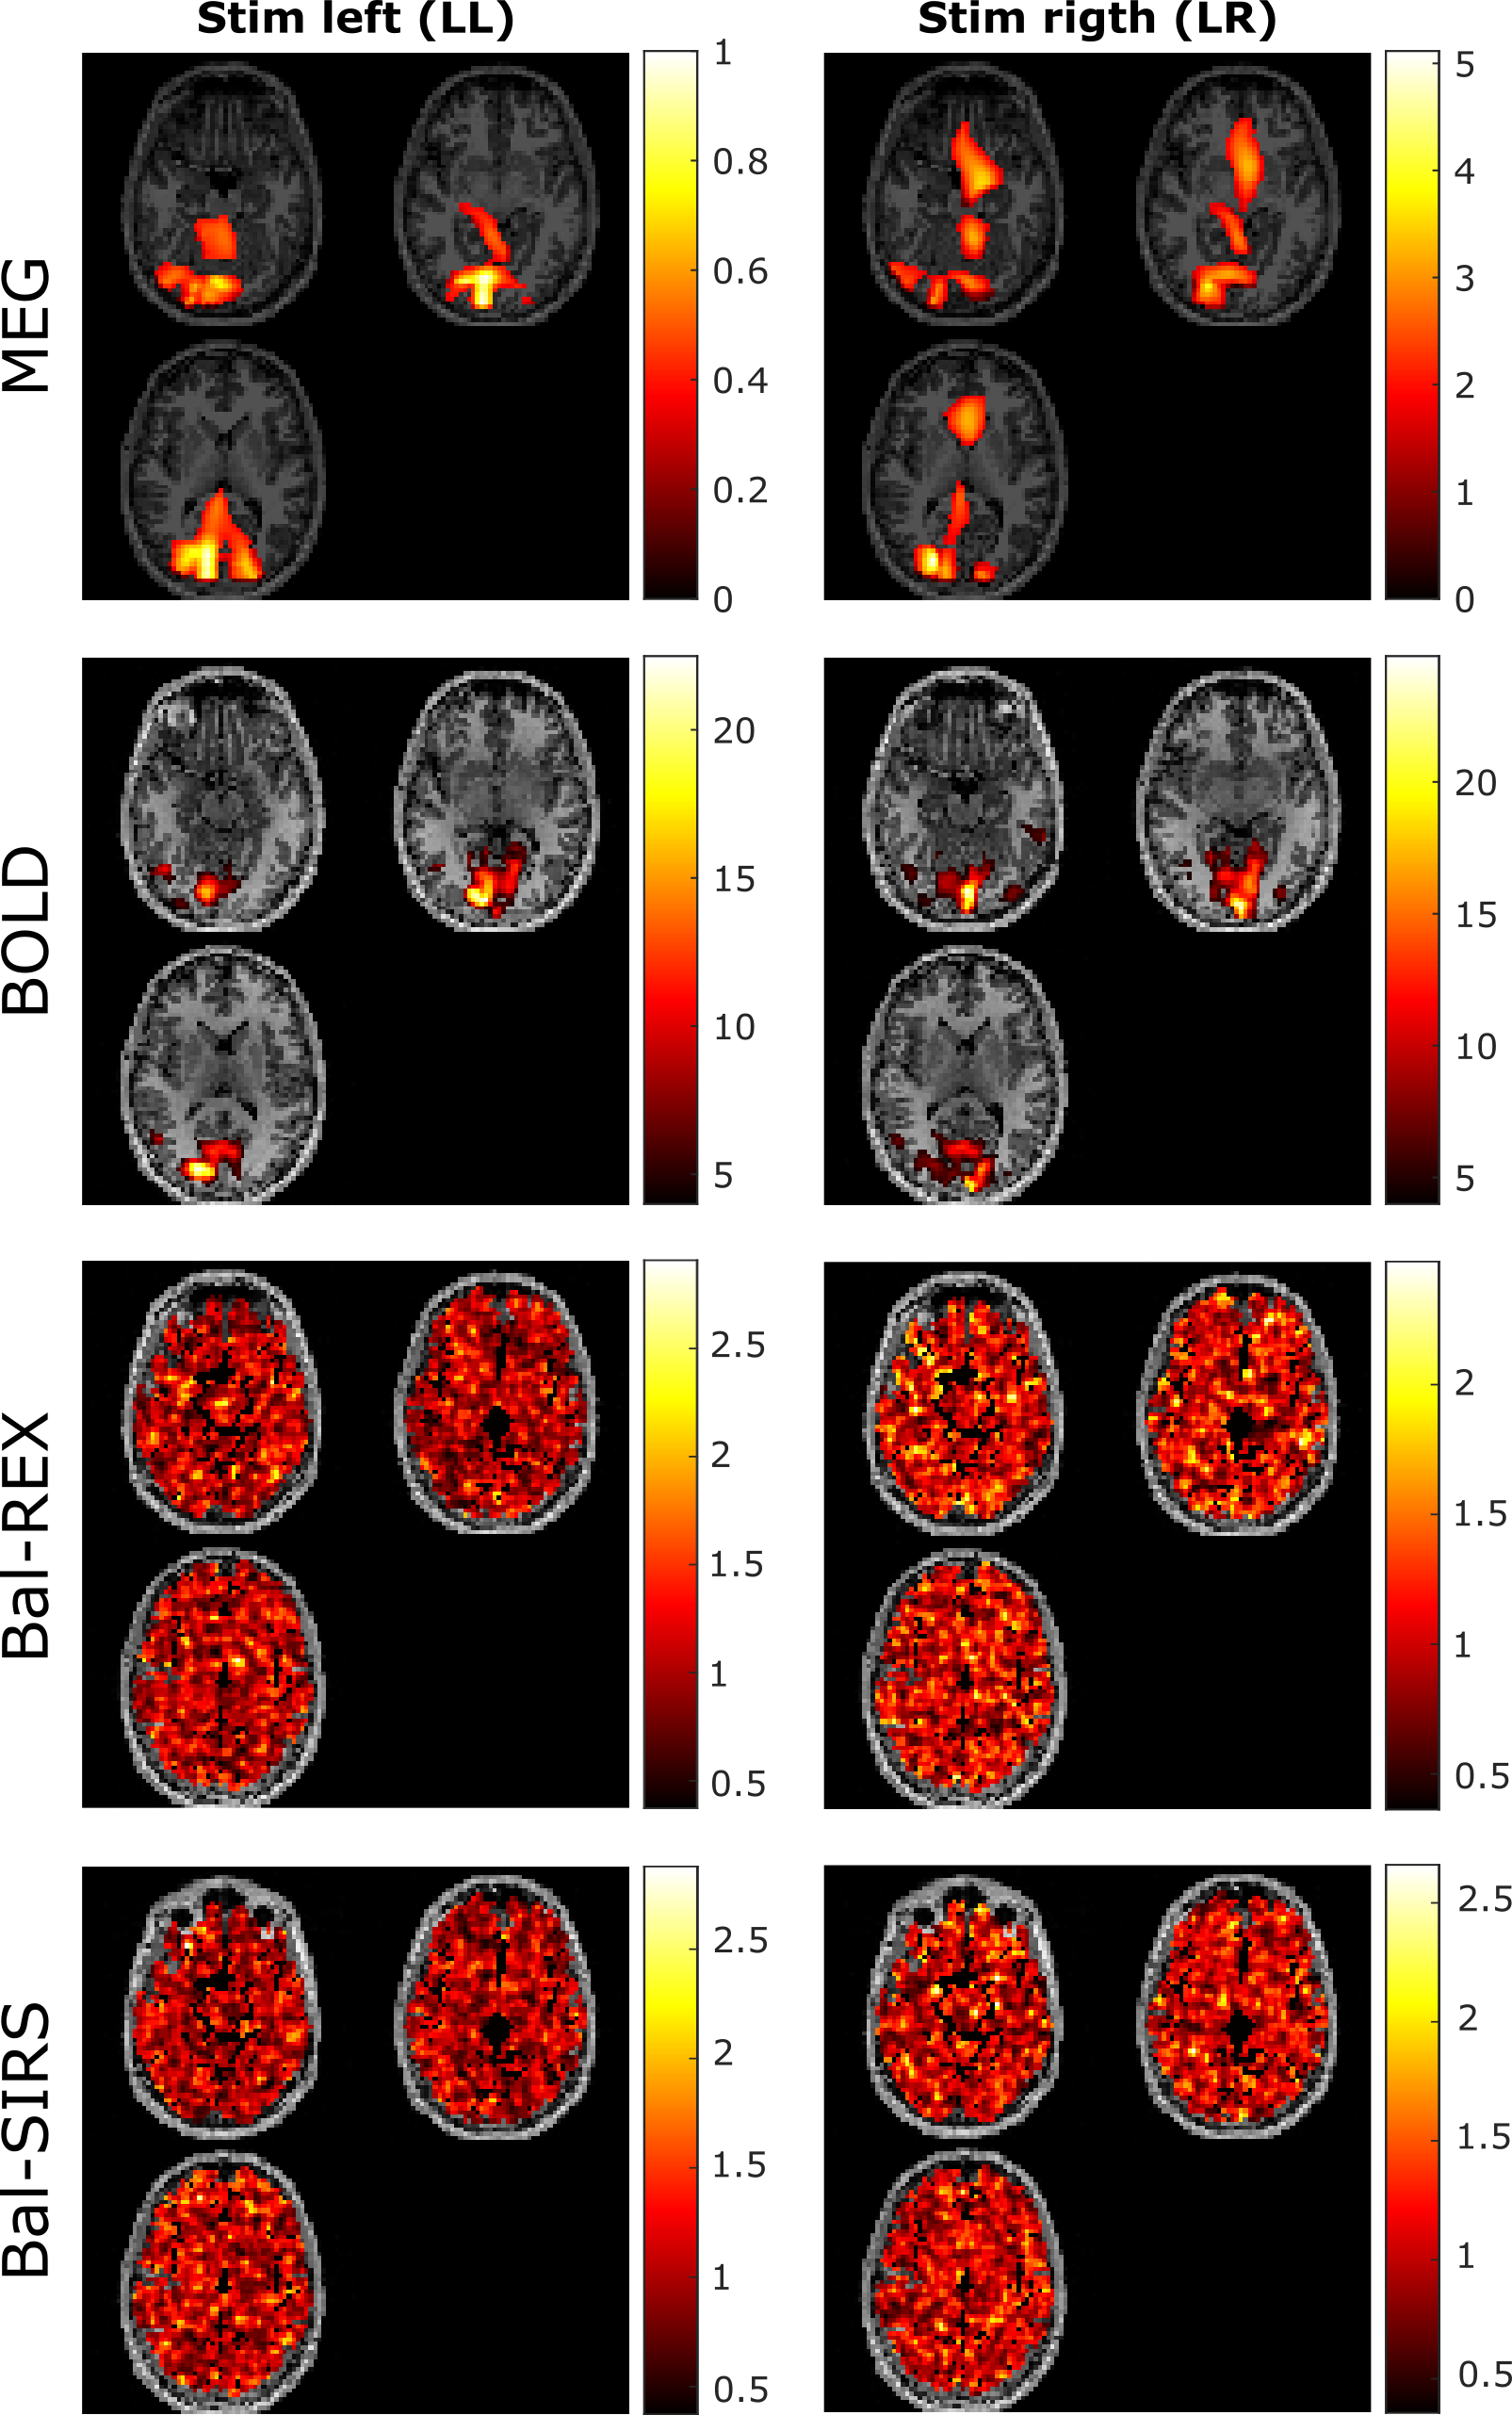
The phantom experiment determined a sensitivity limit of 0.2nT for Bal-REX acquisition (Fig 3a) and 0.6nT for Bal-SIRS acquisition with the RFR pipeline (Fig 3b). The same limits were found with SVarM for both techniques.Figure 4 shows the contrast maps of a representative subject in the four modalities. Despite scattered highlighted areas, there's no significant activation detected within the BOLD-fMRI-defined ROI. There's also no observable overlap between the contrast and the MEG maps. The local field intensity, derived from MEG occipital sensors at 16 Hz for LL and LR stimulations, measures 0.07 nT, slightly below the sensitivity threshold in the phantom.
We tested the activation in the fMRI-BOLD statistically activated regions for both RFR and SVarM. RFR found significant activation in 2 of 13 subjects where only the Bal-REX 16Hz was positive, and SVarM found three significant cases within Bal-REX. The contrast maps for a positive detection with RFR are displayed in Fig 5a. While the activated area is not visually evident, areas with higher contrast can be observed around the visual cortex region. The frequency domain response in an area with higher contrast is displayed in Fig 5b, showing the small peak at the stimulation frequency leading to higher contrast.
Conclusions
The MEG experiment confirmed the stimulation-induced activity with 16 Hz fluctuations in the left/right visual cortex but with a magnitude estimated to be approximately three times lower relative to our phantom sensitivity limit. Consistently with this, while BOLD-fMRI provides the expected activation in the visual cortex on most subjects, neural current effects for both spin-lock sequences were less reliable (3 of 13 subjects). Future efforts will prioritize enhancing sensitivity for detecting normal physiological activity, while current brain applications are better suited for pathologies with activity amplitudes exceeding physiological levels.Acknowledgements
This project was funded by the ISMRM research exchange 2022 grant “In-vivo multimodal validation of magnetic resonance-based neuronal current imaging sequences.” This work also received funding from the consortium “Predict and Monitor Epilepsy After a First Seizure: The Swiss-First Study” from the Swiss National Science Foundation (SNSF, CRSII5-180365).References
1. Witzel, Thomas, et al. "Stimulus-induced Rotary Saturation (SIRS): a potential method for the detection of neuronal currents with MRI." Neuroimage 42.4 (2008): 1357-1365.
2. Truong, Trong‐Kha, et al. "Toward direct MRI of neuro‐electro‐magnetic oscillations in the human brain." Magnetic resonance in medicine 81.6 (2019): 3462-3475.
3. Chai, Yuhui, et al. "Direct detection of optogenetically evoked oscillatory neuronal electrical activity in rats using SLOE sequence." NeuroImage 125 (2016): 533-543.
4. Capiglioni, Milena, et al. "Analysis of the robustness and dynamics of spin-locking preparations for the detection of oscillatory magnetic fields." Scientific Reports 12.1 (2022): 1-104.
5. Gram, Maximilian, et al. "Balanced spin‐lock preparation for B1‐insensitive and B0‐insensitive quantification of the rotating frame relaxation time T1ρ." Magnetic Resonance in Medicine 85.5 (2021): 2771-2780.
6. Gram, Maximilian, et al. “Towards robust in vivo quantification of oscillating biomagnetic fields using Rotary Excitation based MRI.” Sci Rep 12, 15375 (2022).
7. Coletti, Chiara, et al. "Functional MRI of neuro-electro-magnetic oscillations: Statistical processing in the presence of system imperfections." 2020 IEEE-EMBS Conference on Biomedical Engineering and Sciences (IECBES). IEEE, 2021.
8. Gross, Joachim, et al. "Dynamic imaging of coherent sources: studying neural interactions in the human brain." Proceedings of the National Academy of Sciences 98.2 (2001): 694-699.
Figures