0125
Characterization of liver inflammation in non-alcoholic steatohepatitis using MRI cytometry1Vanderbilt University Medical Center, Nashville, TN, United States, 2Vanderbilt University Medical Center, nashville, TN, United States
Synopsis
Keywords: Microstructure, Diffusion/other diffusion imaging techniques
Motivation: Addressing the unmet need for non-invasive non-alcoholic steatohepatitis (NASH) diagnosis.
Goal(s): Assessing MRI cytometry’s potential for quantifying alterations in cell sizes and cell densities linked to inflammation, a critical factor in NASH diagnosis.
Approach: Histology-based simulations were used to assess MRI cytometry's performance across various SNR levels in normal and NASH liver tissues. Additionally, used MRI cytometry to distinguish healthy liver from NASH with a clinical 3T scanner.
Results: Both simulations and in vivo data revealed increased cell density and reduced cell sizes in inflammatory areas compared to steatosis and healthy liver tissues.
Impact: Findings of this study establish a strong foundation for future investigations into the role of non-invasive assessment of liver cellular characteristics in diagnosing NASH, with the ultimate goal of reducing the necessity for liver biopsy.
Introduction
The ability to differentiate NASH from simple steatosis is critically important for the clinical management of Nonalcoholic fatty liver disease (NAFLD) patients [1]. While individuals with simple steatosis alone are generally thought to have a relatively benign long-term prognosis, up to a quarter of these patients may develop NASH, which can progress to cirrhosis [2], a potent risk factor for the development of hepatocellular carcinoma (HCC). The current gold standard for diagnosing and staging NASH involves the NASH Clinical Research Network (NASH CRN) scoring system, which assesses the Nonalcoholic Fatty Liver Disease Activity Score (NAS) and fibrosis staging through liver biopsy. NAS comprises scores for steatosis, lobular inflammation, and ballooning. A non-invasive method for distinguishing NASH from simple fatty liver, is essential for patient safety and efficient resource allocation. While MRI-based Proton Density Fat Fraction (PDFF) and elastography reliably quantify steatosis [3] and fibrosis [4], respectively, there remains a significant gap in non-invasive methods for assessing inflammation in NASH. As liver inflammation involves smaller-sized inflammatory cells (<10 µm) in contrast to hepatocytes (15 – 25 µm), the primary functional cells in the liver, we propose that MRI cytometry can fill this gap by quantifying changes in liver cell size and density associated with inflammation.Methods
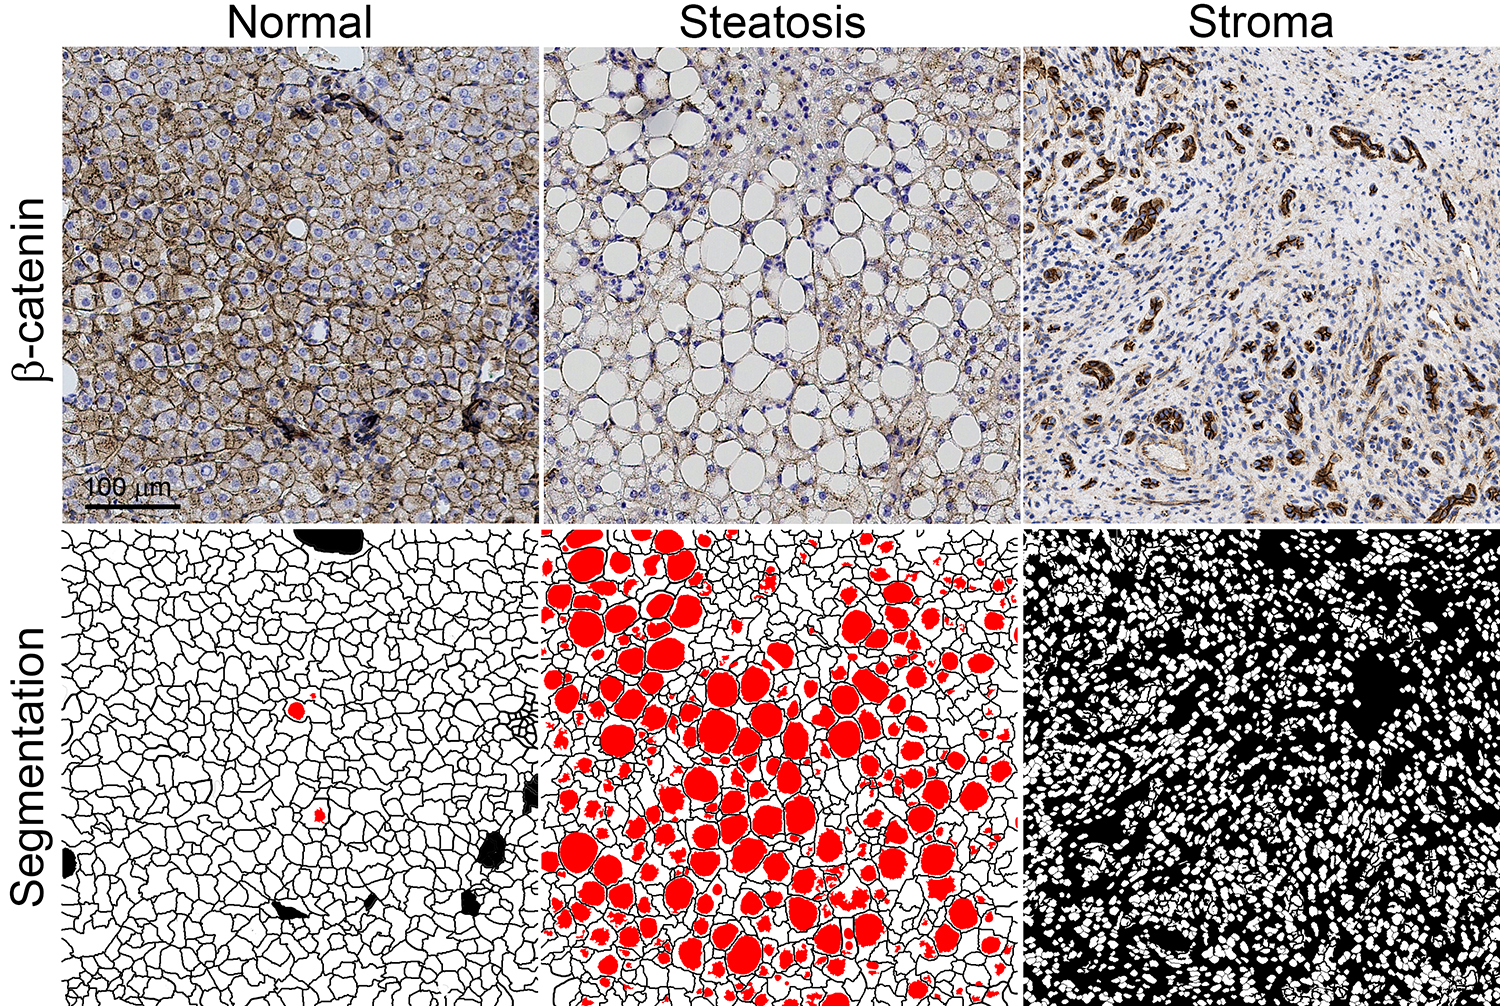
Theory: MRI cytometry integrates measurements of water diffusion rates over various time scales, corresponding to probing cellular microstructures at different distances [5]. The size range of most relevance in liver is 5 µm to 25 µm (e.g., hepatocytes ~ 15 – 25 µm, inflammatory cells ~ 5 – 10 µm), which corresponds to diffusion times of approximately 5 - 70 ms. These diffusion times can be achieved using a combination of OGSE (oscillating gradient spin echo) and PGSE (pulsed gradient spin echo) measurements. Microstructural properties are extracted by fitting multi-b value-multi-diffusion time fat-suppressed diffusion-weighted MRI signals to a three-compartment model (blood, intra and extracellular water). Histology-based simulation: Segmented histological images of normal human liver tissue, steatosis, and stroma (comprising inflammatory cells and fibrosis) served as input structures for computer simulations (Figure 1). MRI cytometry analysis was conducted on PGSE and OGSE signals at three SNR levels (10, 20, and 50), generated using MATI, an in-house diffusion MRI simulation toolbox. In vivo human imaging: MRI cytometry was also conducted in a healthy subject and a NASH patient using Philips Ingenia CX 3T scanner with a dStream TorsoCardiac coil. A PGSE sequence with diffusion gradient duration δ / diffusion gradient separation Δ = 12/74 ms was used to collect diffusion data at a relatively long diffusion time (70 ms). Shorter diffusion times were achieved using a cosine-modulated trapezoidal OGSE sequence with gradient frequencies of 25 and 50 Hz. Five b values (0, 250, 500, 750, and 1000 s/mm2) were used for PGSE and 25 Hz OGSE acquisitions. For 50 Hz OGSE acquisitions, four b values (0, 100, 200, and 300 s/mm2) were used. The total scan time ≈ 12 mins. The SNRs of b0 images are about 20. The fat fraction was measured by a clinical standard mDixon sequence.Results and discussion
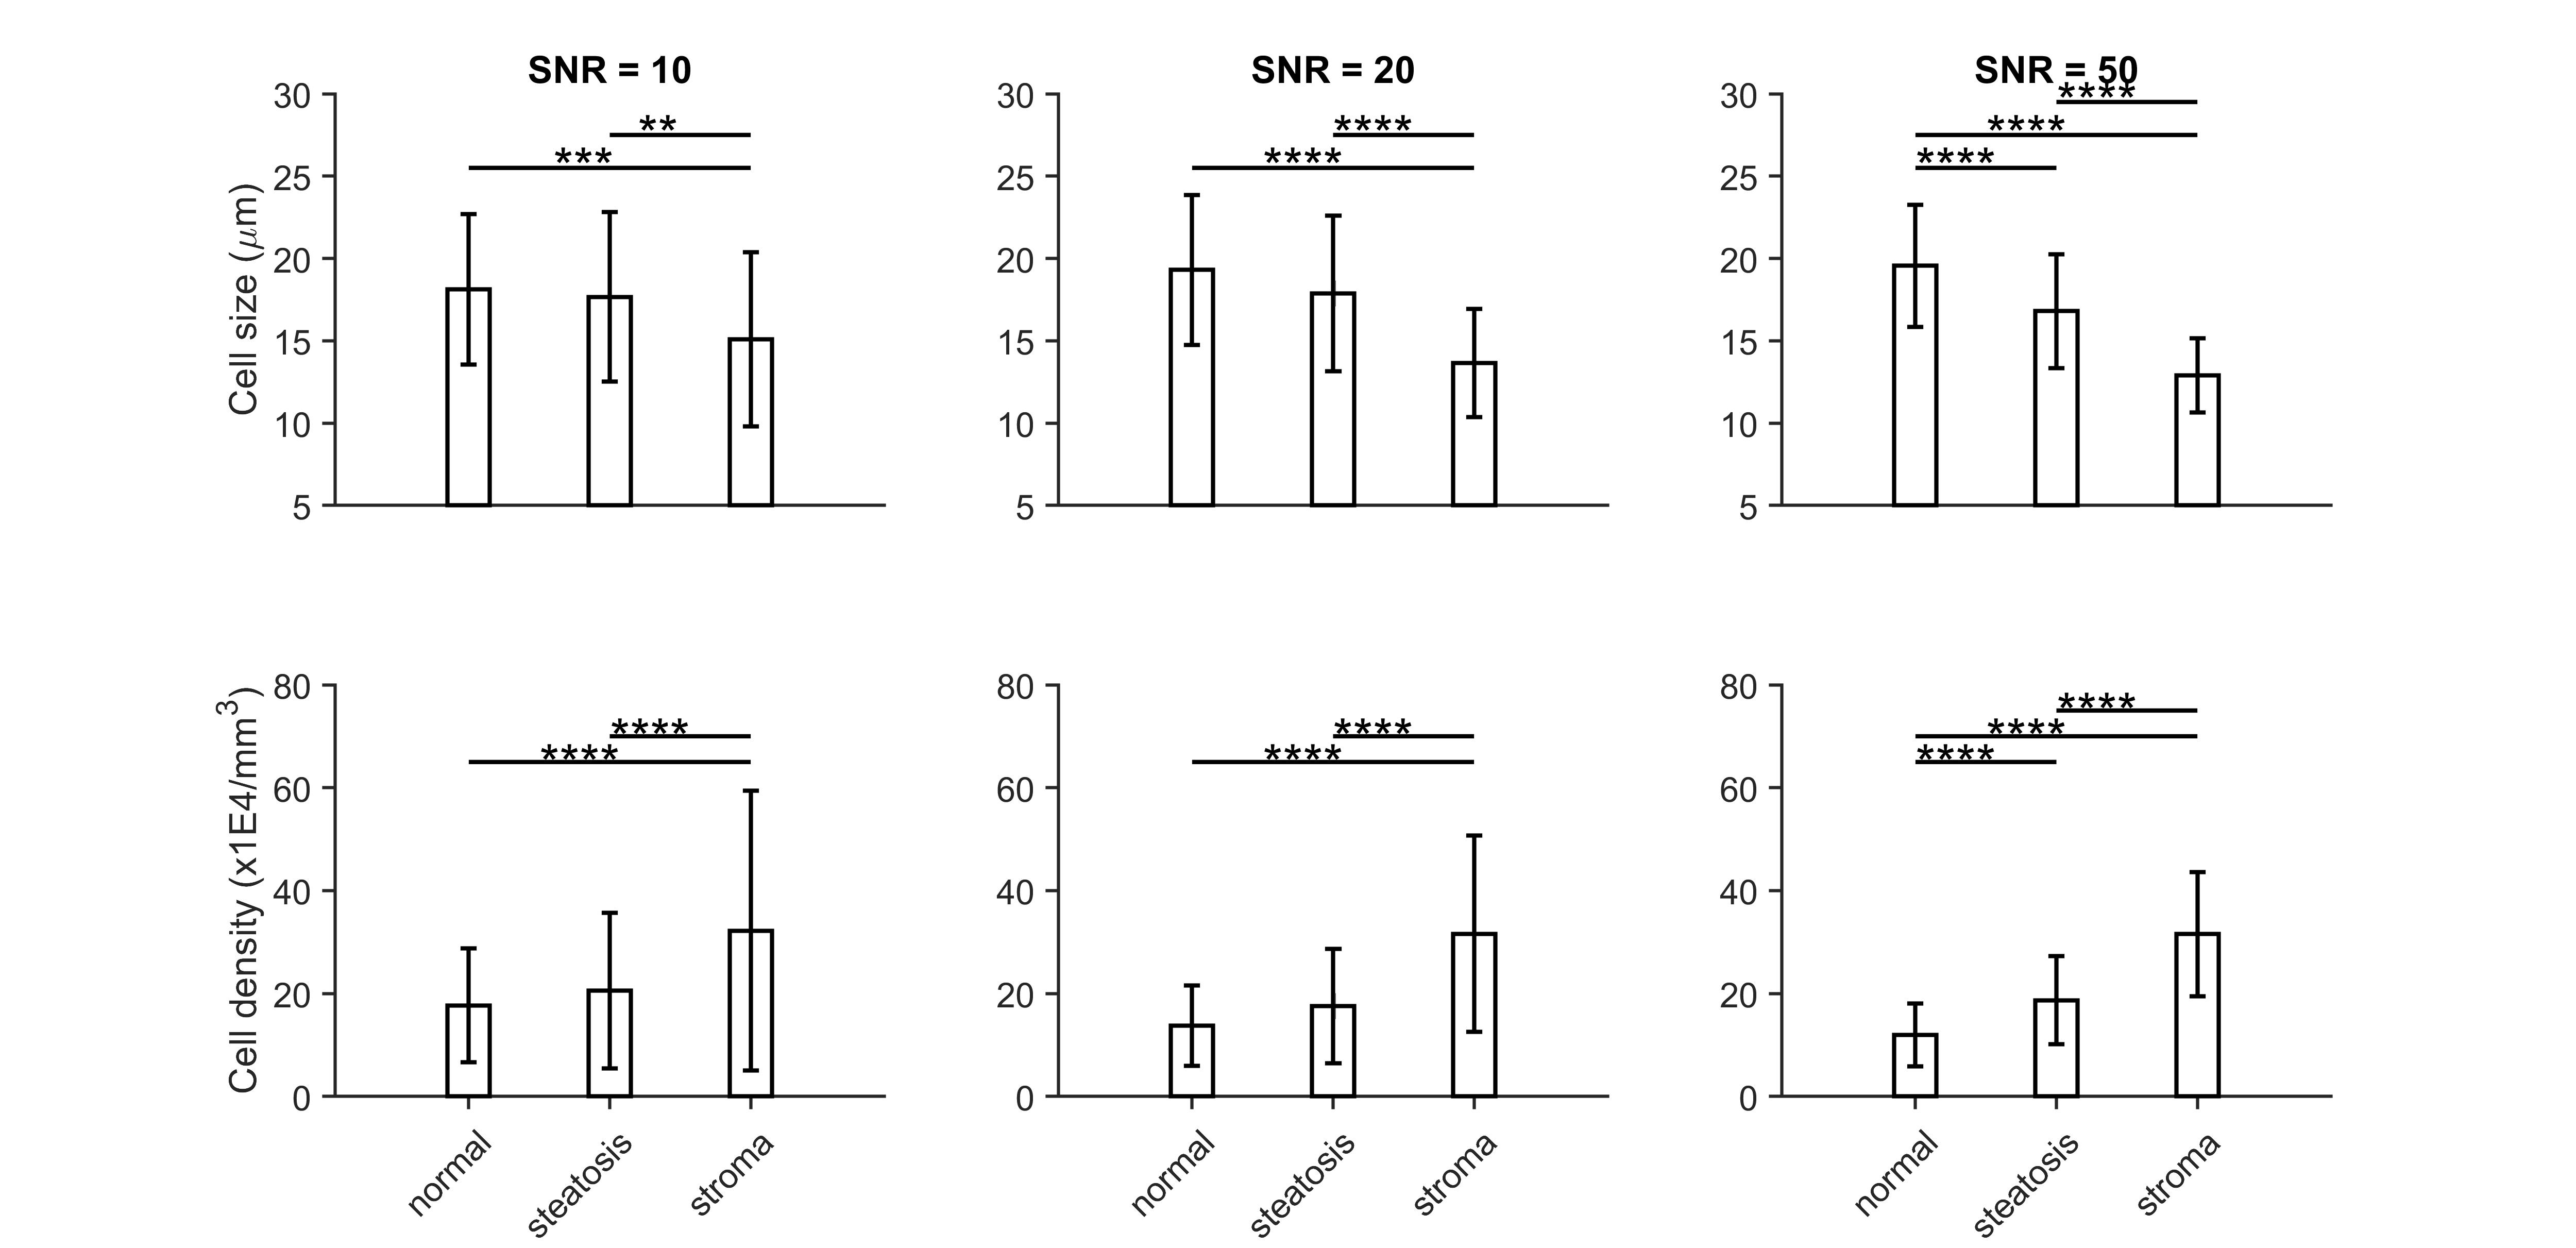
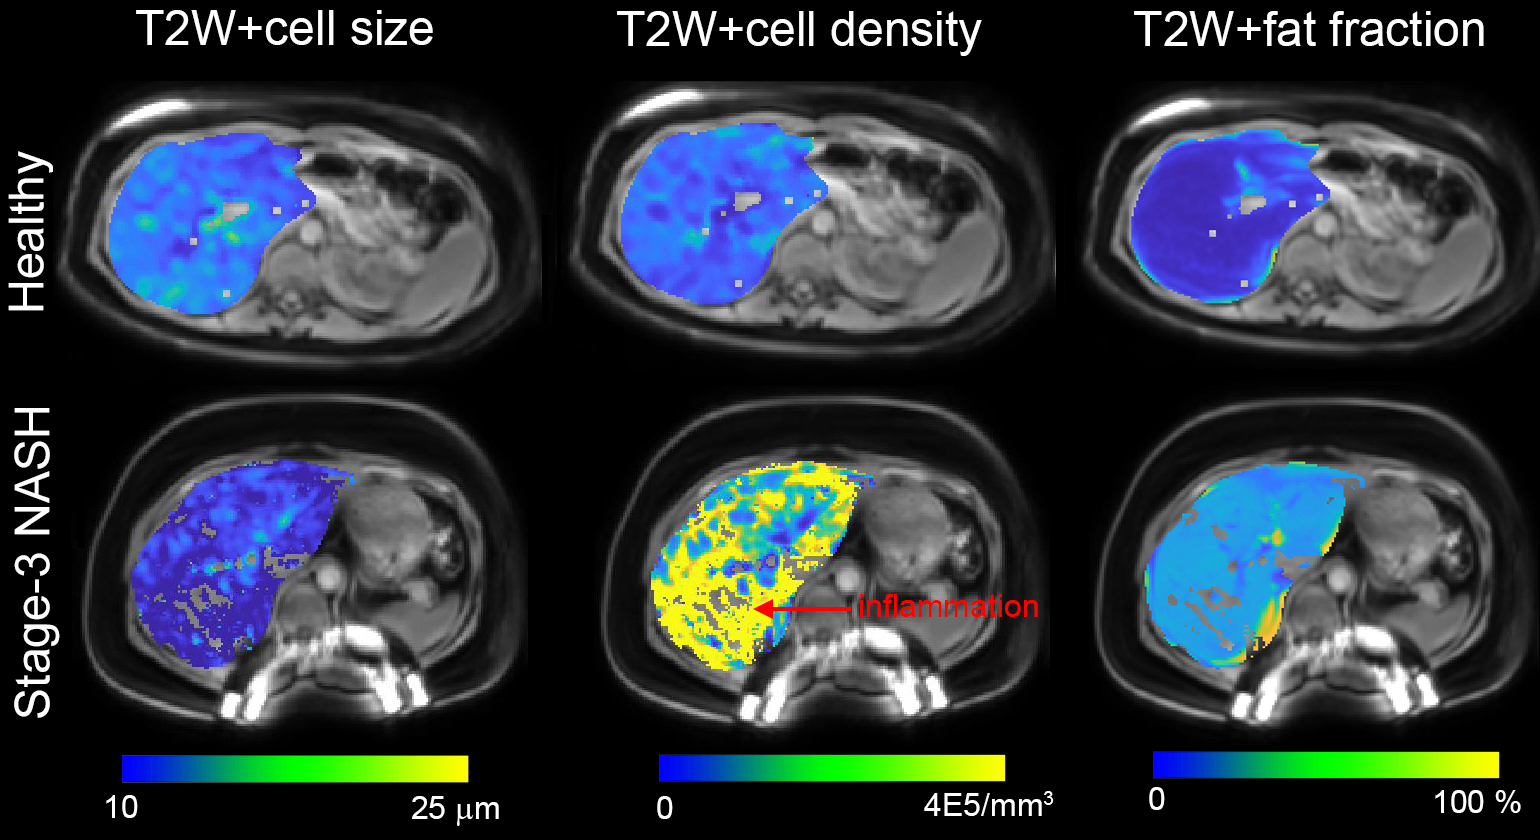
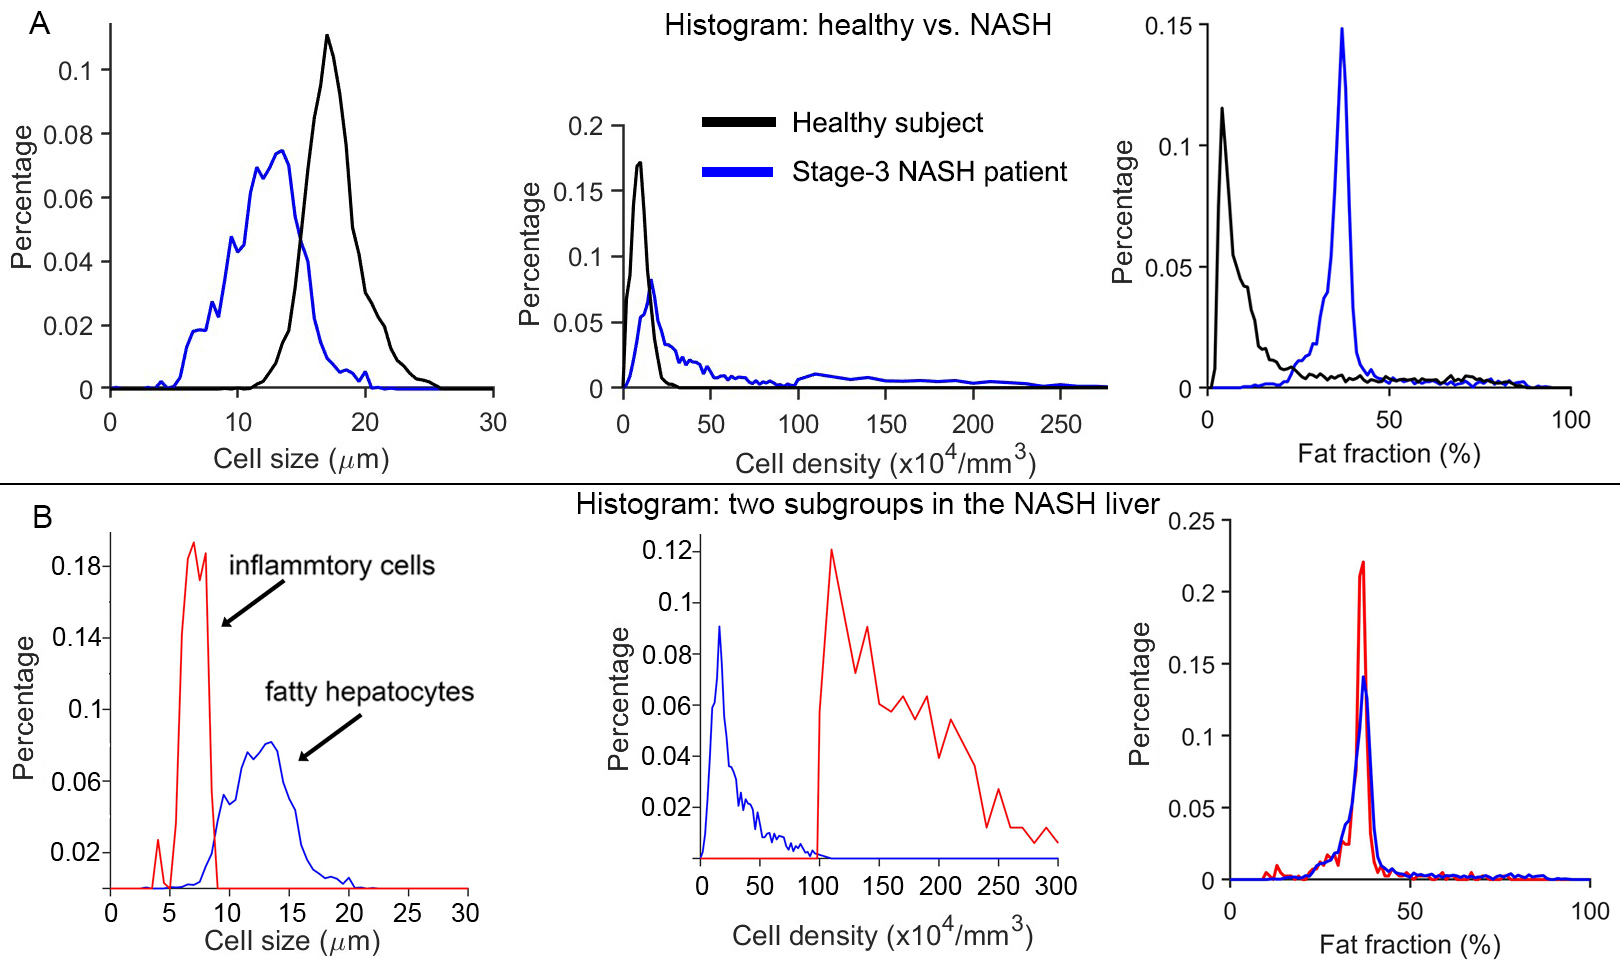
Simulation: MRI-derived average stroma cell sizes and densities significantly exceed those in steatosis and normal liver tissues at all SNR levels, with variations increasing at lower SNRs. Differences between steatosis and normal liver tissues become significant at SNR 50. In vivo human imaging: The fitted average cell size and cell density for a healthy subject were approximately 19 µm, and 15x104/mm3, respectively, which are consistent with previously reported human hepatocyte sizes and densities [6, 7]. NASH liver displays uniform high fat content, inhomogeneous high cell densities, and small cell sizes (Figure 3). The distribution of cell density of NASH liver is bimodal (Figure 4), likely representing two different groups of cells. If all voxels from the NASH liver were divided into two groups by setting a threshold for cell density at 106/mm3, cell sizes for these two groups are 12 ± 2.4 µm, and 7 ± 1.9 µm, likely associated with fatty hepatocytes and inflammatory cells, respectively. The MRI-derived cell size represents the average size of the compartment in which water molecules are restricted, so the average MRI-derived restriction size of steatosis is much smaller than the actual size of fatty cells.Conclusion
This study demonstrates that MRI cytometry can characterize changes in cell size and cell density associated with liver inflammation using clinical 3T scanners in under 12 minutes. These findings establish a strong foundation for future investigations into the role of non-invasive assessment of liver cellular characteristics in diagnosing NASH, with the ultimate goal of reducing the necessity for liver biopsy.Acknowledgements
No acknowledgement found.References
1. Kleiner, D.E., et al., Design and validation of a histological scoring system for nonalcoholic fatty liver disease. Hepatology, 2005. 41(6): p. 1313-21.
2. Adams, L.A., P. Angulo, and K.D. Lindor, Nonalcoholic fatty liver disease. CMAJ, 2005. 172(7): p. 899-905.
3. Tang, A., et al., Nonalcoholic fatty liver disease: MR imaging of liver proton density fat fraction to assess hepatic steatosis. Radiology, 2013. 267(2): p. 422-31.
4. Venkatesh, S.K., M. Yin, and R.L. Ehman, Magnetic resonance elastography of liver: technique, analysis, and clinical applications. J Magn Reson Imaging, 2013. 37(3): p. 544-55.
5. Jiang, X., et al., MR cell size imaging with temporal diffusion spectroscopy. Magn Reson Imaging, 2021. 77: p. 109-123.
6. de la Iglesia, F.A., et al., Quantitative microscopic evaluation of the endoplasmic reticulum in developing human liver. Am J Pathol, 1976. 82(1): p. 61-70.
7. Duarte, M.I., et al., Baseline volume data of human liver parenchymal cell. J Submicrosc Cytol Pathol, 1989. 21(2): p. 275-9.
Figures