0122
Sticks or no sticks? White matter microstructure in multiple sclerosis from high-b scaling1Bernard and Irene Schwartz Center for Biomedical Imaging, Department of Radiology, New York University Grossman School of Medicine, New York, NY, United States, 2Center for Advanced Imaging Innovation and Research (CAI2R), Department of Radiology, New York University Grossman School of Medicine, New York, NY, United States
Synopsis
Keywords: Microstructure, Multiple Sclerosis
Motivation: Representing axons as impermeable sticks is a cornerstone of white matter modeling, e.g. for the Standard Model and related models. However, the validity of this framework in pathology remains unknown.
Goal(s): Validate the modeling assumption of axons as impermeable sticks in multiple sclerosis white matter.
Approach: We analyze the functional form of the orientationally-averaged signal as a function of b-value up to b=10,000 s/mm2.
Results: We find that normal-appearing white matter, T1 black-holes, and T1-hypointense lesions show distinct deviations from the healthy tissue power-law b-1/2 signal scaling. Simulations reveal these deviations may be specific markers for microglia inflammation and unmyelinated leaky axons.
Impact: We assess the validity of the modeling assumption of water diffusion along impermeable axons in multiple sclerosis tissue. Pathological processes such as microglial inflammation or demyelination show different behaviors in this experimental regime, highlighting the potential for an imaging biomarker.
Introduction
The promise of increased specificity in detecting microstructural changes is a major driving force for developing biophysical models of the diffusion MRI (dMRI) signal in biological tissues1–4. The Standard Model (SM)5–10 provides an overarching framework for modeling diffusion in brain white matter (WM) with multiple Gaussian compartments. The key component underlying this framework is the assumption that diffusion inside axons is effectively one-dimensional due to their negligible diameters for clinically accessible diffusion gradients, and there is no water exchange (axon=‘impermeable stick’). This has been validated in healthy subjects,11,12 but validation in pathology is lacking. Here we probe high diffusion-weightings in brain WM of multiple sclerosis (MS) patients and assess the functional form of the diffusion signal in lesions and normal-appearing white matter (NAWM).Theory
The SM represents the dMRI signal as the spherical convolution of the fibers orientation distribution function (fODF) $$$\mathcal{P}(\hat{\mathbf{n}})$$$ and the response signal of a fiber segment $$$\mathcal{K}$$$ (kernel):$$S_{\hat{\mathbf{g}}}(b)=\int_{|\hat{\mathbf{n}}|=1}\mathrm{d}\hat{\mathbf{n}}\mathcal{P}(\hat{\mathbf{n}})\mathcal{K}(b,\hat{\mathbf{g}}\cdot\hat{\mathbf{n}}),\quad\mathcal{K}(b,\xi)=S_0\left[f\,e^{-b\,D_a\xi^2}+(1-f)\,e^{-b\,D_e^{\perp}-b\left(D_e^{\|}-D_e^{\perp}\right)\xi^2}\right],\quad(1)$$
where $$$f$$$ is the stick T2-weighted water fraction and $$$D_\mathrm{a}$$$ the axial diffusivity inside sticks, and $$$D_\mathrm{e}^\|,\,D_\mathrm{e}^\perp$$$ the axial and perpendicular extra-axonal diffusivities
At high b-values the spherical mean of Eq.(1) becomes11,12
$$\overline{S(b)}\simeq{f}\sqrt{\frac{\pi}{4}}\frac{1}{\sqrt{b\,D_{\mathrm{a}}}}=\beta\,b^{-\alpha}\quad\beta=f\sqrt{\frac{\pi}{4D_{\mathrm{a}}}},\quad\alpha=\frac{1}{2},\quad(2)$$
Note that Eq.(2) does not depend on extra-axonal diffusion properties (nor the presence of an additional free water compartment) because at high enough b-value these contributions become exponentially suppressed due to nonzero diffusion in all directions. Such scaling ($$$\alpha$$$) is unaffected by biological variability (unlike $$$\beta$$$) and is a key signature of impermeable sticks, since for large b-values the spherically-averaged signal does not get exponentially suppressed11, irrespective of its fODF.
For permeable sticks, the high-b scaling acquires corrections in inverse powers of $$$b$$$:13–15
$$\overline{S(b)}\sim{f}\sqrt{\frac{\pi}{4\,b\,D_\mathrm{a}}}\,e^{-t\,r_\mathrm{a}}\left(1+t\,r_\mathrm{a}\frac{2+t\,r_e}{b\,D_e}+\ldots\right).\quad(3)$$
The factor accompanying $$$b^{-1/2}$$$ simply rescales $$$\beta$$$ in Eq.(2), but higher order powers $$$b^{-3/2},\,b^{-5/2},\,...$$$ appear. The exchange rates $$$f\,r_\mathrm{a}=(1-f)\,r_\mathrm{e}$$$ between sticks and extra-stick space, and extra-stick isotropic diffusivity ($$$D_\mathrm{e}$$$) accompany $$$b^{-3/2}$$$ correction. Note that for a finite high-b range, fitting Eq.(2) to measurements generated with Eq.(3) would yield $$$\alpha$$$ values between $$$\tfrac12$$$ and $$$\tfrac32$$$ depending on the specific microstructural parameters such as exchange rate.
Alternatively, consider the high-b scaling for spheres of radius $$$R$$$ (cell-bodies in extra-axonal space). Following Neuman results for wide pulses16, the signal decay becomes:
$$\mathrm{ln}\,S\simeq-b\,D_\mathrm{sph},\quad{D}_\mathrm{sph}=\tfrac{16}{175}\,g^2\,\delta\,{R}^4/D_0.\quad(4)$$
Interestingly, as function of $$$b^{-1/2}$$$, this is convex for $$$(b\,D_\mathrm{sph})^{-1/2}<\sqrt{2/3}$$$ and concave for $$$(b\,D_\mathrm{sph})^{-1/2}>\sqrt{2/3}$$$. Thus, observing a concave dependence on $$$b^{-1/2}$$$, i.e. estimating $$$\alpha<0.5$$$, implies the presence of cell-bodies with an upper bound for their radius:
$$R<\left(\frac{\frac{3}{2}\left(D_0\delta(\Delta-\delta/3)\right)}{\frac{16}{175}b_{\max}}\right)^{1/4}.\quad(5)$$
Methods
After providing informed consent, one healthy volunteer (30 y.o. female) and three MS patients female volunteers (30-63 y.o. females) underwent MRI in a whole-body 3T-system (Siemens Prisma) using a 32-channel head coil. Multi-shell dMRI data was acquired at: (b[ms/μm2],Ndirs)={(1,24),(2,36),(5,60),(6,60),(7,60),(8,60),(9,60),(10,60)} using spherical designs17. Diffusion MRI parameters: voxel-size=2x2x2mm3,TR= 4.8s,TE=109ms,bandwidth=2272Hz/Px,Rgrappa=2,pF=6/8,multiband=2. T1-MPRAGE and FLAIR images were acquired with 1mm isotropic resolution. Total scan time was 49 minutes. The complex-valued dMRI data was denoised with MPPCA18,19, corrected for Gibbs artifacts20, and for eddy current distortions and subject motion21 simultaneously using the DESIGNER pipeline22. T1 black-holes and T1 hypointense MS lesions were segmented by an expert neuroradiologist using MPRAGE and FLAIR images.Results
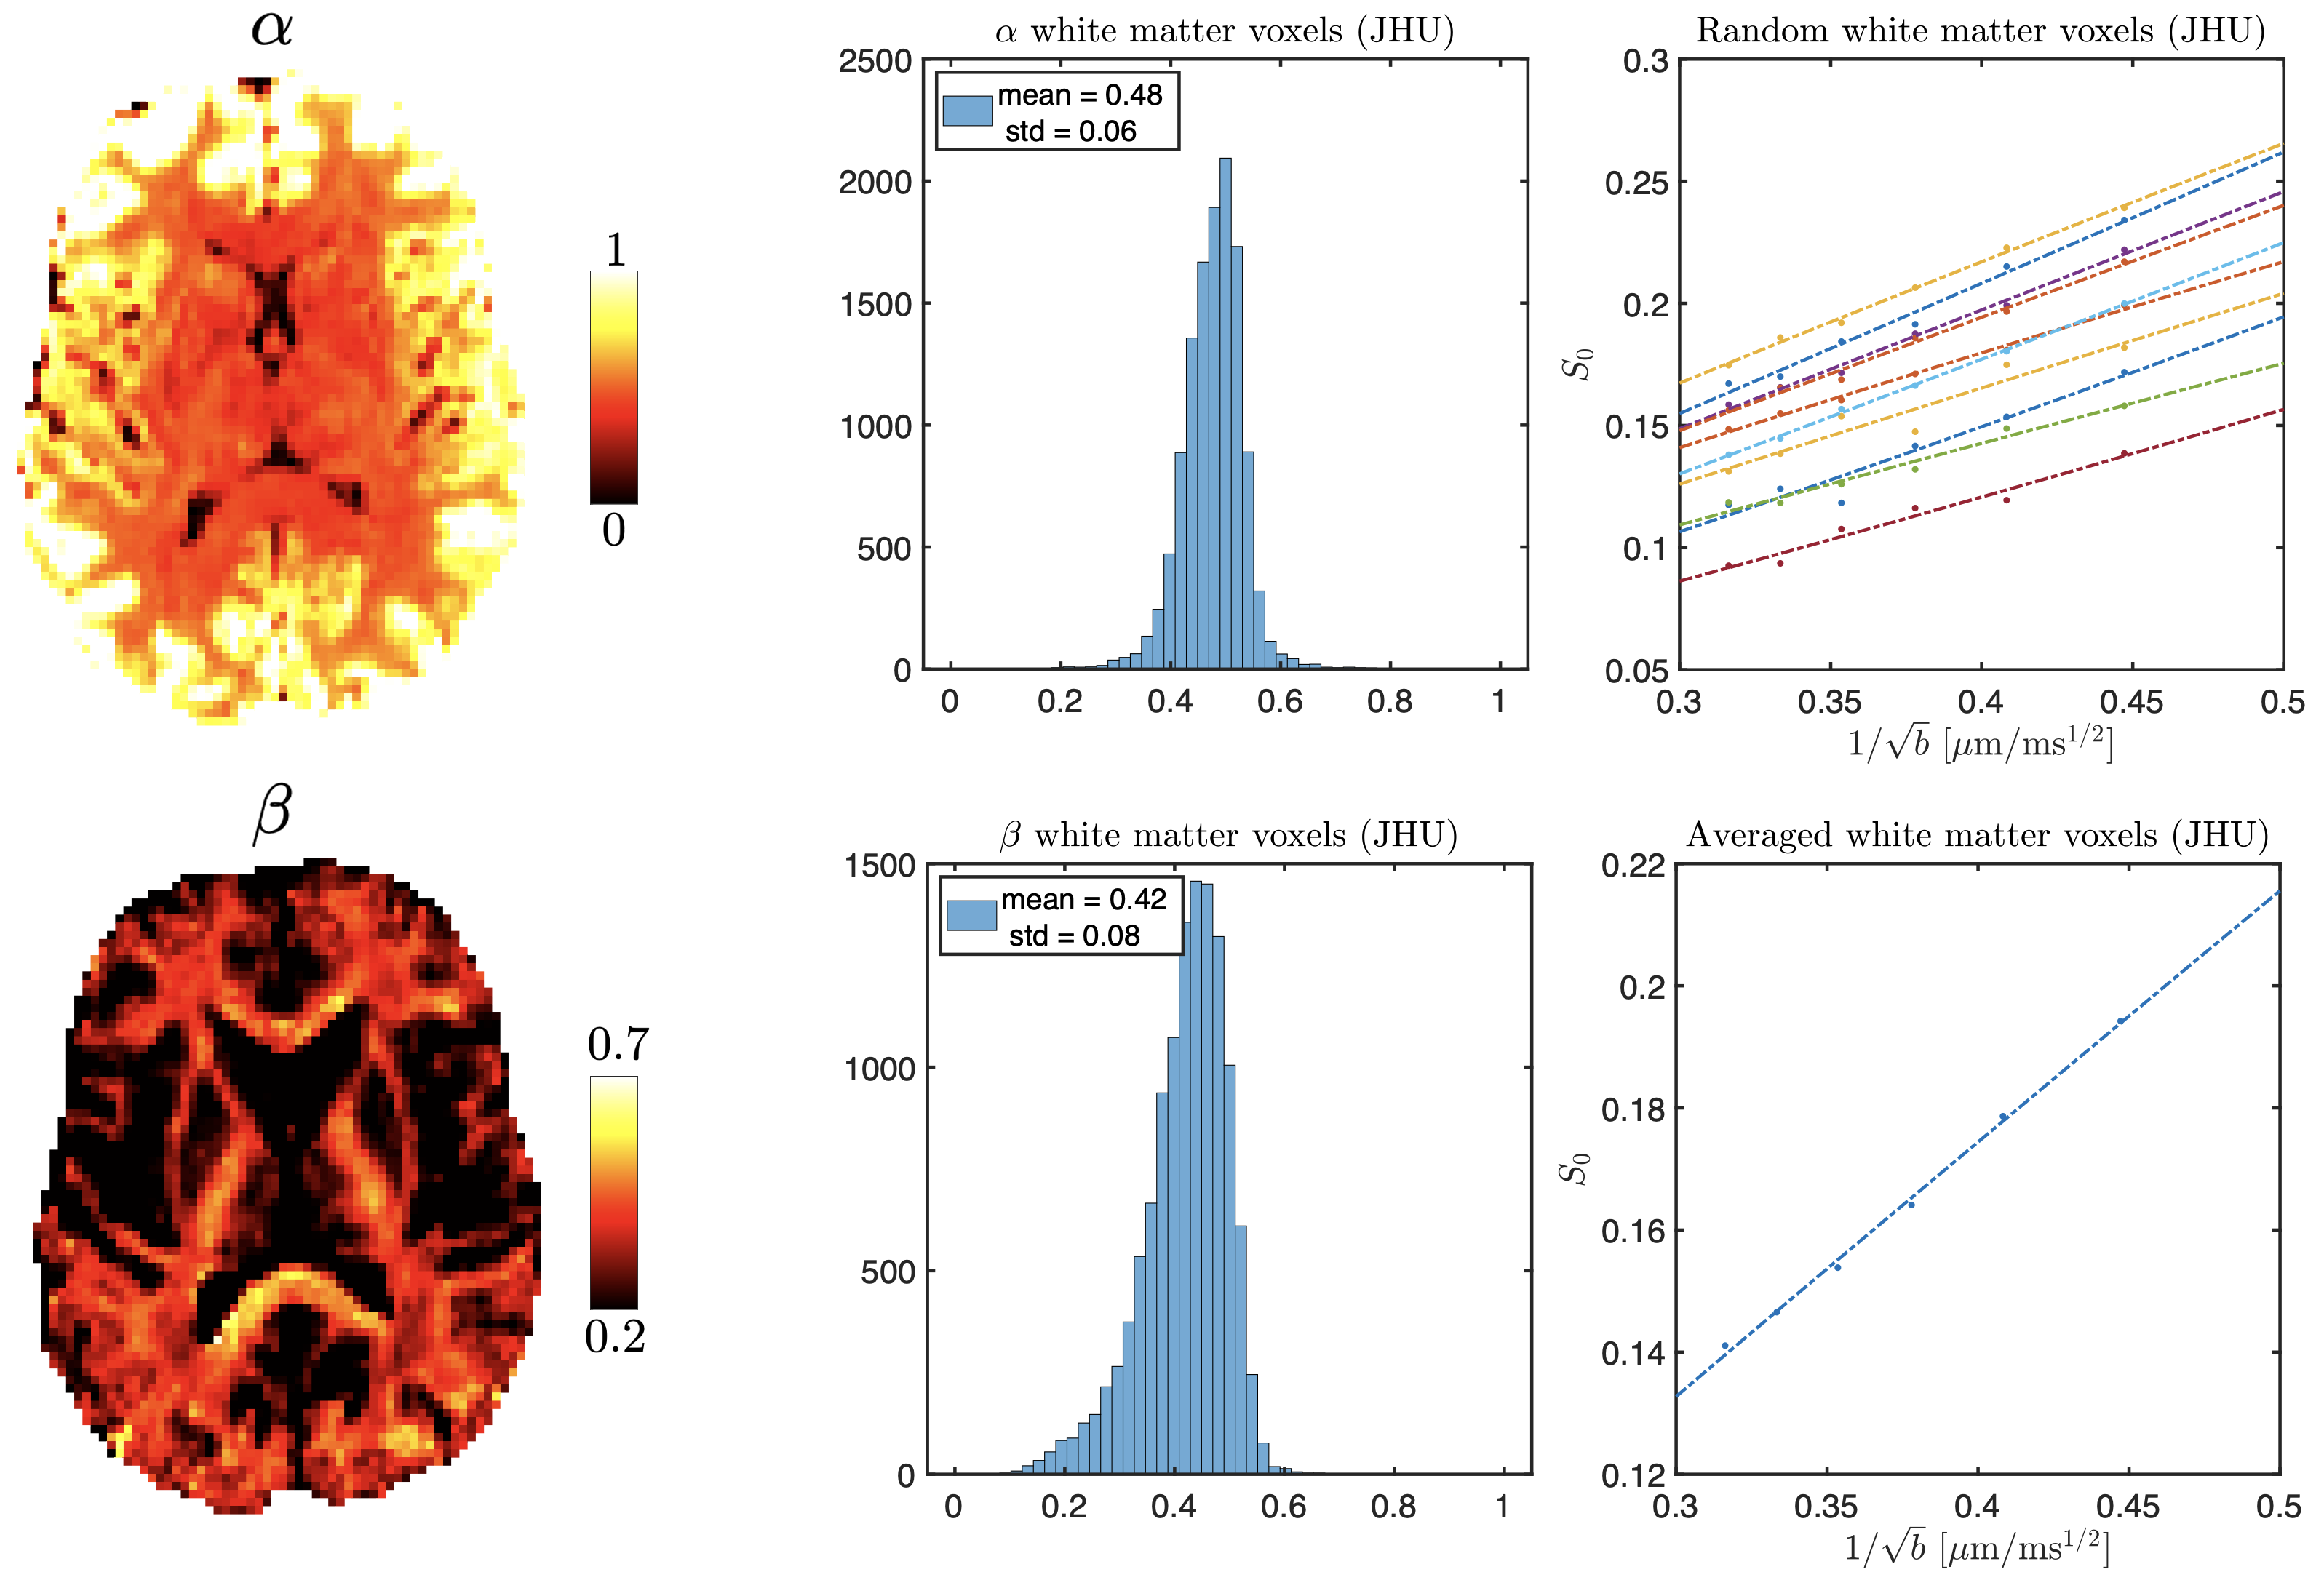
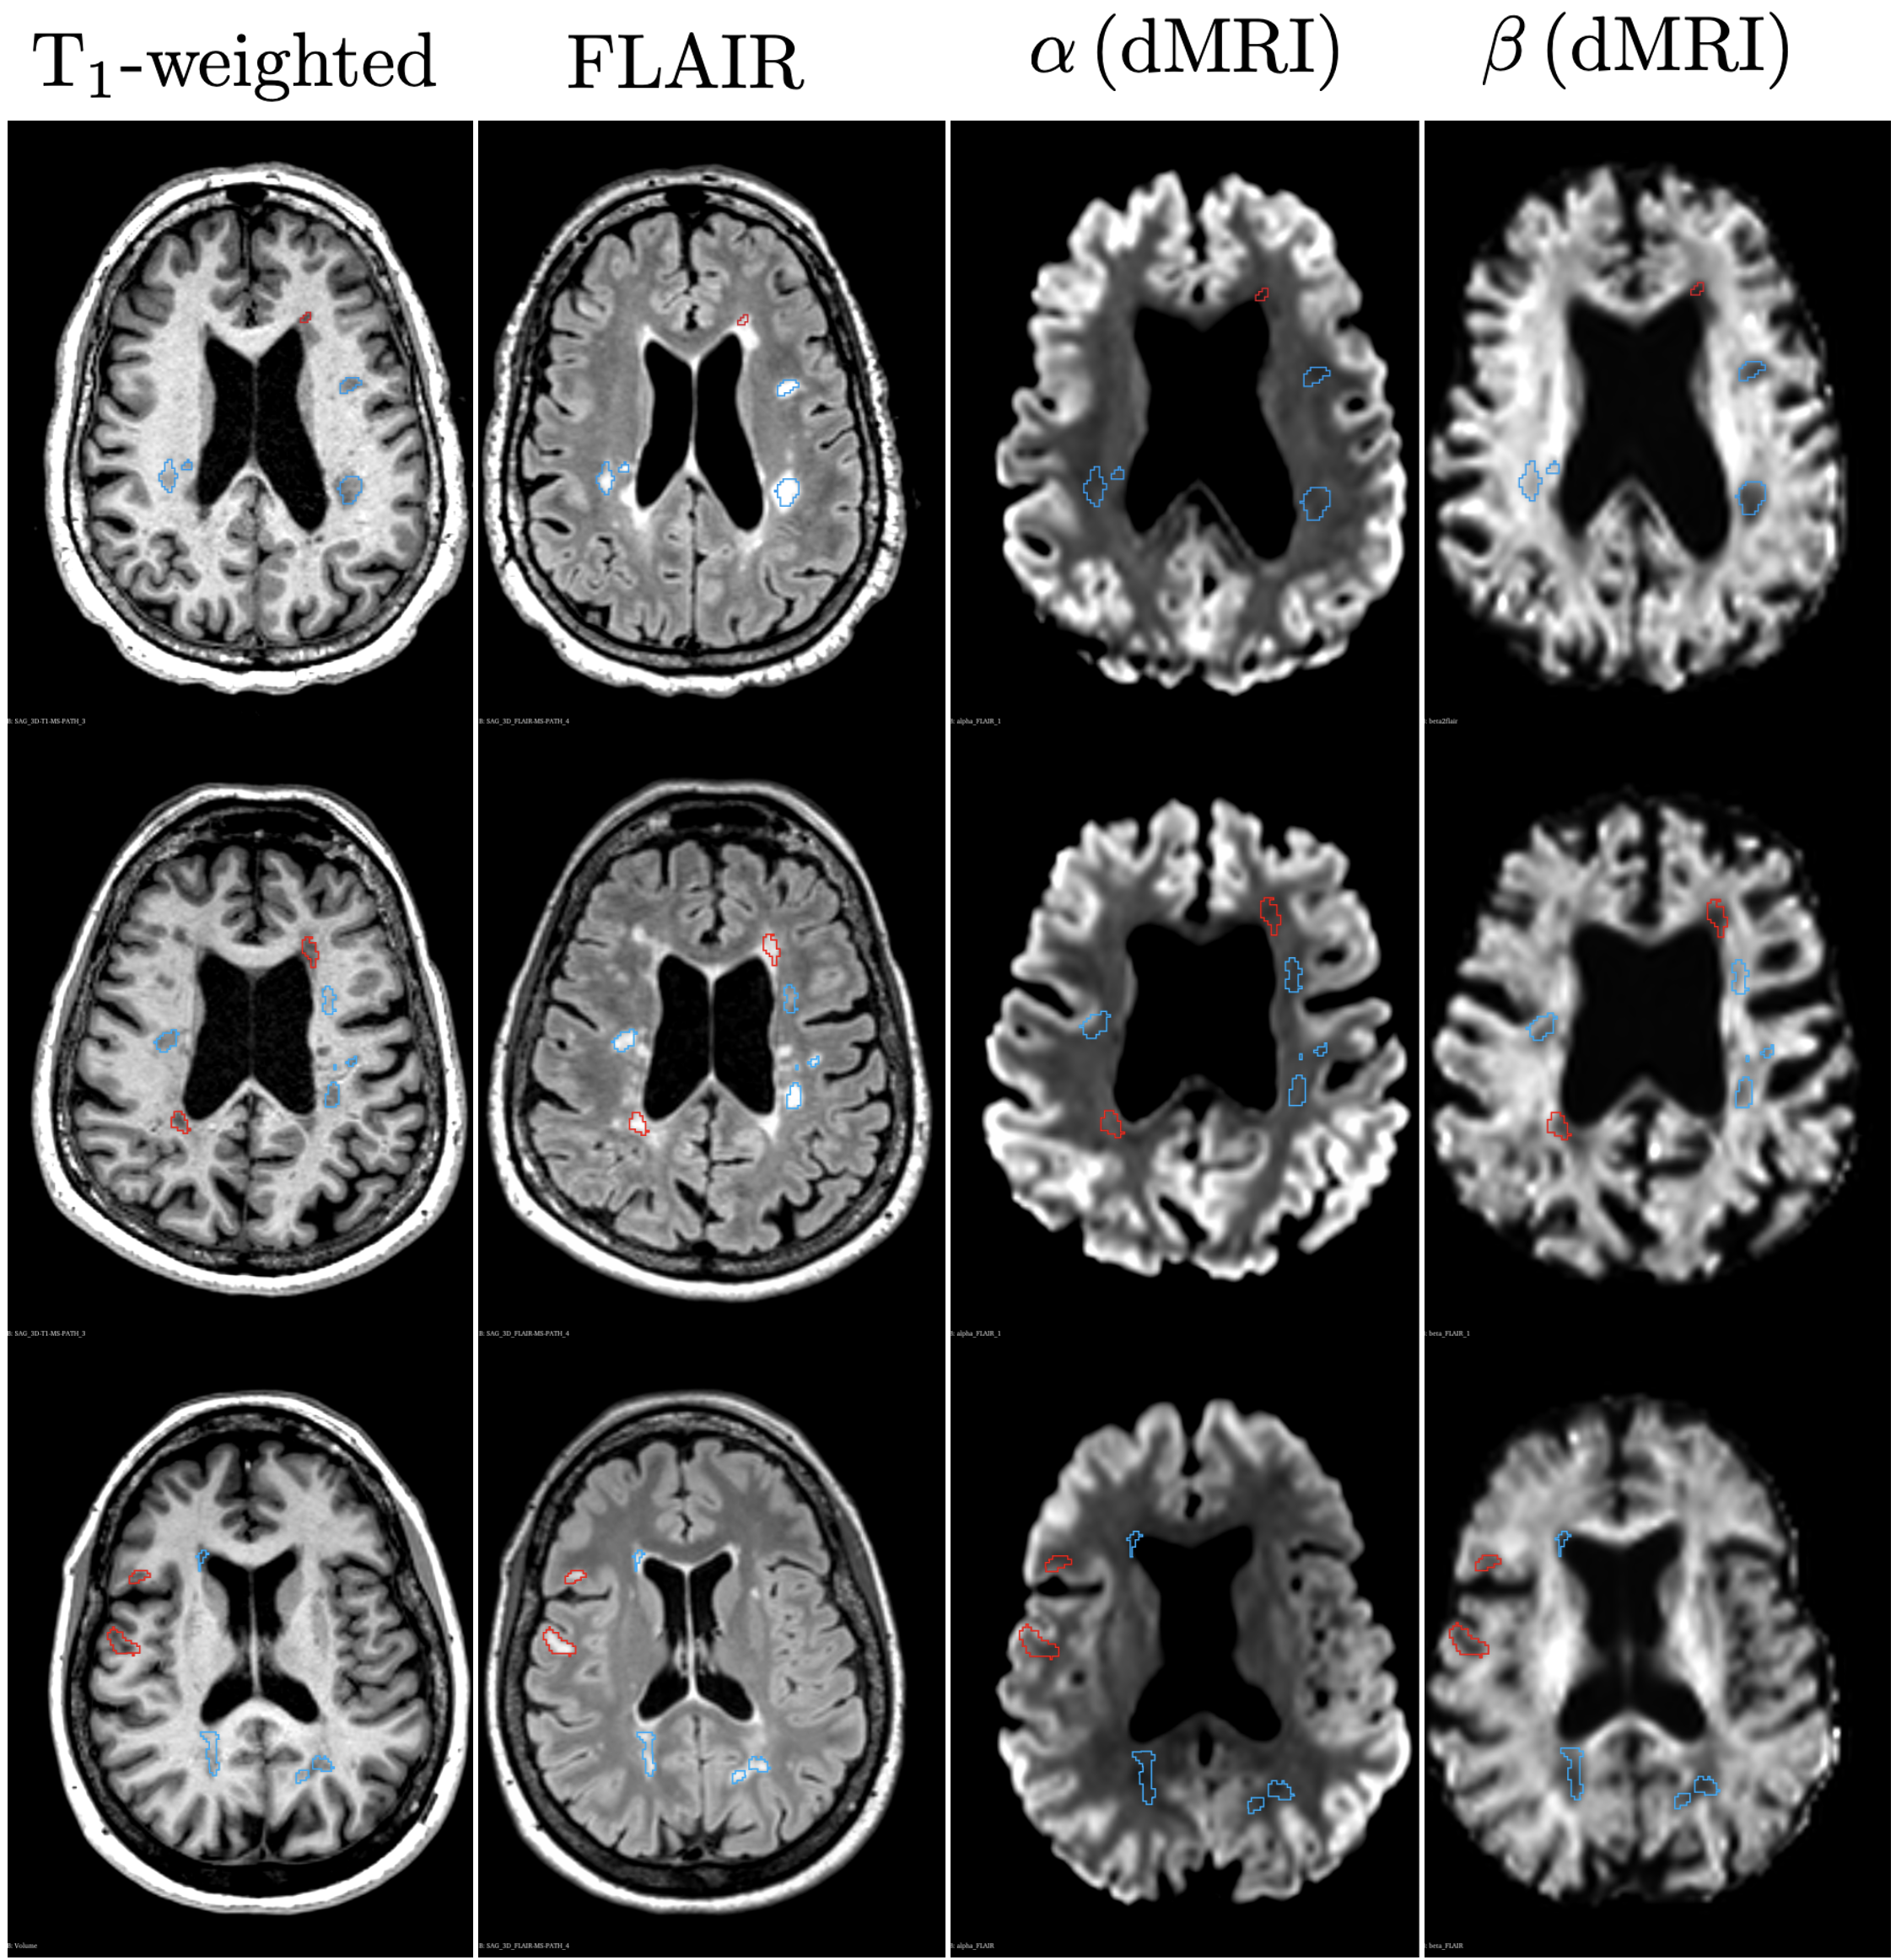
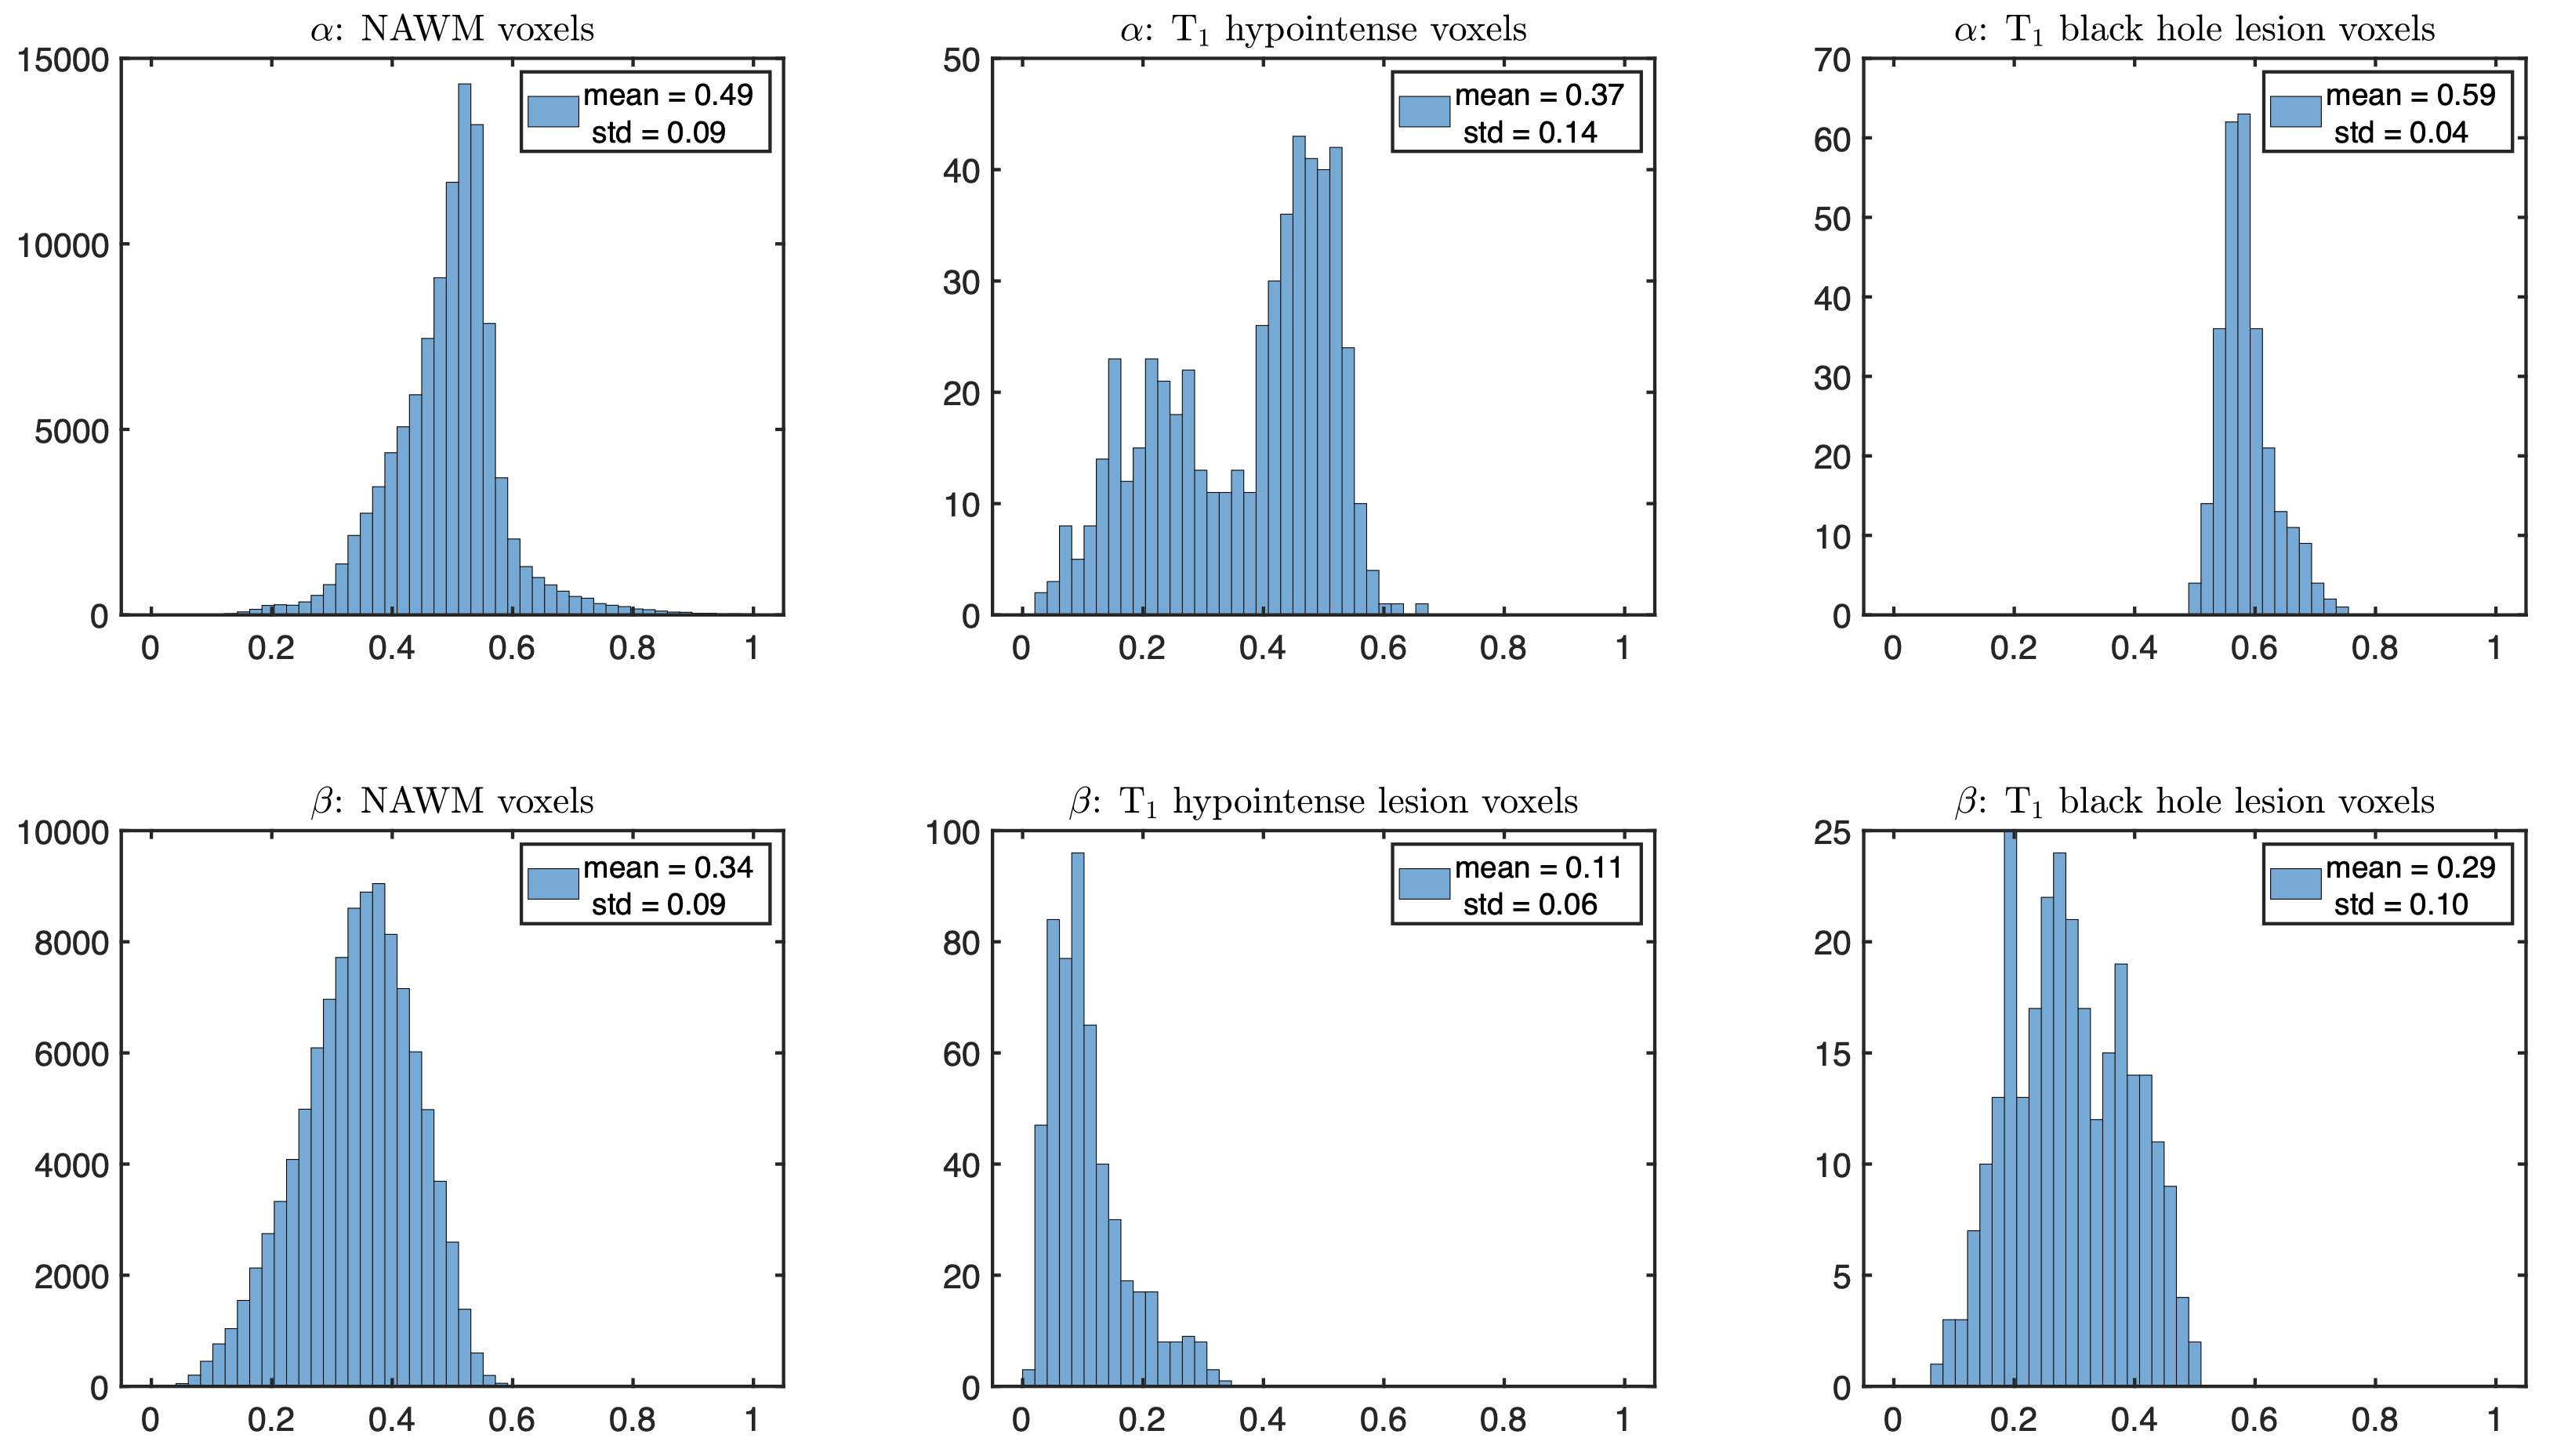
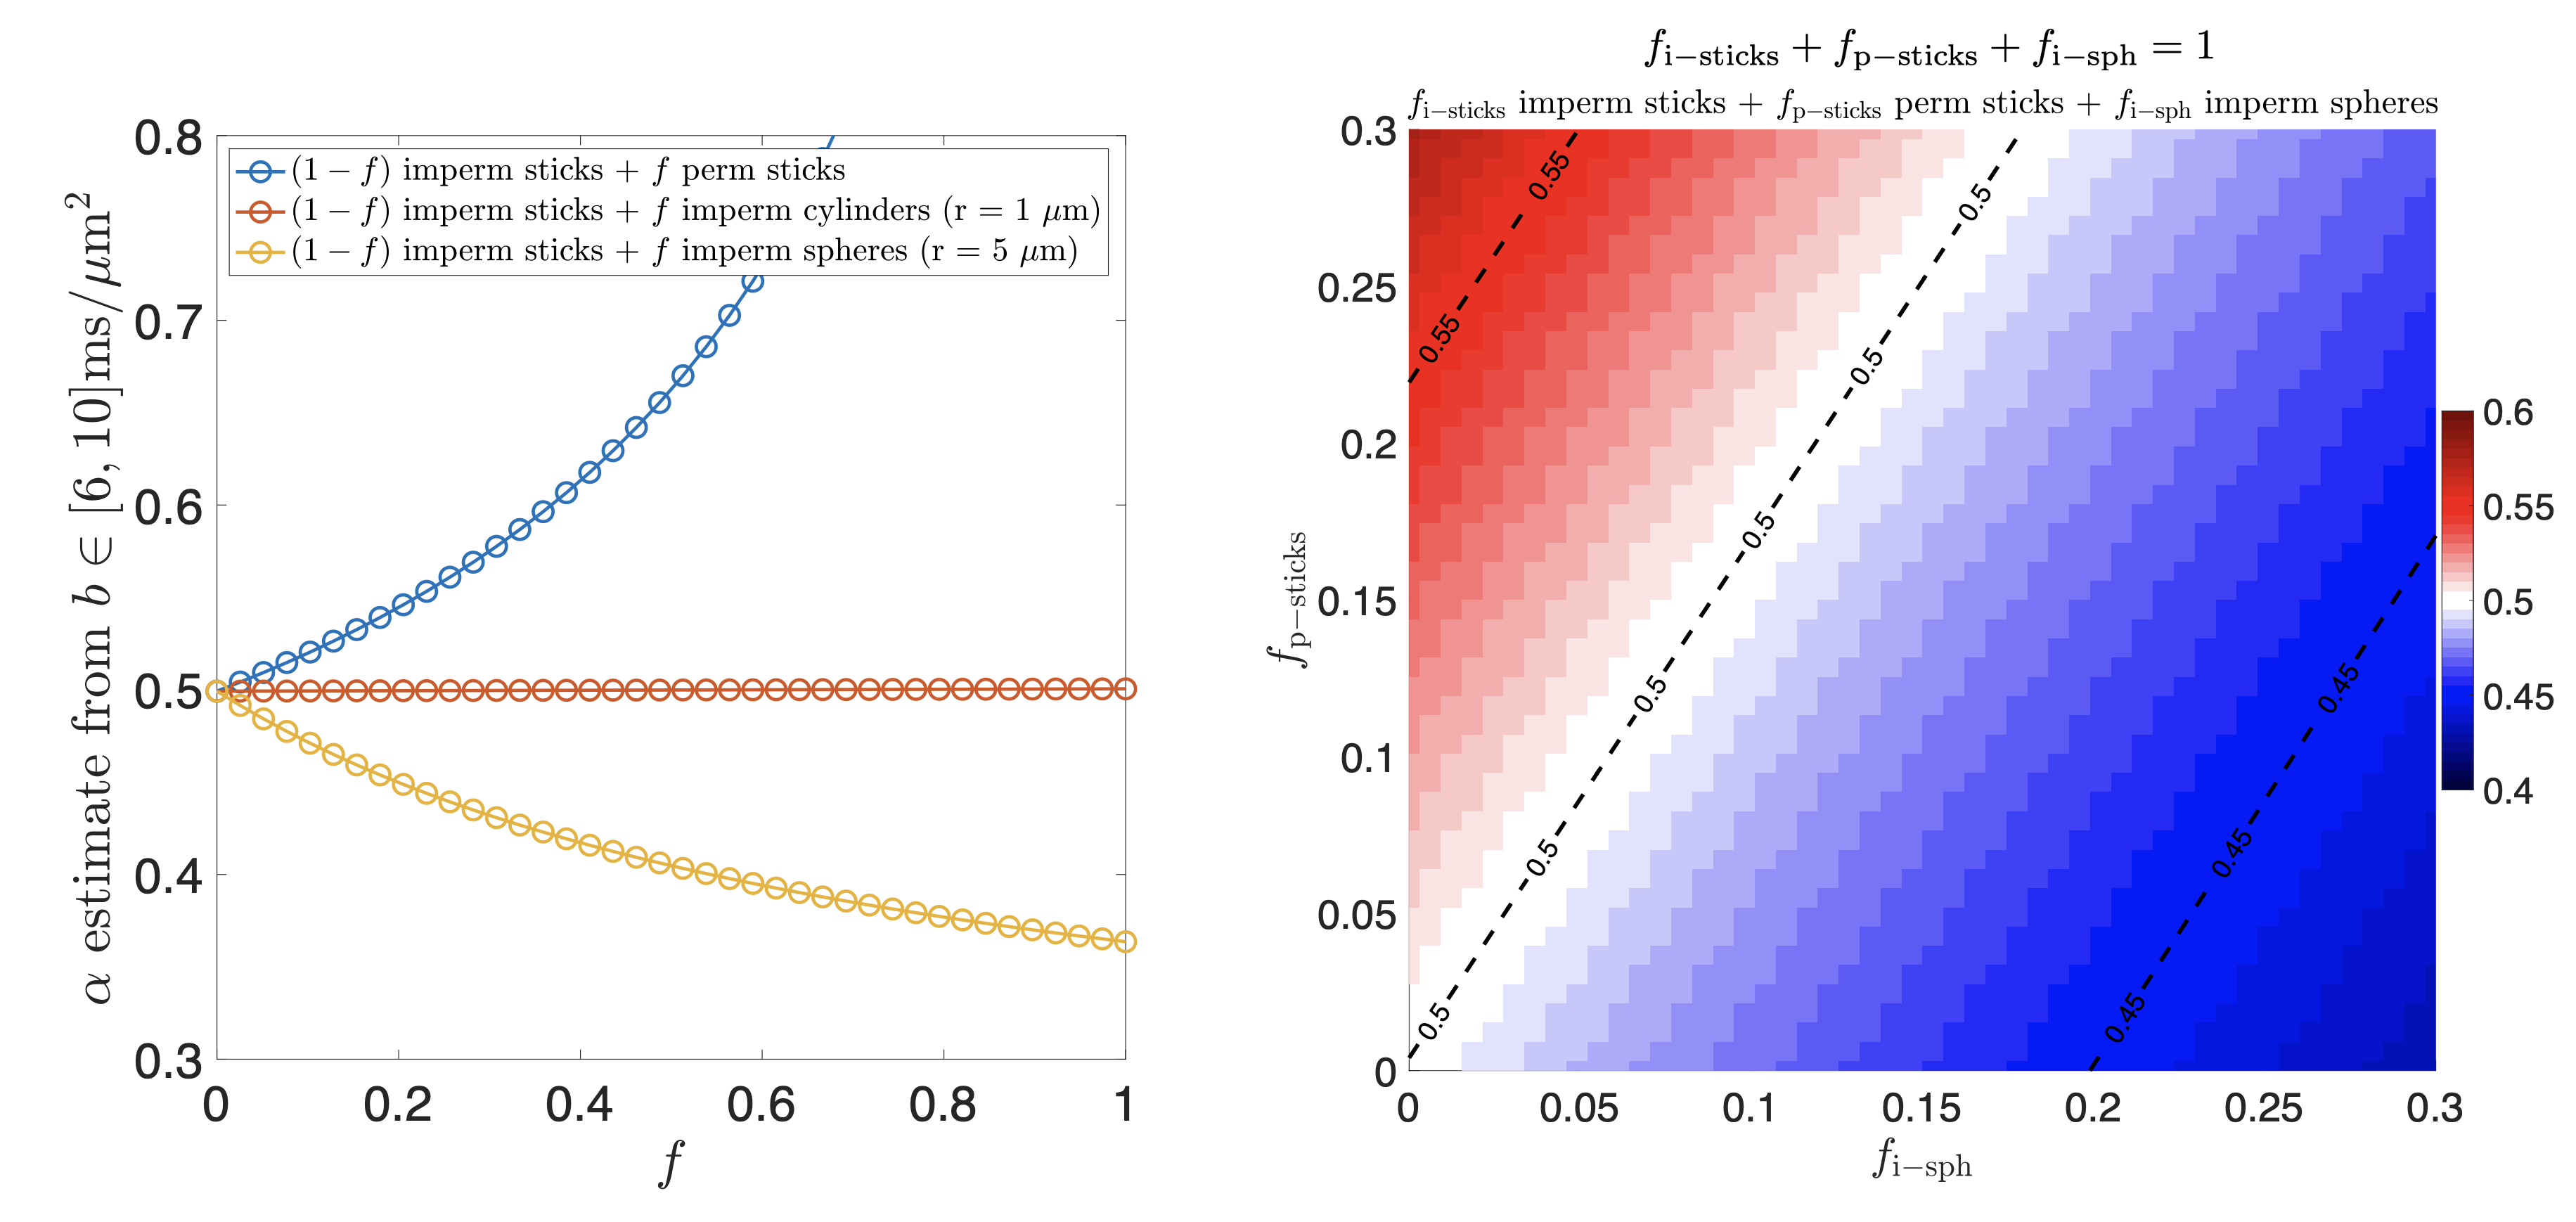
Figure 1 shows a power-law with $$$\alpha$$$ centered around 0.5 across healthy WM, reproducing previous work11,12. Figure 2 shows anatomical MRI with segmented lesions together with $$$\alpha$$$ and $$$\beta$$$ maps from dMRI, revealing heterogeneity of MS lesions demonstrating either reduced or increased $$$\alpha$$$ values in T1 black-holes or T1-hypointense MS lesions, respectively. Figure 3 shows corresponding histograms, displaying $$$\alpha\sim0.5$$$ for NAWM, $$$\alpha<0.5$$$ in T1 hypointense and $$$\alpha>0.5$$$ in T1 black holes.Simulations confirmed that our dMRI protocol is insensitive to axon diameters, but also that deviations in the expected value of $$$\alpha=0.5$$$ of healthy tissue can be recreated synthetically, see Figure 4. Adding a small fraction of permeable sticks (mimicking unmyelinated “leaky” axons) or an impermeable spherical compartment (mimicking reactive microglia from neuroinflammation) is enough to make the observable $$$\alpha$$$ with our protocol deviate from 0.5. We obtained an upper bound for the radius (Eq.(5)) of the spherical compartment detected in the lesions with $$$\alpha<0.5$$$ of around 7μm.
Discussion and Conclusion
We assessed the validity of the stick assumption for diffusion in white matter MS. Similarly to controls, NAWM in MS follows a power-law $$$\alpha\sim0.5$$$ consistent with a stick compartment. Conversely, MS lesions exhibit heterogeneous behavior, reflected in increases and decreases in the power-law scaling at high diffusion weightings. Power-law exponents indicate the potential presence of specific pathological processes such as microglial inflammation $$$(\alpha<0.5)$$$ or demyelination $$$(\alpha>0.5)$$$. These initial results will direct further modeling in diseased tissue and may also indicate the potential of exponent $$$\alpha$$$ as an imaging biomarker.Acknowledgements
This work has been supported by NIH under NINDS awards R01 NS088040, NIBIB award R01 EB027075, and was performed under the rubric of the Center for Advanced Imaging Innovation and Research (CAI2R, www.cai2r.net), an NIBIB National Center for Biomedical Imaging and Bioengineering (NIH P41 EB017183). The authors are grateful to Jelle Veraart for fruitful discussions.References
1. Kiselev, V. G. Fundamentals of diffusion MRI physics. NMR Biomed. 30, 1–18 (2017).
2. Novikov, D. S., Kiselev, V. G. & Jespersen, S. N. On modeling. Magn. Reson. Med. 79, 3172–3193 (2018).
3. Alexander, D. C., Dyrby, T. B., Nilsson, M. & Zhang, H. Imaging brain microstructure with diffusion MRI: practicality and applications. NMR Biomed. 32, e3841 (2019).
4. Weiskopf, N., Edwards, L. J., Helms, G., Mohammadi, S. & Kirilina, E. Quantitative magnetic resonance imaging of brain anatomy and in vivo histology. Nat. Rev. Phys. 3, 570–588 (2021).
5. Novikov, D. S., Fieremans, E., Jespersen, S. N. & Kiselev, V. G. Quantifying brain microstructure with diffusion MRI: Theory and parameter estimation. NMR Biomed. e3998 (2019).
6. Jespersen, S. N., Kroenke, C. D., Østergaard, L., Ackerman, J. J. H. & Yablonskiy, D. A. Modeling dendrite density from magnetic resonance diffusion measurements. NeuroImage 34, 1473–1486 (2007).
7. Fieremans, E., Jensen, J. H. & Helpern, J. A. White matter characterization with diffusional kurtosis imaging. NeuroImage 58, 177–188 (2011).
8. Zhang, H., Schneider, T., Wheeler-Kingshott, C. A. & Alexander, D. C. NODDI: Practical in vivo neurite orientation dispersion and density imaging of the human brain. NeuroImage 61, 1000–1016 (2012).
9. Assaf, Y. & Basser, P. J. Composite hindered and restricted model of diffusion (CHARMED) MR imaging of the human brain. NeuroImage 27, 48–58 (2005).
10. Alexander, D. C. et al. Orientationally invariant indices of axon diameter and density from diffusion MRI. NeuroImage 52, 1374–1389 (2010).
11. Veraart, J., Fieremans, E. & Novikov, D. S. On the scaling behavior of water diffusion in human brain white matter. NeuroImage 185, 379–387 (2019).
12. McKinnon, E. T., Jensen, J. H., Glenn, G. R. & Helpern, J. A. Dependence on b-value of the direction-averaged diffusion-weighted imaging signal in brain. Magn. Reson. Imaging 36, 121–127 (2017).
13. Veraart, J. et al. Noninvasive quantification of axon radii using diffusion MRI. eLife 9, e49855 (2020).
14. Olesen, J. L., Østergaard, L., Shemesh, N. & Jespersen, S. N. Diffusion time dependence, power-law scaling, and exchange in gray matter. NeuroImage 251, 118976 (2022).
15. Jelescu, I. O., Skowronski, A. de, Geffroy, F., Palombo, M. & Novikov, D. S. Neurite Exchange Imaging (NEXI): A minimal model of diffusion in gray matter with inter-compartment water exchange. NeuroImage 256, 119277 (2022).
16. Neuman, C. H. Spin echo of spins diffusing in a bounded medium. J. Chem. Phys. 60, 4508–4511 (1974).
17. Seymour, P. D. & Zaslavsky, T. Averaging sets: A generalization of mean values and spherical designs. Adv. Math. 52, 213–240 (1984).
18. Veraart, J. et al. Denoising of diffusion MRI using random matrix theory. NeuroImage 142, 394–406 (2016).
19. Lemberskiy, G. et al. Achieving sub-mm clinical diffusion MRI resolution by removing noise during reconstruction using random matrix theory. Proc. 27th Sci. Meet. 0770 Int. Soc. Magn. Reson. Med. Montr. Can. 2019 (2019).
20. Lee, H.-H., Novikov, D. S. & Fieremans, E. Removal of partial Fourier-induced Gibbs (RPG) ringing artifacts in MRI. Magn. Reson. Med. 86, 2733–2750 (2021).
21. Andersson, J. L. R. & Sotiropoulos, S. N. An integrated approach to correction for off-resonance effects and subject movement in diffusion MR imaging. NeuroImage 125, 1063–1078 (2016).
22. Ades-Aron, B. et al. Evaluation of the accuracy and precision of the diffusion parameter EStImation with Gibbs and NoisE removal pipeline. NeuroImage 183, 532–543 (2018).
Figures