0120
Brain microstructure charts in controls and multiple sclerosis patients using clinical diffusion MRI1New York University Grossman School of Medicine, New York, NY, United States, 2University of Hawai’i at Manoa, Honolulu, HI, United States
Synopsis
Keywords: DWI/DTI/DKI, White Matter
Motivation: Currently, brain charts index gray matter brain volume from T1-weighted MRI, whose sensitivity is limited to millimeter resolution, thereby unable to probe early signs of aging and pathology at the cellular level.
Goal(s): To introduce normative data for diffusion MRI (dMRI) and apply it to multiple sclerosis (MS) patients to evaluate sensitivity and accuracy.
Approach: We created normative data using diffusion tensor, diffusion kurtosis, and standard model imaging metrics in white matter. Then, assessed MS subjects by comparing to these normative data.
Results: dMRI metrics from MS patients deviate from normative data, suggesting brain charts may be used to benchmark brain health.
Impact: This study is the first step to achieve a brain-age framework from clinically feasible dMRI scans that provides meaningful insight into microstructural processes underlying brain aging and disease– possibly enabling quantitative assessment of treatment response to future disease-modifying therapies.
Introduction
Brain charts across the lifespan have been proposed for tracking brain aging and detecting disease1–4, and are currently, created using structural MRI of gray matter1,5. Diffusion MRI (dMRI), on the other hand, provides quantitative biomarkers of white matter (WM) microstructure that hold promise of earlier detection of pathology.Using a large dMRI dataset acquired in clinical settings, we created microstructure brain charts from controls and compared them against MS patients. Our quantitative imaging markers are:
- Diffusion tensor imaging6 (DTI): MD–mean diffusivity, RD–radial diffusivity, AD–axial diffusivity, FA–fractional anisotropy,
- Diffusion kurtosis imaging7 (DKI): MK–mean kurtosis, RK–radial kurtosis, AK–axial kurtosis,
- Standard model imaging8-10 (SMI): $$$p_2$$$–fiber orientation anisotropy, $$$f$$$–axonal water fraction, $$$D_a$$$–intra-axonal diffusivity, $$$D_e^∥$$$–extra-axonal diffusivity (axial), $$$D_e^⟂$$$–extra-axonal diffusivity (radial).
Methods
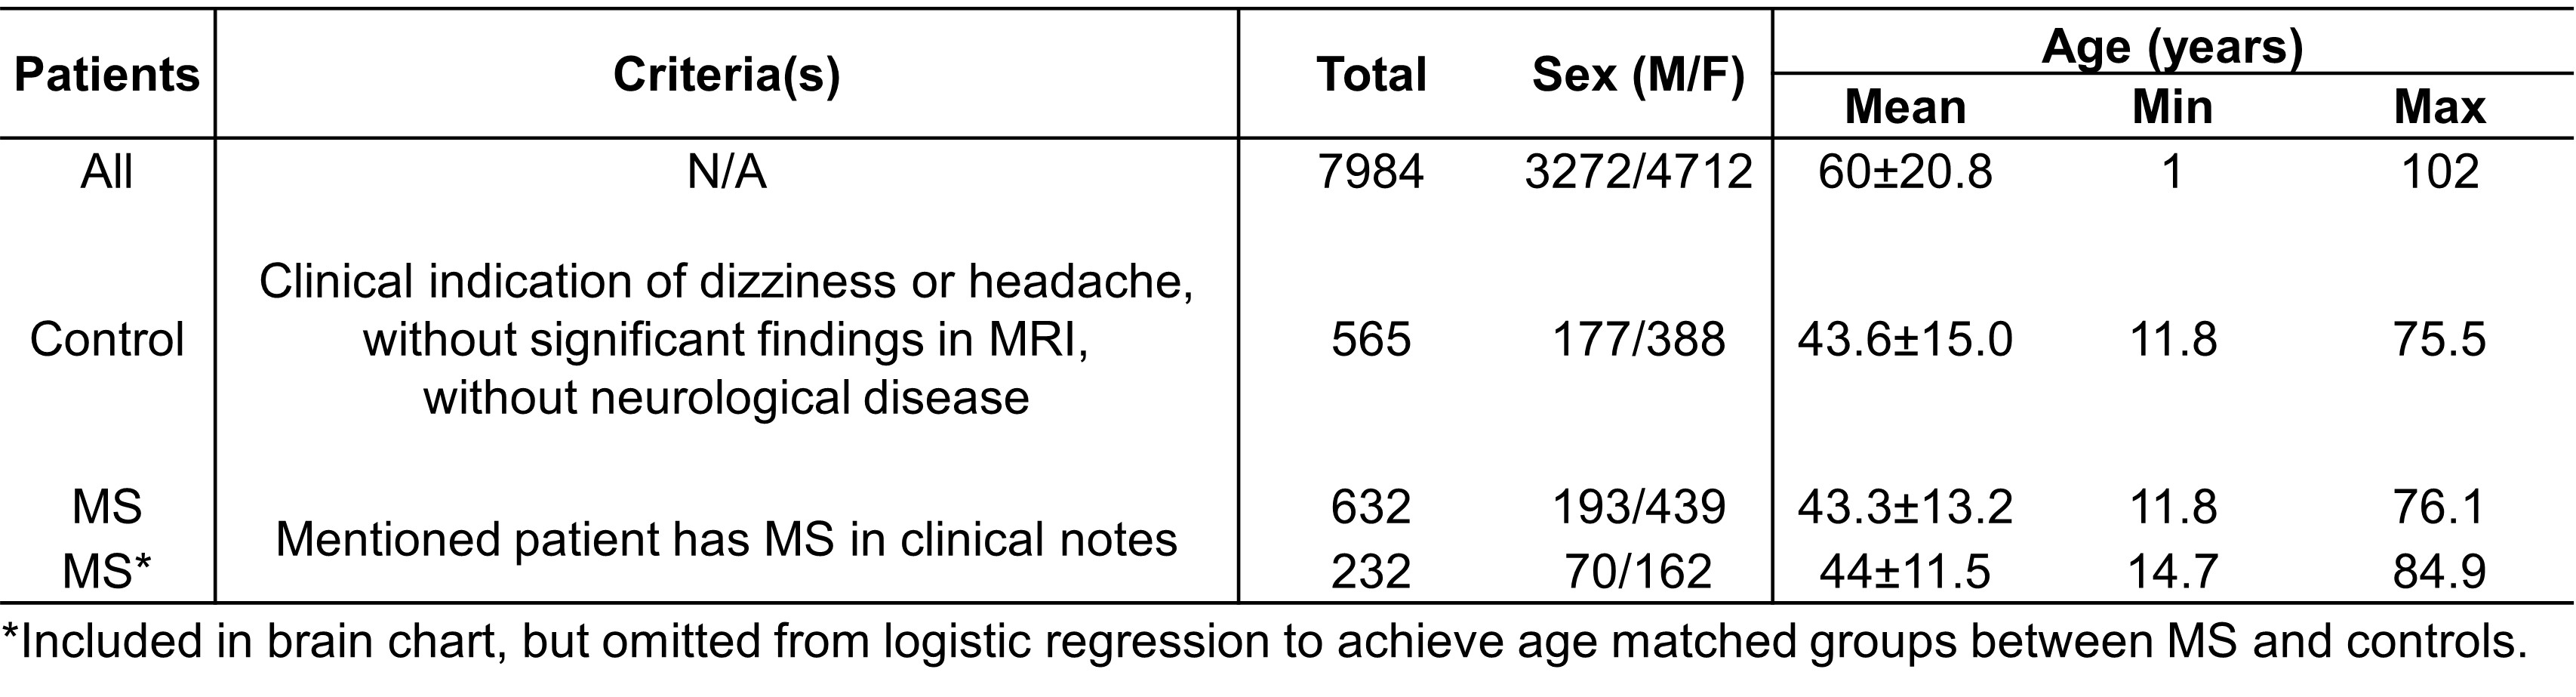
Clinical data: This retrospective study included age and sex-matched control (N=565, 177M/388F, 43.6±15.0 year-old) and MS patients (N=632, 193M/439F, 43.3±13.2 year-old) from a cohort of 7984 subjects who presented for clinical brain MRI in an outpatient imaging center. Table 1 lists demographics and inclusion/exclusion criteria. dMRI was acquired on Siemens Magnetom Prisma 3T (47.2%) and Skyra 3T (52.8%) using 20-channel head coil including 4-5 b=0 images, b=250 s/mm2 – 4 directions, b=1000 s/mm2 – 20 directions, b=2000 s/mm2 – 60 directions, and additional b=0 image with reverse phase-encoding direction for distortion correction11. Other imaging parameters were: TE=70-100ms, TR=3.5-5.0s, 50 slices, resolution = 1.7x1.7x3mm3, 6/8 partial Fourier, acceleration factor 4 (iPat 2, SMS 2).Image processing: dMRI datasets were preprocessed using the DESIGNER pipeline12,13 and DTI/DKI14 and SMI9 maps were derived. JHU WM atlas labels15 were warped to each patient’s FA map using FSL FNIRT16. 5% of lowest FA values were clipped from each ROI in atlas space to minimize partial volume effect. ROI mean values from 25 WM ROIs (left-right merged) and global WM (merge all WM ROIs) were extracted from individual maps.
Brain charts: Multinomial logistic regression (age, sex, a ROI-dMRI metric as predictors)17was used to find ROIs and dMRI metrics that best classify MS from controls. Using age- and sex-matched groups for controls and MS (Table 1), ROI-DTI/DKI and ROI-SMI predictors with the highest area under the ROC Curve (AUC) along with whole WM were selected then plotted against age for the controls to map normative brain charts with quadratic b-spline fit and percentile regions. The same ROI-dMRI metrics were plotted for MS patients to analyze MS pathology in relation to the normal brain aging trajectory. An additional 232 MS patients (left out in the logistic regression) were plotted onto brain charts to evaluate the logistic regression classifier’s performance.
Results and Discussion
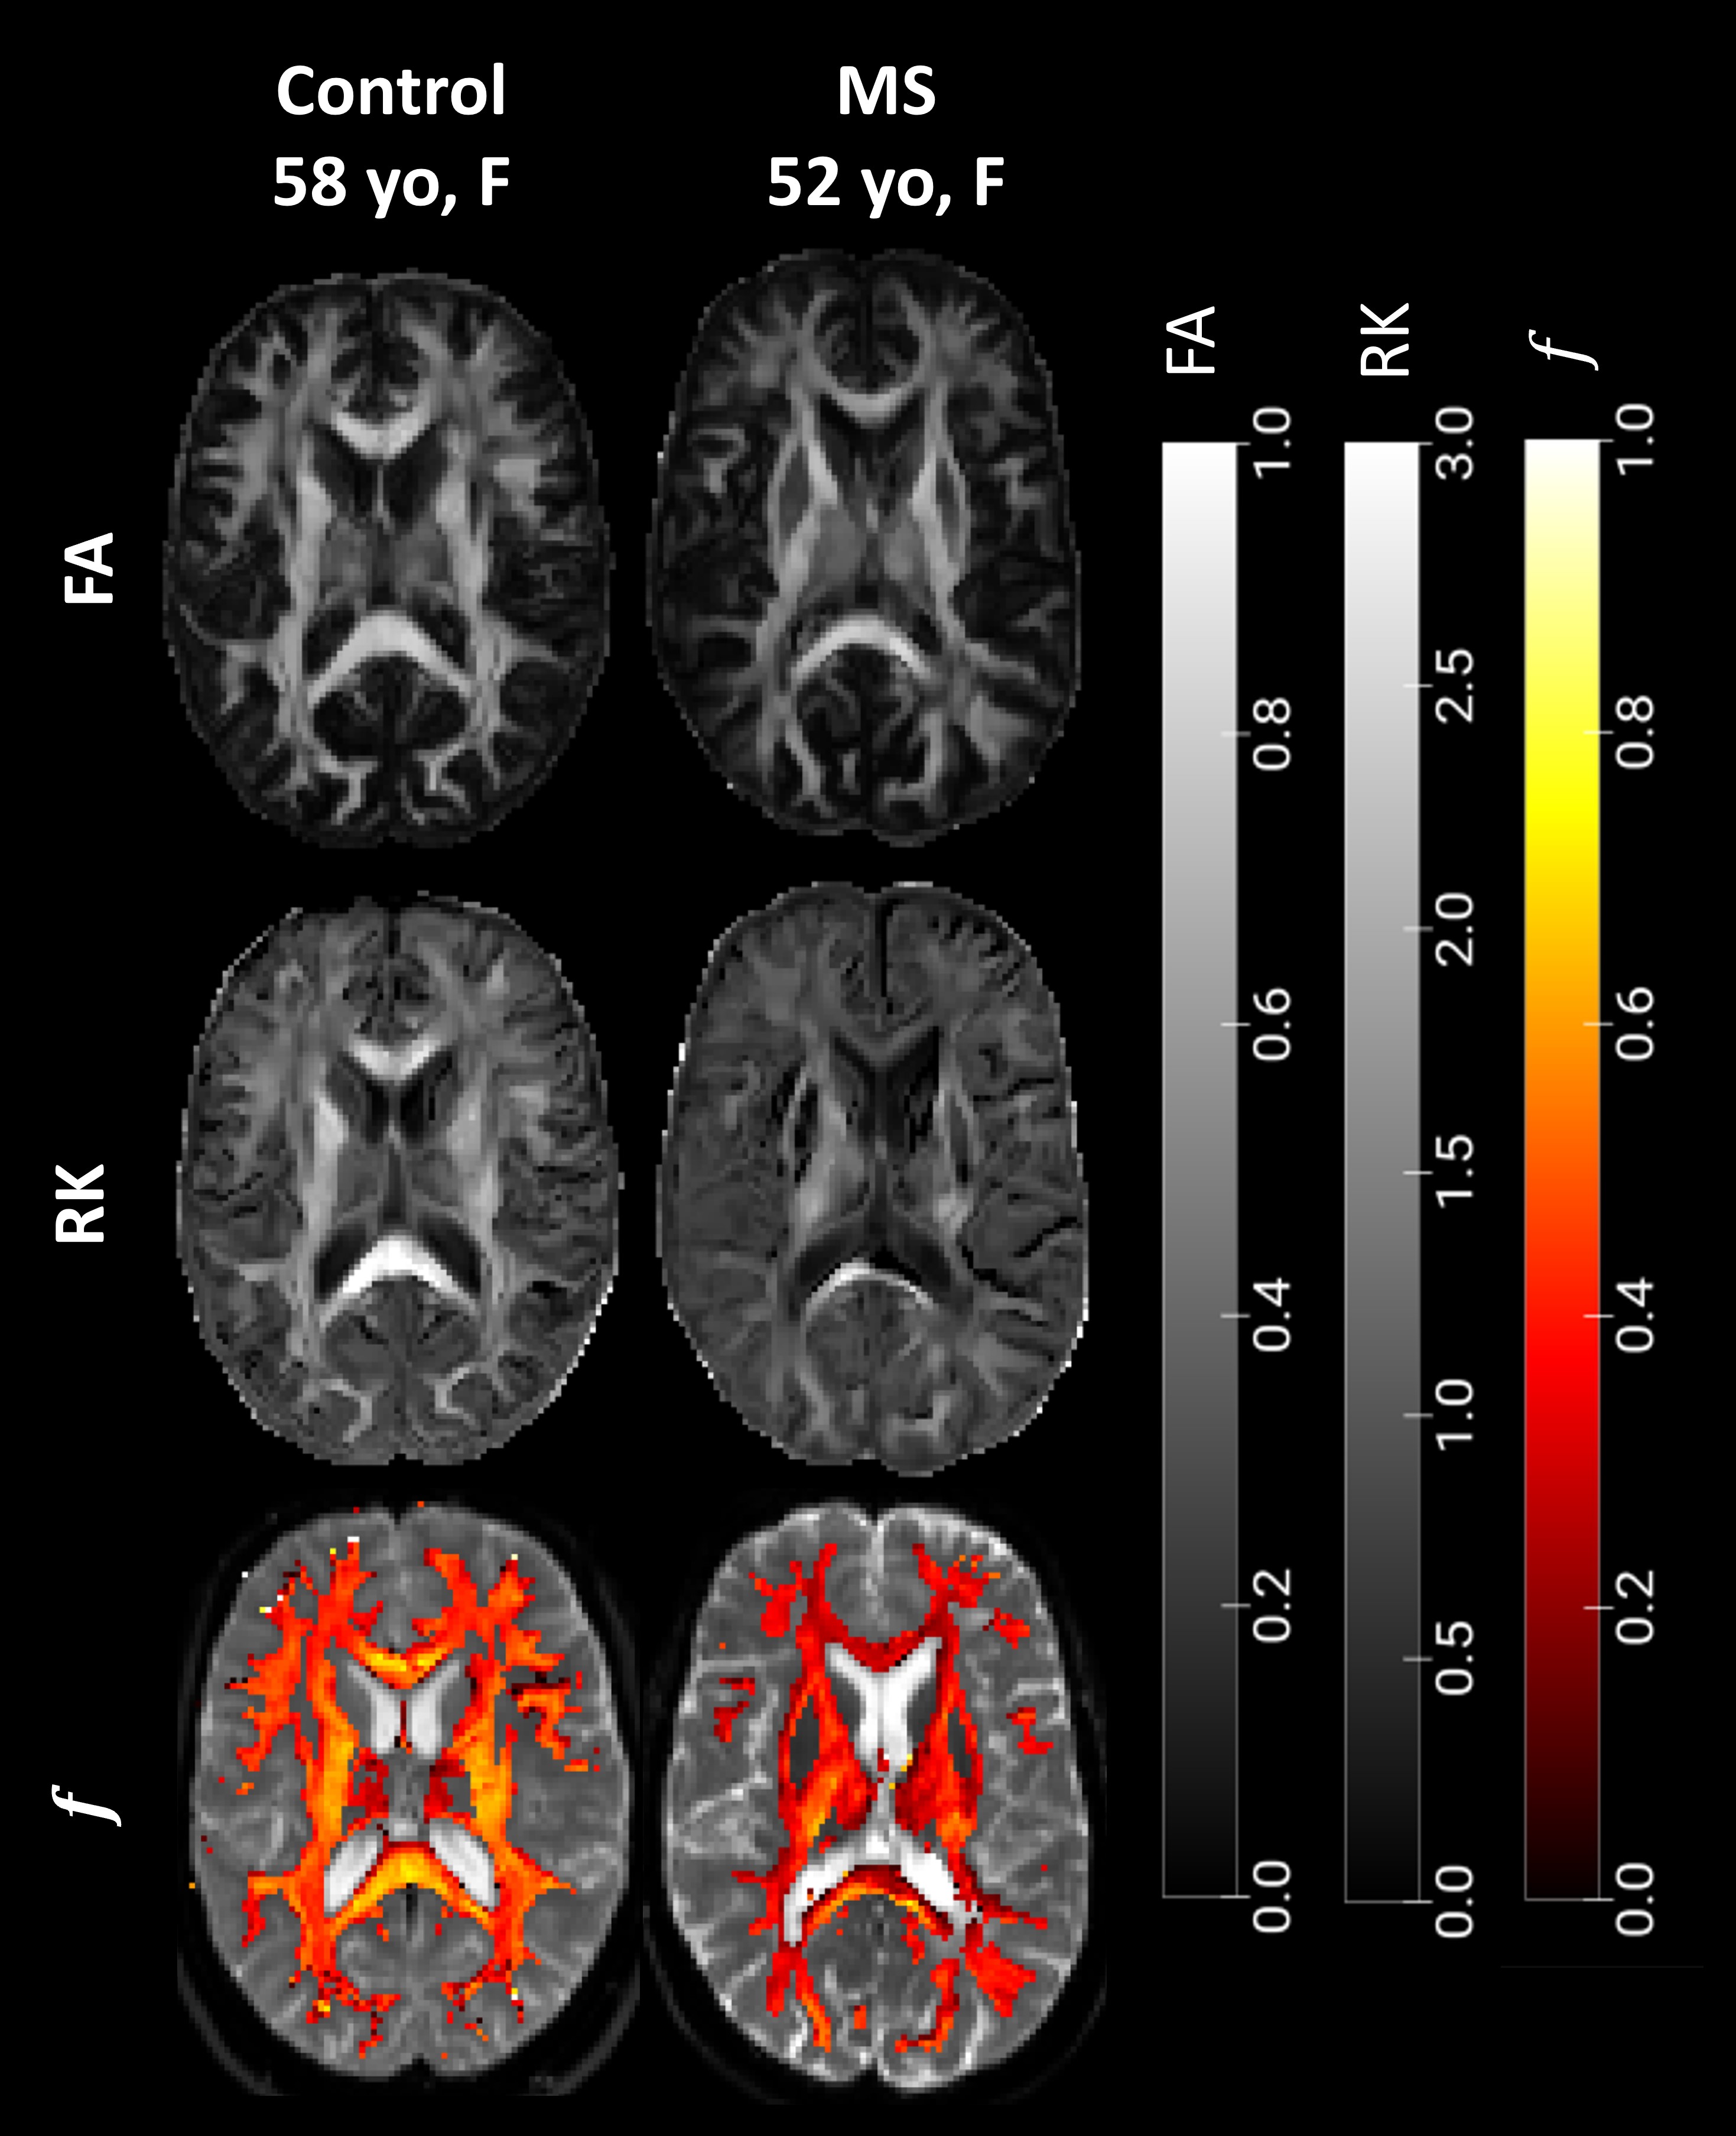
Figure 1 shows representative maps of an MS patient (52 year-old female) and control (58 year-old female), demonstrating maps with noticeably lower FA, RK, and $$$f$$$ in WM of MS.Logistic regression shows that combined with age and sex, RK and $$$f$$$ in posterior thalamic radiation (PTR) yields the highest AUC among DTI/DKI (AUC=0.88) and SMI (AUC=0.87) metrics respectively. As reference, RK and $$$f$$$ in global WM have AUC of 0.85 and 0.83 respectively.
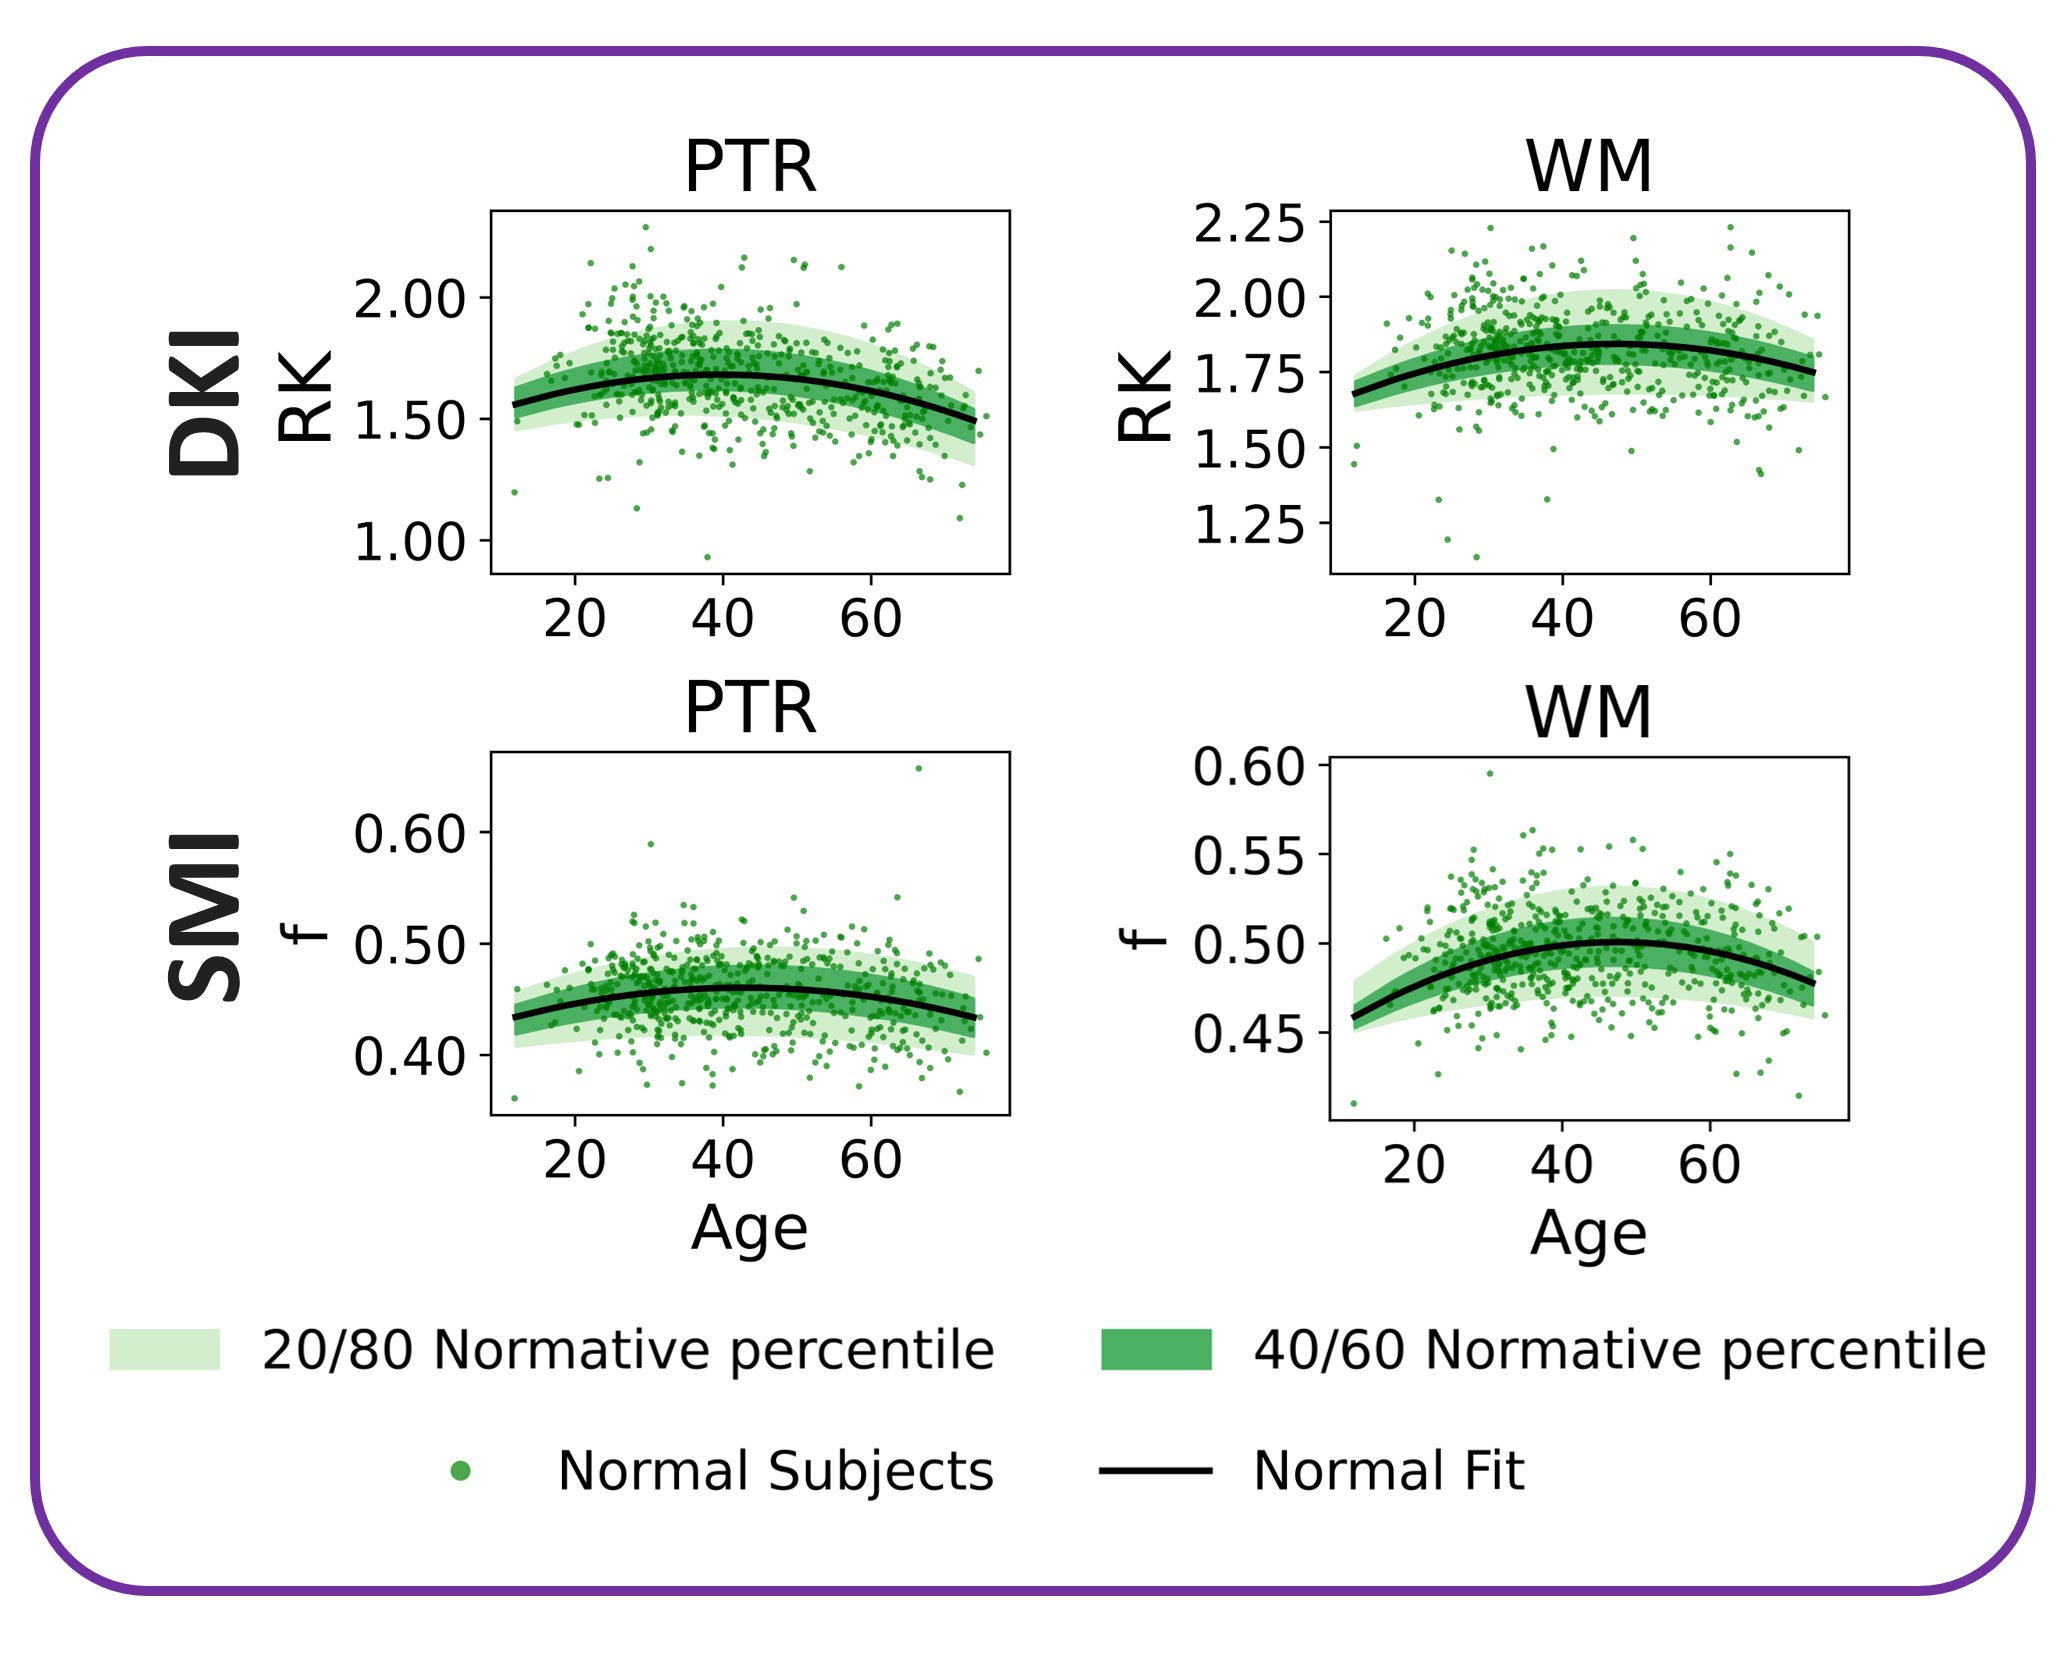
Figure 2 maps the normative aging trajectory, showing a) percentiles indicating normative inter-individual variability and b) RK and $$$f$$$ increasing then decreasing in PTR and whole WM, agreeing with known trends in WM development and aging18,19.
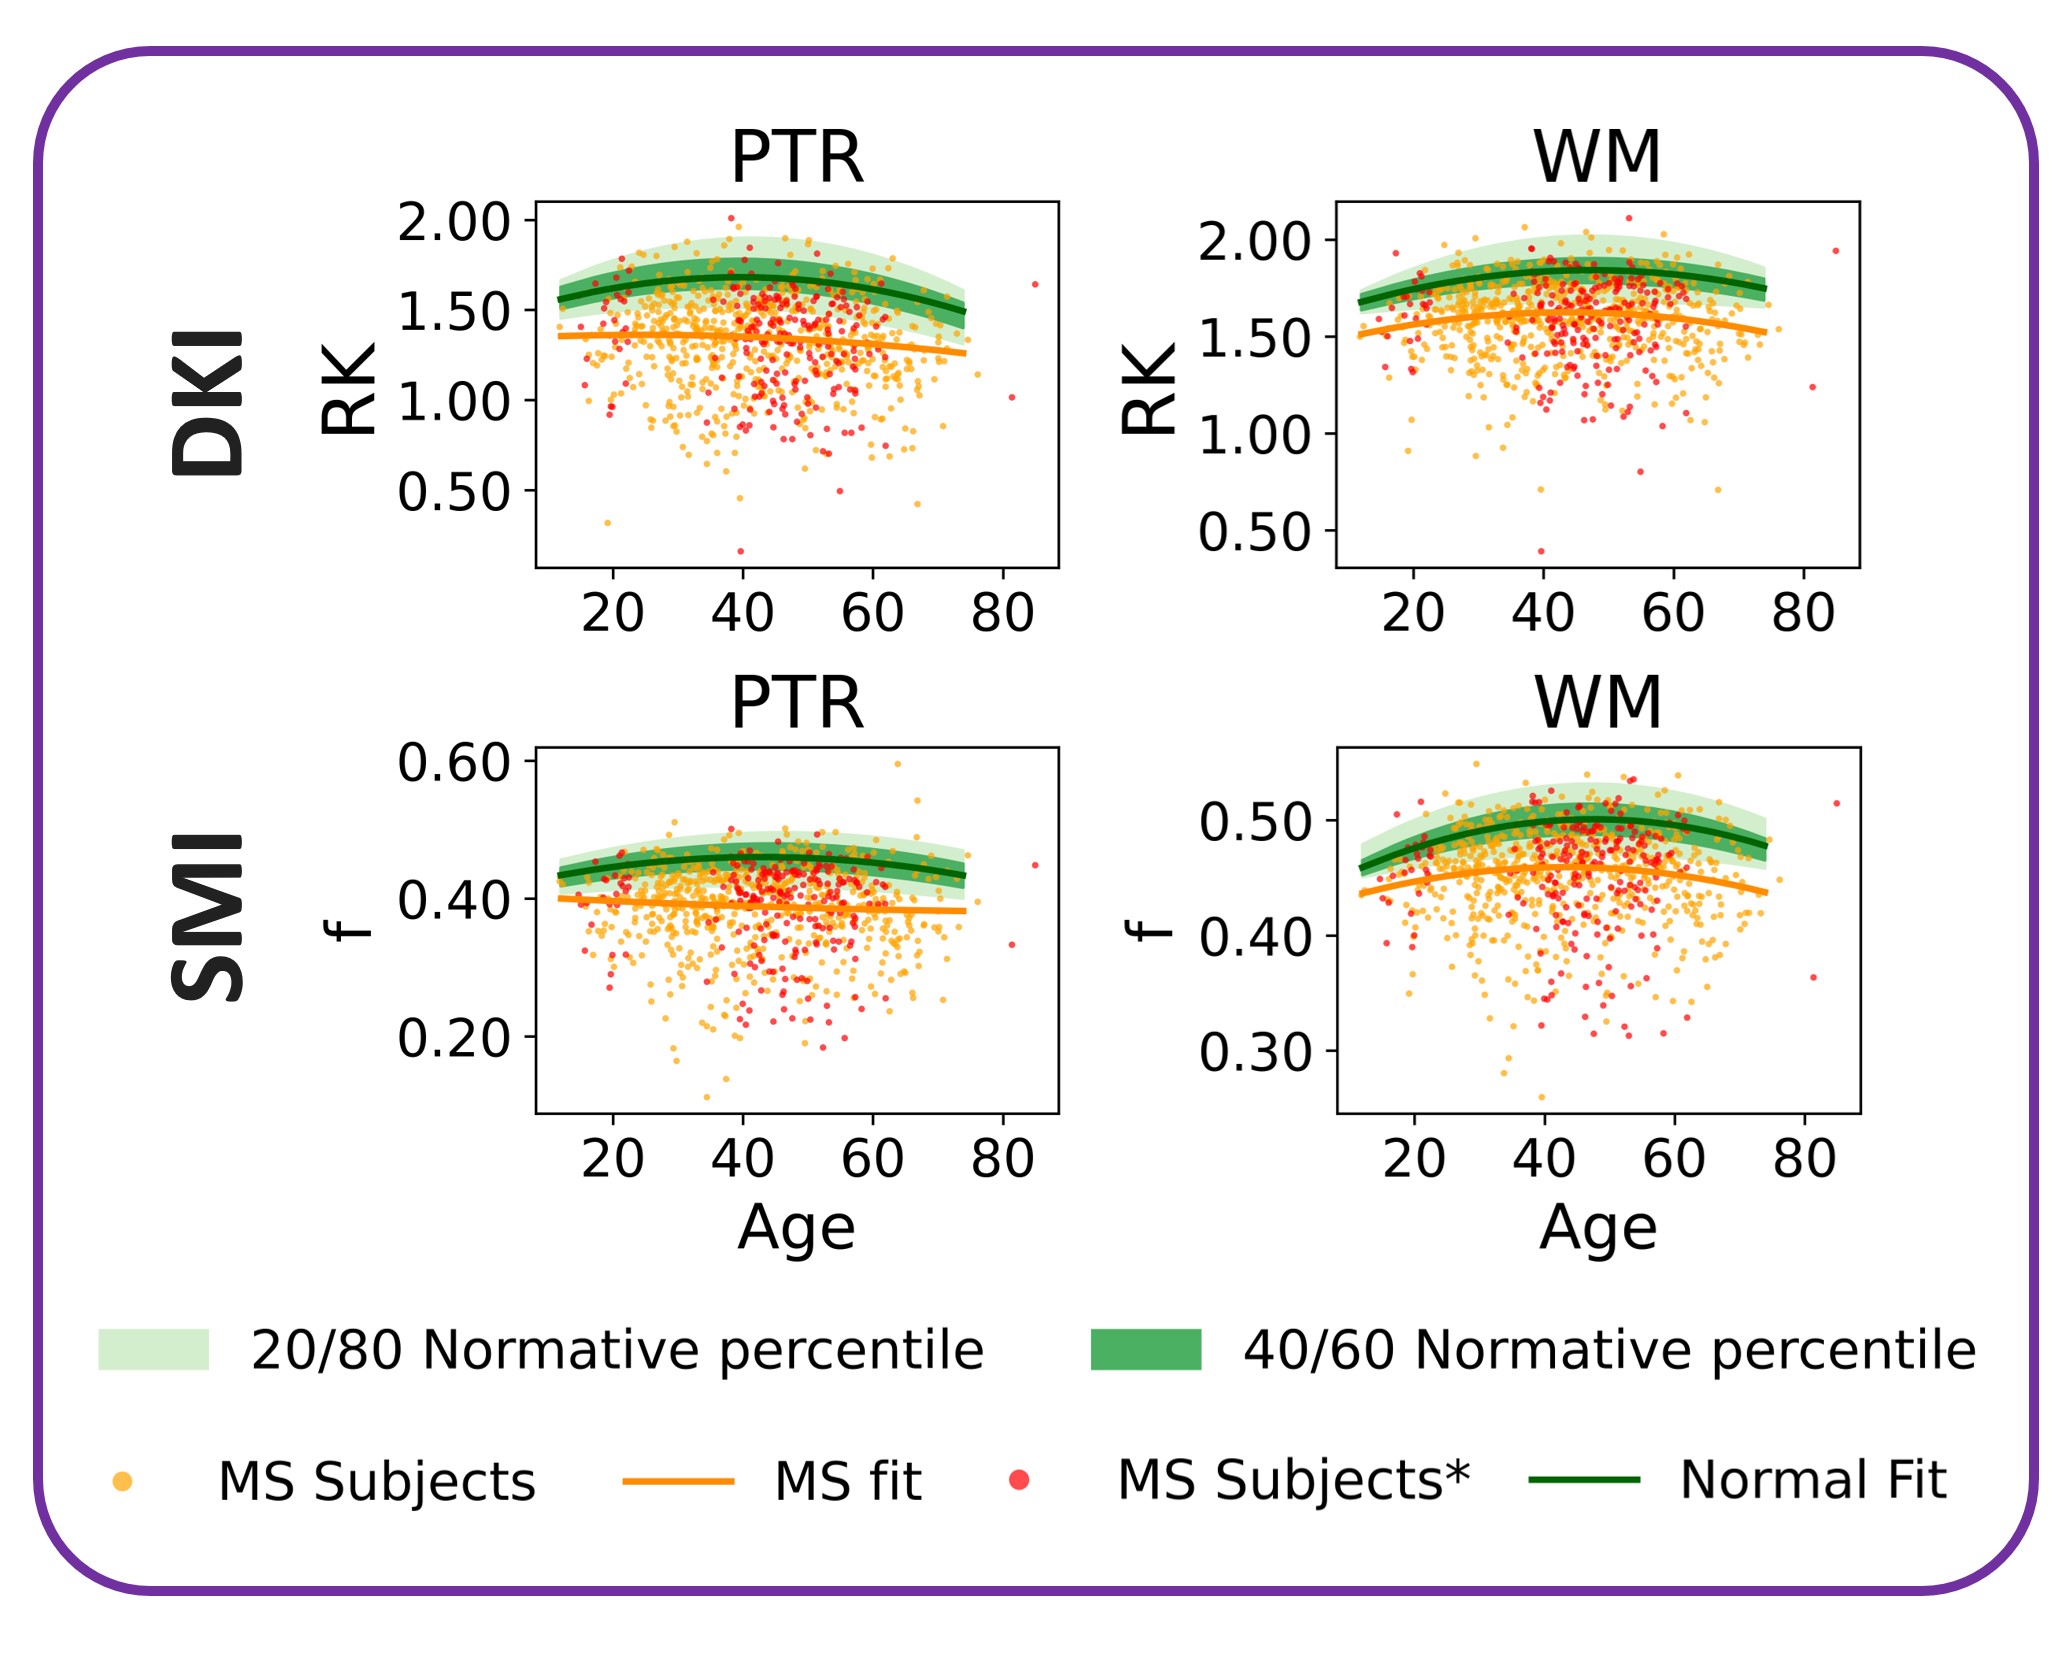
Figure 3 compares how MS patients deviate from the normative plots, revealing that a) RK and $$$f$$$ are lower in MS compared to control, both in PTR and whole WM and b) MS data excluded from logistic regression follows the same pattern. This observation may indicate accelerated aging in MS compared to control patients due to neurodegeneration and demyelination20.
Conclusion and Future Work
We generated a preliminary set of brain WM microstructure charts using controls to compare against MS data and achieved AUC of ~0.9 with the top performing ROI-dMRI metrics. The brain charts (Fig. 3) show how WM in MS deviates from controls, in agreement with the hypothesis of premature aging21, as also evidenced in parameter maps (Fig. 1, MS at <1 and control at 41st percentile)) and confirmed in an independent group of 232 MS patients (Fig. 3).Future work will include structural MRI to study GM volume and WM lesion load to create a robust, sensitive and accurate multi-dimensional brain age framework, and to correlate against MS disease severity and disease duration. Normative brain charts may be updated by pooling data from other studies22–25 and including additional parameters10. Ultimately, brain charts may someday be used clinically to monitor MS and other neurological diseases.
Acknowledgements
This work was supported in part by the National Institute of Neurological Disorders and Stroke of the NIH under awards R01 NS088040 and R01 EB027075, and by the Hirschl foundation and was performed under the rubric of the Center for Advanced Imaging Innovation and Research (CAI2R, www.cai2r.net), an NIBIB National Center for Biomedical Imaging and Bioengineering (NIH P41 EB017183).
References
- Bethlehem RAI, Seidlitz J, White SR, et al. Brain charts for the human lifespan. Nature. 2022;604(7906):525-533. doi:10.1038/s41586-022-04554-y
- Habes M, Pomponio R, Shou H, et al. The Brain Chart of Aging: Machine-learning analytics reveals links between brain aging, white matter disease, amyloid burden, and cognition in the iSTAGING consortium of 10,216 harmonized MR scans. Alzheimers Dement J Alzheimers Assoc. 2021;17(1):89-102. doi:10.1002/alz.12178
- Rutherford S, Fraza C, Dinga R, et al. Charting brain growth and aging at high spatial precision. Baker CI, Taschler B, Esteban O, Constable T, eds. eLife. 2022;11:e72904. doi:10.7554/eLife.72904
- Schabdach JM, Schmitt JE, Sotardi S, et al. Brain Growth Charts for Quantitative Analysis of Pediatric Clinical Brain MRI Scans with Limited Imaging Pathology. Radiology. 2023;309(1):e230096. doi:10.1148/radiol.230096
- Schilling KG, Chad JA, Chamberland M, et al. White matter tract microstructure, macrostructure, and associated cortical gray matter morphology across the lifespan. BioRxiv Prepr Serv Biol. Published online September 26, 2023:2023.09.25.559330. doi:10.1101/2023.09.25.559330
- Le Bihan D, Mangin JF, Poupon C, et al. Diffusion tensor imaging: concepts and applications. J Magn Reson Imaging Off J Int Soc Magn Reson Med. 2001;13(4):534-546.
- Jensen JH, Helpern JA. MRI quantification of non-Gaussian water diffusion by kurtosis analysis. NMR Biomed. 2010;23(7):698-710. doi:10.1002/nbm.1518
- Reisert M, Kellner E, Dhital B, Hennig J, Kiselev VG. Disentangling micro from mesostructure by diffusion MRI: a Bayesian approach. NeuroImage. 2017;147:964-975.
- Coelho S, Baete SH, Lemberskiy G, et al. Reproducibility of the Standard Model of diffusion in white matter on clinical MRI systems. NeuroImage. 2022;257:119290. doi:10.1016/j.neuroimage.2022.119290
- Novikov DS, Veraart J, Jelescu IO, Fieremans E. Rotationally-invariant mapping of scalar and orientational metrics of neuronal microstructure with diffusion MRI. NeuroImage. 2018;174:518-538. doi:https://doi.org/10.1016/j.neuroimage.2018.03.006
- Andersson JLR, Skare S, Ashburner J. How to correct susceptibility distortions in spin-echo echo-planar images: application to diffusion tensor imaging. NeuroImage. 2003;20(2):870-888. doi:10.1016/S1053-8119(03)00336-7
- Chen J, Ades-Aron B, Lee HH, et al. Optimization and Validation of the DESIGNER dMRI preprocessing pipeline in white matter aging. ArXiv Prepr ArXiv230514445. Published online 2023.
- Ades-Aron B, Veraart J, Kochunov P, et al. Evaluation of the accuracy and precision of the diffusion parameter EStImation with Gibbs and NoisE removal pipeline. NeuroImage. 2018;183:532-543. doi:https://doi.org/10.1016/j.neuroimage.2018.07.066
- Veraart J, Sijbers J, Sunaert S, Leemans A, Jeurissen B. Weighted linear least squares estimation of diffusion MRI parameters: strengths, limitations, and pitfalls. NeuroImage. 2013;81:335-346. doi:10.1016/j.neuroimage.2013.05.028
- Hua K, Zhang J, Wakana S, et al. Tract probability maps in stereotaxic spaces: analyses of white matter anatomy and tract-specific quantification. NeuroImage. 2008;39(1):336-347. doi:10.1016/j.neuroimage.2007.07.053
- Andersson JLR, Jenkinson M, Smith S. Non-linear registration, aka Spatial normalisation. Published online 2010.
- Liao Y, Coelho S, Chen J, Novikov DS, Fieremans E. Characterization of normal appearing white matter in Multiple Sclerosis with diffusion MRI using signal representations and model parameters. In: 2023 ISMRM Annual Meeting.
- Beck D, de Lange AMG, Maximov II, et al. White matter microstructure across the adult lifespan: A mixed longitudinal and cross-sectional study using advanced diffusion models and brain-age prediction. NeuroImage. 2021;224:117441. doi:10.1016/j.neuroimage.2020.117441
- Toschi N, Gisbert RA, Passamonti L, Canals S, Santis SD. Multishell diffusion imaging reveals sex-specific trajectories of early white matter degeneration in normal aging. Neurobiol Aging. 2020;86:191-200. doi:https://doi.org/10.1016/j.neurobiolaging.2019.11.014
- de Kouchkovsky I, Fieremans E, Fleysher L, Herbert J, Grossman RI, Inglese M. Quantification of normal-appearing white matter tract integrity in multiple sclerosis: a diffusion kurtosis imaging study. J Neurol. 2016;263(6):1146-1155. doi:10.1007/s00415-016-8118-z
- Tokarska N, Tottenham I, Baaklini C, Gawryluk JR. How does the brain age in individuals with multiple sclerosis? A systematic review. Front Neurol. 2023;14. doi:10.3389/fneur.2023.1207626
- Cox SR, Ritchie SJ, Tucker-Drob EM, et al. Ageing and brain white matter structure in 3,513 UK Biobank participants. Nat Commun. 2016;7(1):13629. doi:10.1038/ncomms13629
- Palmer CE, Pecheva D, Iversen JR, et al. Microstructural development from 9 to 14 years: Evidence from the ABCD Study. Dev Cogn Neurosci. 2022;53:101044. doi:https://doi.org/10.1016/j.dcn.2021.101044
- Petersen RC, Aisen PS, Beckett LA, et al. Alzheimer’s Disease Neuroimaging Initiative (ADNI): clinical characterization. Neurology. 2010;74(3):201-209. doi:10.1212/WNL.0b013e3181cb3e25
- Elam JS, Glasser MF, Harms MP, et al. The Human Connectome Project: A retrospective. NeuroImage. 2021;244:118543. doi:https://doi.org/10.1016/j.neuroimage.2021.118543
Figures