0119
Brain White Matter Microstructural Abnormalities in Children with Global Developmental Delay: A Tract-Based Spatial Statistics Analysis1the Third Affiliated Hospital of Zhengzhou University, Zhengzhou, China, 2GE Healthcare MR Research, Beijing, China
Synopsis
Keywords: DWI/DTI/DKI, Diffusion/other diffusion imaging techniques, Tract-Based Spatial Statistics;neurodevelopmental disorder;children
Motivation: The diagnosis of global developmental delay (GDD) heavily relies on clinical scale assessments, which are highly subjective and present challenges for early diagnosis and intervention.
Goal(s): The purpose of this study was to investigate the changes in white matter microstructure in children with GDD.
Approach: We used a diffusional kurtosis imaging (DKI)-based TBSS approach to analyze the whole brain.
Results: Our findings indicate abnormalities in multiple white matter brain regions among children with GDD. Additionally, DKI parameters were found to be correlated with clinical developmental levels.
Impact: The DKI can offer quantitative parameter values for assessing microstructural changes in the brain of GDD, making it a promising diagnostic tool.
Introduction and purpose
Global developmental delay (GDD) is a neurodevelopmental disorder defined as a significant delay in two or more domains, including gross/fine motor, speech/language, cognition, personal/social, and social communication.1 The etiology of GDD is complex, and the precise underlying mechanisms remain unclear. GDD is a temporary, transitional diagnosis, and many children develop mental retardation after the age of five, which can significantly impact their daily lives. Diagnostic and imaging studies of GDD are crucial for choosing treatments, predicting outcomes, assessing the risk of recurrence, and implementing prevention programs. Diffusion kurtosis imaging (DKI) is an advanced technology based on non-Gaussian theory, capable of sensitively detecting changes in the complex microstructure of the brain. The results of several previous studies2-4 on brain microstructure in children with GDD have demonstrated significant heterogeneity and a lack of a unified consensus, which has hindered the comprehensive analysis of the complex pathomechanisms associated with GDD. Our study aimed to employ a Tract-Based Spatial Statistics (TBSS)5 approach to investigate potential alterations in cerebral white matter fiber tracts in children with GDD and to assess whether these affected fiber tracts correlate with the developmental status of children with GDD.Materials and methods
Our Ethics Review Committee approved this retrospective study, and informed consent and signatures of guardians were obtained. A total of 62 subjects were recruited, including 34 children with GDD (21-58 months) and 28 healthy control children (HCs, 23-60 months) matched for age and sex. Neurodevelopmental status was assessed by a specialized pediatrician using the Chinese version of the Gesell Developmental Scale (GDS)6 for all children with GDD. All children's MRI scans were performed using a 3.0 T MR scanner (Signa Pioneer, GE Healthcare, Milwaukee, WI) with a standard 16-channel phased-array head coil. DKI data were acquired using a spin-echo single-shot echo planar imaging sequence with three b values (0, 1000, and 2000 s/mm²) along 25 gradient encoding directions for each non-zero b value(TR/TE=8200/99ms; field of view=200×200 mm2; matrix size= 128×128; slice thickness=4.0 mm; slice number=30; flip angle= 90; number of excitations=1; and acquisition time was 7 min and 23 s). Voxel-wise TBSS analysis of DKI parameters was conducted between the two groups using FSL (FMRIB Software Library, version 6.0.5). The parameters include fractional anisotropy (FA), mean diffusivity (MD), axial diffusivity (AD), radial diffusivity (RD), mean kurtosis (MK), axial kurtosis (AK), radial kurtosis (RK), and fractional anisotropy kurtosis (FAK). Statistical analysis was performed using SPSS software(version 23.0, IBM Corp., Armonk, NY, USA). Spearman correlation analysis was employed to explore the correlation between diffusion MRI metrics and GDS scores.Result
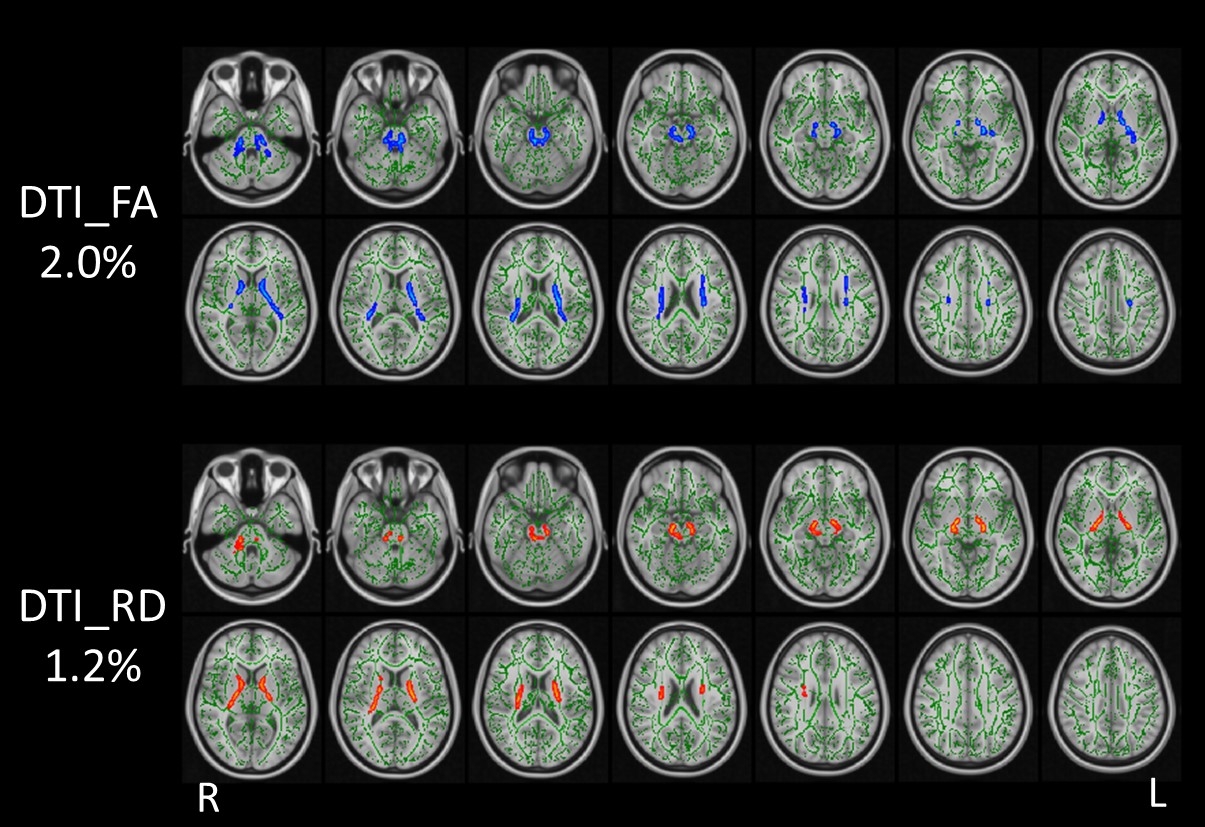
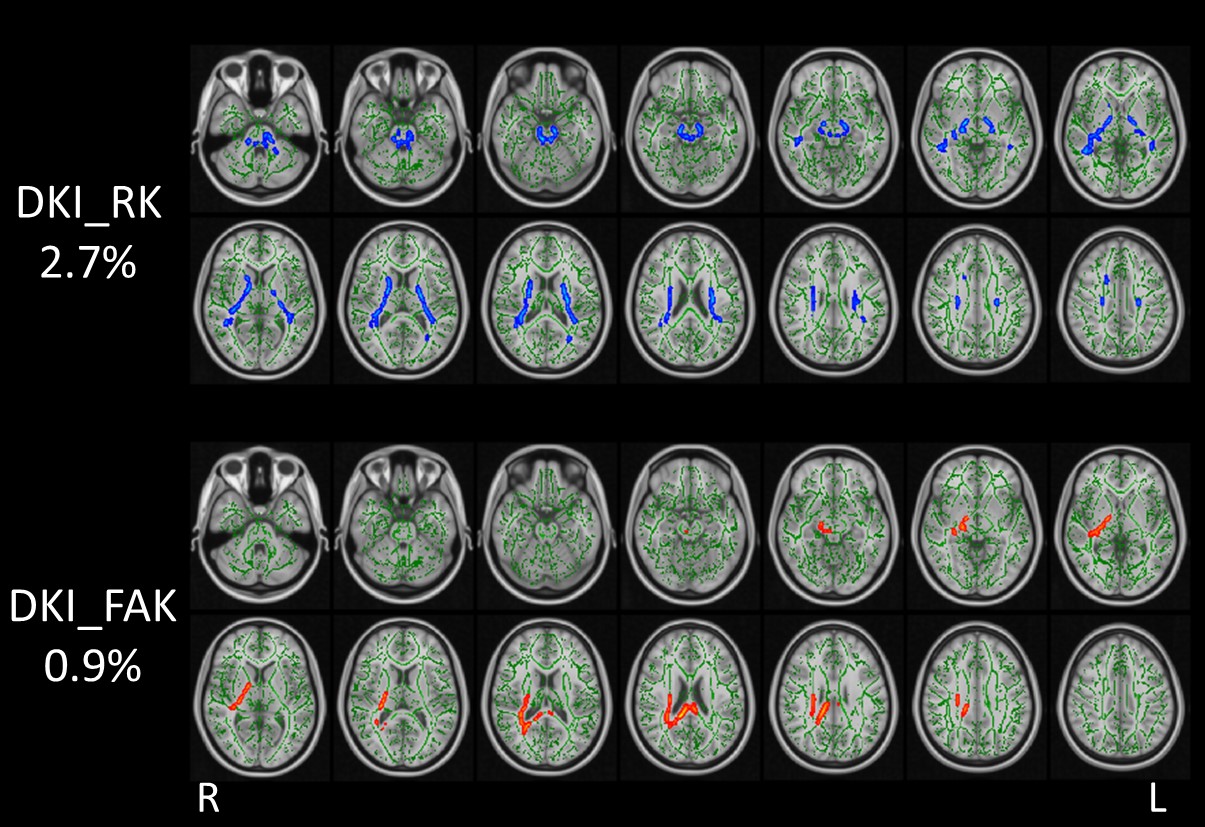
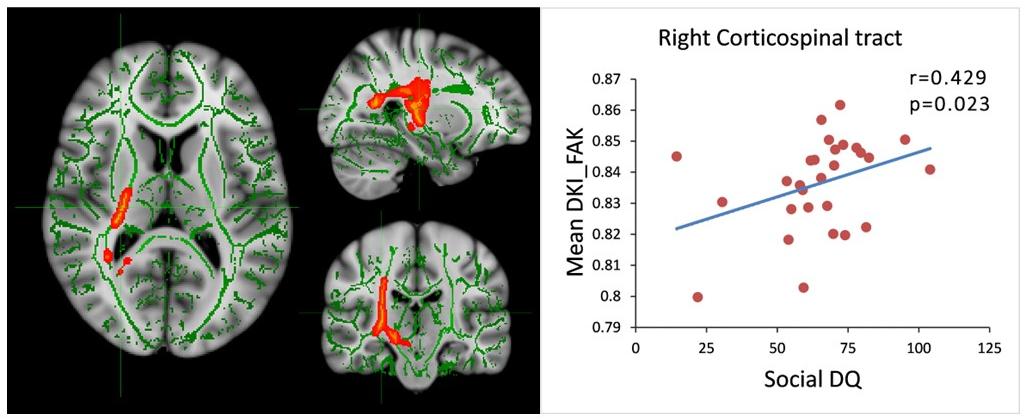
Compared with healthy controls (HCs), children with GDD exhibited reduced FA, RK, and elevated RD and FAK (p < 0.05, with family-wise error correction) in various white matter brain regions, including the anterior thalamic radiation (ATR), corticospinal tract (CST), inferior fronto-occipital fasciculus (IFOF), inferior longitudinal fasciculus (ILF), superior longitudinal fasciculus (SLF), forceps minor, posterior limb of the internal capsule (PLIC), splenium of the corpus callosum (SCC), forceps major, and cingulum. RK, FA, RD, and FAK detected 2.7%, 2.0%, 1.2%, and 0.9% of abnormal diffusion voxels in the entire white matter skeleton, respectively (Fig. 1-2). In the GDD group, we found a significant positive correlation between the mean FAK value and the social developmental quotient in the right CST (r = 0.429, p = 0.023) (Fig. 3). No significant difference was observed between the two groups in terms of MD, AD, MK, and AK.Discussion and Conclusions
RD and RK are recognized markers of demyelination and dysmyelination, while FA and FAK represent composite measures of microstructural integrity. Children with GDD exhibit decreased FA, RK, and increased RD and FAK in multiple white matter brain regions, indicating the axons and myelin sheaths in these regions are severely damaged, which has significant implications for the development of GDD. Notably, FAK values are a sensitive tool for detecting microstructural changes in the brains of children with GDD, holding the potential for monitoring microstructural damage and assessing disease development. In conclusion, this study provides new evidence for assessing brain microstructural changes in GDD, and DKI proves to be a valuable tool for exploring underlying pathologic mechanisms in GDD.Acknowledgements
This project was supported by the National Natural Science Funds of China (Grants No.81870983 and 82371929).References
1. Shevell M, Ashwal S, Donley D, et al. Practice parameter: evaluation of the child with global developmental delay: report of the Quality Standards Subcommittee of the American Academy of Neurology and The Practice Committee of the Child Neurology Society. Neurology. 2003; 60(3):367-80.
2. Filippi CG, Lin DD, Tsiouris AJ, et al. Diffusion-tensor MR imaging in children with developmental delay: preliminary findings. Radiology. 2003; 229(1):44-50.
3. Verma A, Sagar NC, Kumar A, Srivastava A. Diagnostic value of diffusion tensor imaging derived metrics as biomarkers of cerebral changes in developmental delay. Indian J Radiol Imaging. 2015; 25(4):415-20.
4. Ramli N, Yap A, Muridan R, et al. Microstructural abnormalities found in uncinate fasciculus and superior cerebellar tracts in children with global developmental delay: a feasibility study. Clin Radiol. 2020; 75(1):77 e15-77 e22.
5. Smith SM, Jenkinson M, Johansen-Berg H, et al. Tract-based spatial statistics: voxelwise analysis of multi-subject diffusion data. Neuroimage. 2006; 31(4):1487-505.
6. Group BMDC. Gesell Developmental Diagnosis Scale. Beijing, China: Beijing Mental Development Cooperative Group. 1985.
Figures