0114
Microstructural Characterization of Network-Based Neurodegeneration in Multiple Sclerosis Using High Gradient Diffusion MRI.1Radiology, Massachusetts General Hospital, Boston, MA, United States, 2Neurology, Massachusetts General Hospital, Boston, MA, United States
Synopsis
Keywords: Microstructure, Gray Matter, Neurodegeneration
Motivation: Findings of this study help clarify the microstructural substrate of network-based gray matter (GM) atrophy and improve current understanding of network concepts in multiple sclerosis (MS).
Goal(s): The goal of this study was to assess network behavior of microstructural alterations in atrophy-prone GM.
Approach: We leveraged high gradient diffusion MRI to probe GM at the mesoscopic scale by using the SANDI (Soma and Neurite Density Imaging) method.
Results: Our results demonstrated decreased cell body density in atrophy-prone GM of MS, which correlates with clinical disability. Further, covariance of localized GM microstructural alteration suggests that neuronal loss may relate in part to network-based effects.
Impact: Decreased cell body density in atrophy-prone gray matter in multiple sclerosis is correlated with clinical disability and exhibits network behavior. Findings may support future development of quantitative non-invasive methods for sensitive monitoring of disease progression to enable prompt clinical intervention.
Introduction
Neurodegeneration is a key component of clinical disability in multiple sclerosis (MS). However, the exact underlying mechanism of localized gray matter (GM) atrophy in MS remains unclear. More recently, a network-based etiology has been postulated, which may be associated with clinical progression 1–3. The goal of this study was to assess network behavior of microstructural alteration in atrophy-prone GM 3,4. We leveraged high gradient diffusion MRI (dMRI) to probe GM at the mesoscopic scale by using the SANDI (Soma and Neurite Density Imaging) method, a novel biophysical modeling approach 5. Our hypothesis was that cell body density of atrophy-prone GM will be decreased in MS which will correlate with disease severity and that these regions will exhibit microstructural covariation. Findings of this study would clarify the microstructural substrate of network-based GM atrophy and improve current understanding of network concepts in MS.Methods
Whole-brain dMRI was obtained for all participants on the 3T Connectome MRI scanner with 300 mT/m maximum gradient strength (MAGNETOM Connectom, Siemens Healthineers) 6. dMRI was acquired with a multi-shell diffusion protocol using a diffusion time ∆ = 19 ms, 8 b-values (b = 50-350-800-1500 s/mm2 in 32 directions, and b = 2400-3450-4750-6000 s/mm2 in 64 directions), and an isotropic resolution of 2 mm. A short diffusion time was used to minimize the potential confound of intercompartmental exchange 7. After all imaging data were preprocessed using an established pipeline 8, SANDI model fitting was performed using AMICO 9. A λ2 regularization term of 0.005 was empirically chosen and concurs with current literature 7. SANDI metrics were computed including the intra-soma signal fraction (fis; Figure 1), which reflects cell body density. Nodes in the Atrophy-based Functional Network (AFN) model were used to define regions-of-interest (ROIs; Figure 2) 3,4. ROIs were binarized and transformed from standard (Montreal Neurological Institute) to the diffusion space of each participant with nonlinear registration. ROIs were then used to sample the fis map of each participant. Statistical analyses included group-wise comparisons of the average fis of each ROI and for the nodal aggregate using independent samples t-tests with FDR-correction. Association of AFN nodal aggregate fis with the Expanded Disability Status Scale (EDSS) score and disease duration were assessed using Spearman’s rank-order correlation. Pearson’s correlation coefficients were computed for all ROIs pairs to generate a covariance matrix.Results
Participants included 38 MS (M/F: 11/27; age 44 ± 11 years; EDSS 2.8 ± 1.7, 1 - 7.5; disease duration 9.5 ± 6.6 years) and 35 age-matched healthy controls (HC; M/F: 15/20; age 39 ± 15 years; p = 0.13). fis was decreased between MS and HC for the aggregate average of all AFN atrophy nodes. fis of both cortical and subcortical nodes including in the basal ganglia, thalamus, and precentral gyrus remained significantly decreased at the individual nodal level (Table). The aggregate nodal fis demonstrated an association with the EDSS score (ρ = -0.543, p < 0.001); Figure 3) and a relatively weaker correlation with disease duration (ρ = -0.317, p = 0.056). Correlations between all nodes were computed and displayed in a heatmap, which demonstrated presence of medium to large effect sizes (Figure 4).Discussion
Decreased cell body density was observed in atrophy-prone GM of MS and correlated with clinical disability. Further, covariance of localized GM microstructural alteration suggests that neuronal loss may relate in part to network-based effects. These findings agree with a growing body of literature suggesting that damage in MS may lead to “network collapse” and a state change with accelerated clinical progression 1–3. More broadly, evolving network concepts in MS may be an extension of the network degeneration hypothesis (NDH), which initially emerged from observations of neurodegenerative disorders causing cognitive and motor performance degradation including different types of dementias 10. In this study, microstructural assessment was guided by the AFN model, which was meta-analytically derived and describes nodal regions that reflect atrophy-prone GM 3,4. Targeted microstructural assessment of these GM nodal regions may allow more sensitive characterization of GM damage prior to overt parenchymal volume loss. Additionally, the detection of covarying neuronal loss encourages future work to investigate structural connectivity involving AFN nodal regions.Conclusion
In conclusion, decreased cell body density in atrophy-prone GM in MS is correlated with clinical disability and exhibits network behavior. Network-based microstructural measures may provide the foundation for future development of quantitative non-invasive methods for more sensitive monitoring of disease progression which would enable prompt clinical intervention.Acknowledgements
Research Fellow Grant RF2303, Radiological Society of North America Research and Education Foundation.References
1. Schoonheim MM, Broeders TAA, Geurts JJG. The network collapse in multiple sclerosis: An overview of novel concepts to address disease dynamics. Neuroimage Clin 2022;35.
2. Chard DT, Miller DH. What lies beneath grey matter atrophy in multiple sclerosis? Brain 2016;139:7–10.
3. Chiang FL, Feng M, Romero RS, et al. Disruption of the atrophy-based functional network in multiple sclerosis is associated with clinical disability: Validation of a meta-analytic model in resting-state functional MRI. Radiology 2021;299:159–66.
4. Chiang FL, Wang Q, Yu FF, et al. Localised grey matter atrophy in multiple sclerosis is network-based : a coordinate-based meta-analysis. Clin Radiol 2019;74:816.e19-816.e28.
5. Palombo M, Ianus A, Guerreri M, et al. SANDI: A compartment-based model for non-invasive apparent soma and neurite imaging by diffusion MRI. Neuroimage 2020;215.
6. Huang SY, Tian Q, Fan Q, et al. High-gradient diffusion MRI reveals distinct estimates of axon diameter index within different white matter tracts in the in vivo human brain. Brain Struct Funct 2020;225:1277–91.
7. Jelescu IO, de Skowronski A, Geffroy F, et al. Neurite Exchange Imaging (NEXI): A minimal model of diffusion in gray matter with inter-compartment water exchange. Neuroimage 2022;256.
8. Tian Q, Fan Q, Witzel T, et al. Comprehensive diffusion MRI dataset for in vivo human brain microstructure mapping using 300 mT/m gradients. Sci Data 2022;9.
9. Daducci A, Canales-Rodríguez EJ, Zhang H, et al. Accelerated Microstructure Imaging via Convex Optimization (AMICO) from diffusion MRI data. Neuroimage 2015;105:32–44.
10. Seeley WW, Crawford RK, Zhou J, et al. Neurodegenerative diseases target large-scale human brain networks. Neuron 2009;62:42–52.
Figures
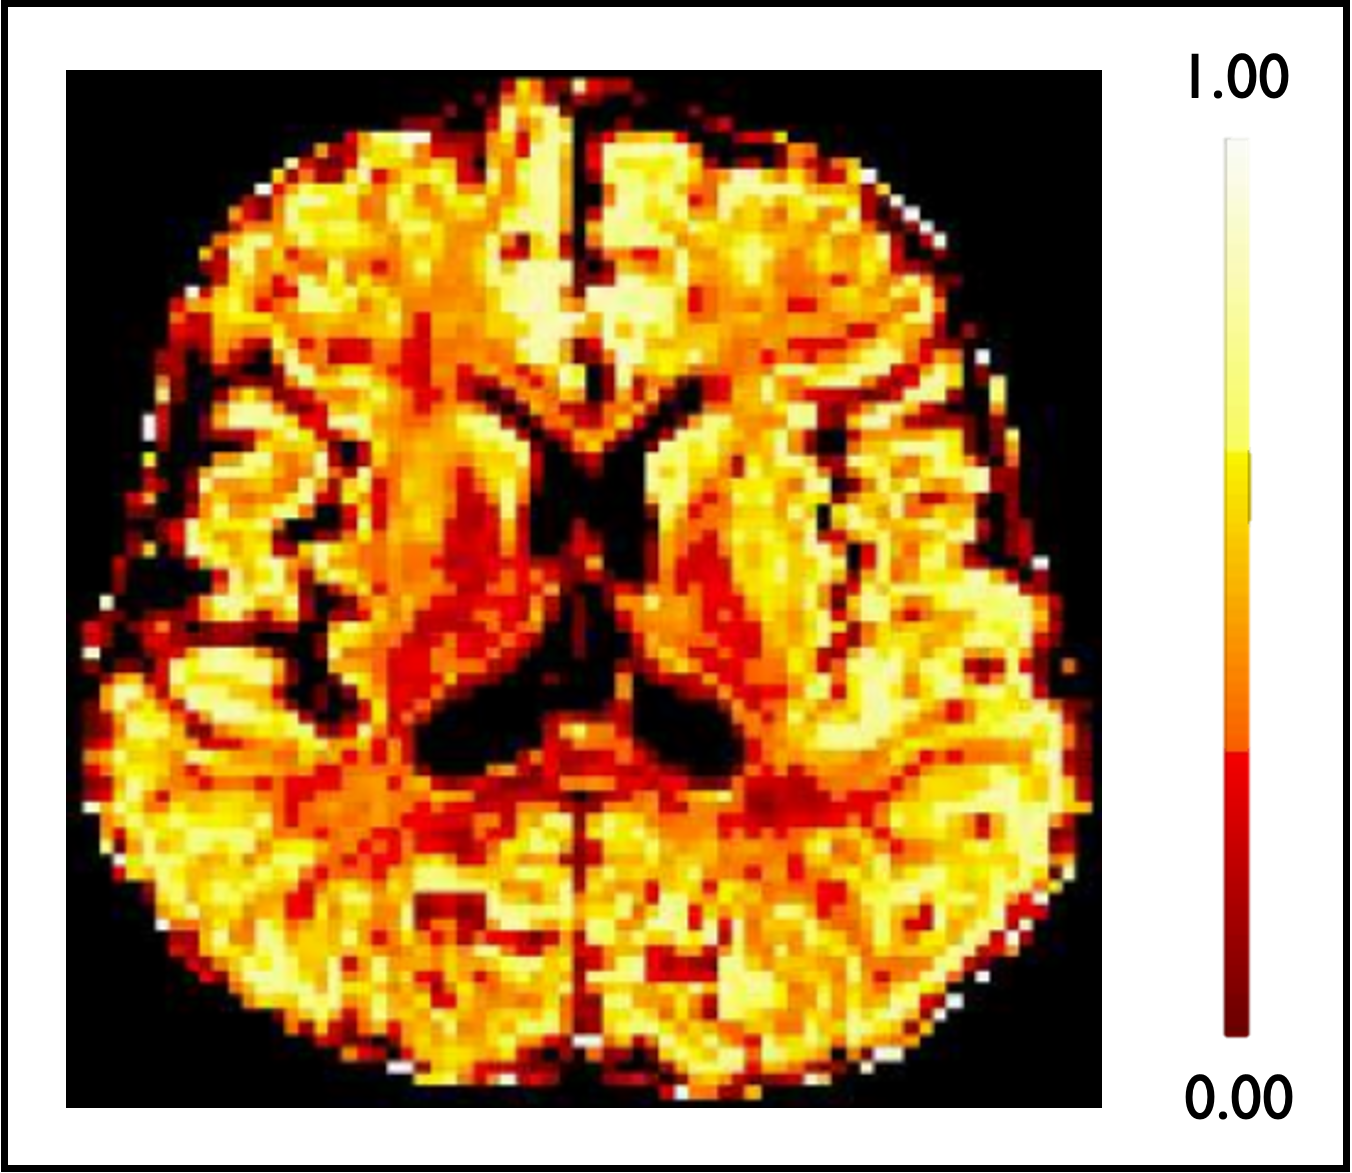
Figure 1. Intra-soma Signal Fraction Map (fis). SANDI (Soma and Neurite Density Imaging), a novel compartment-based biophysical modeling method, was used to compute estimates of cell body density in multiple sclerosis. Maps of intra-soma signal fraction reflect cell body density and are used to evaluate gray matter microstructure.
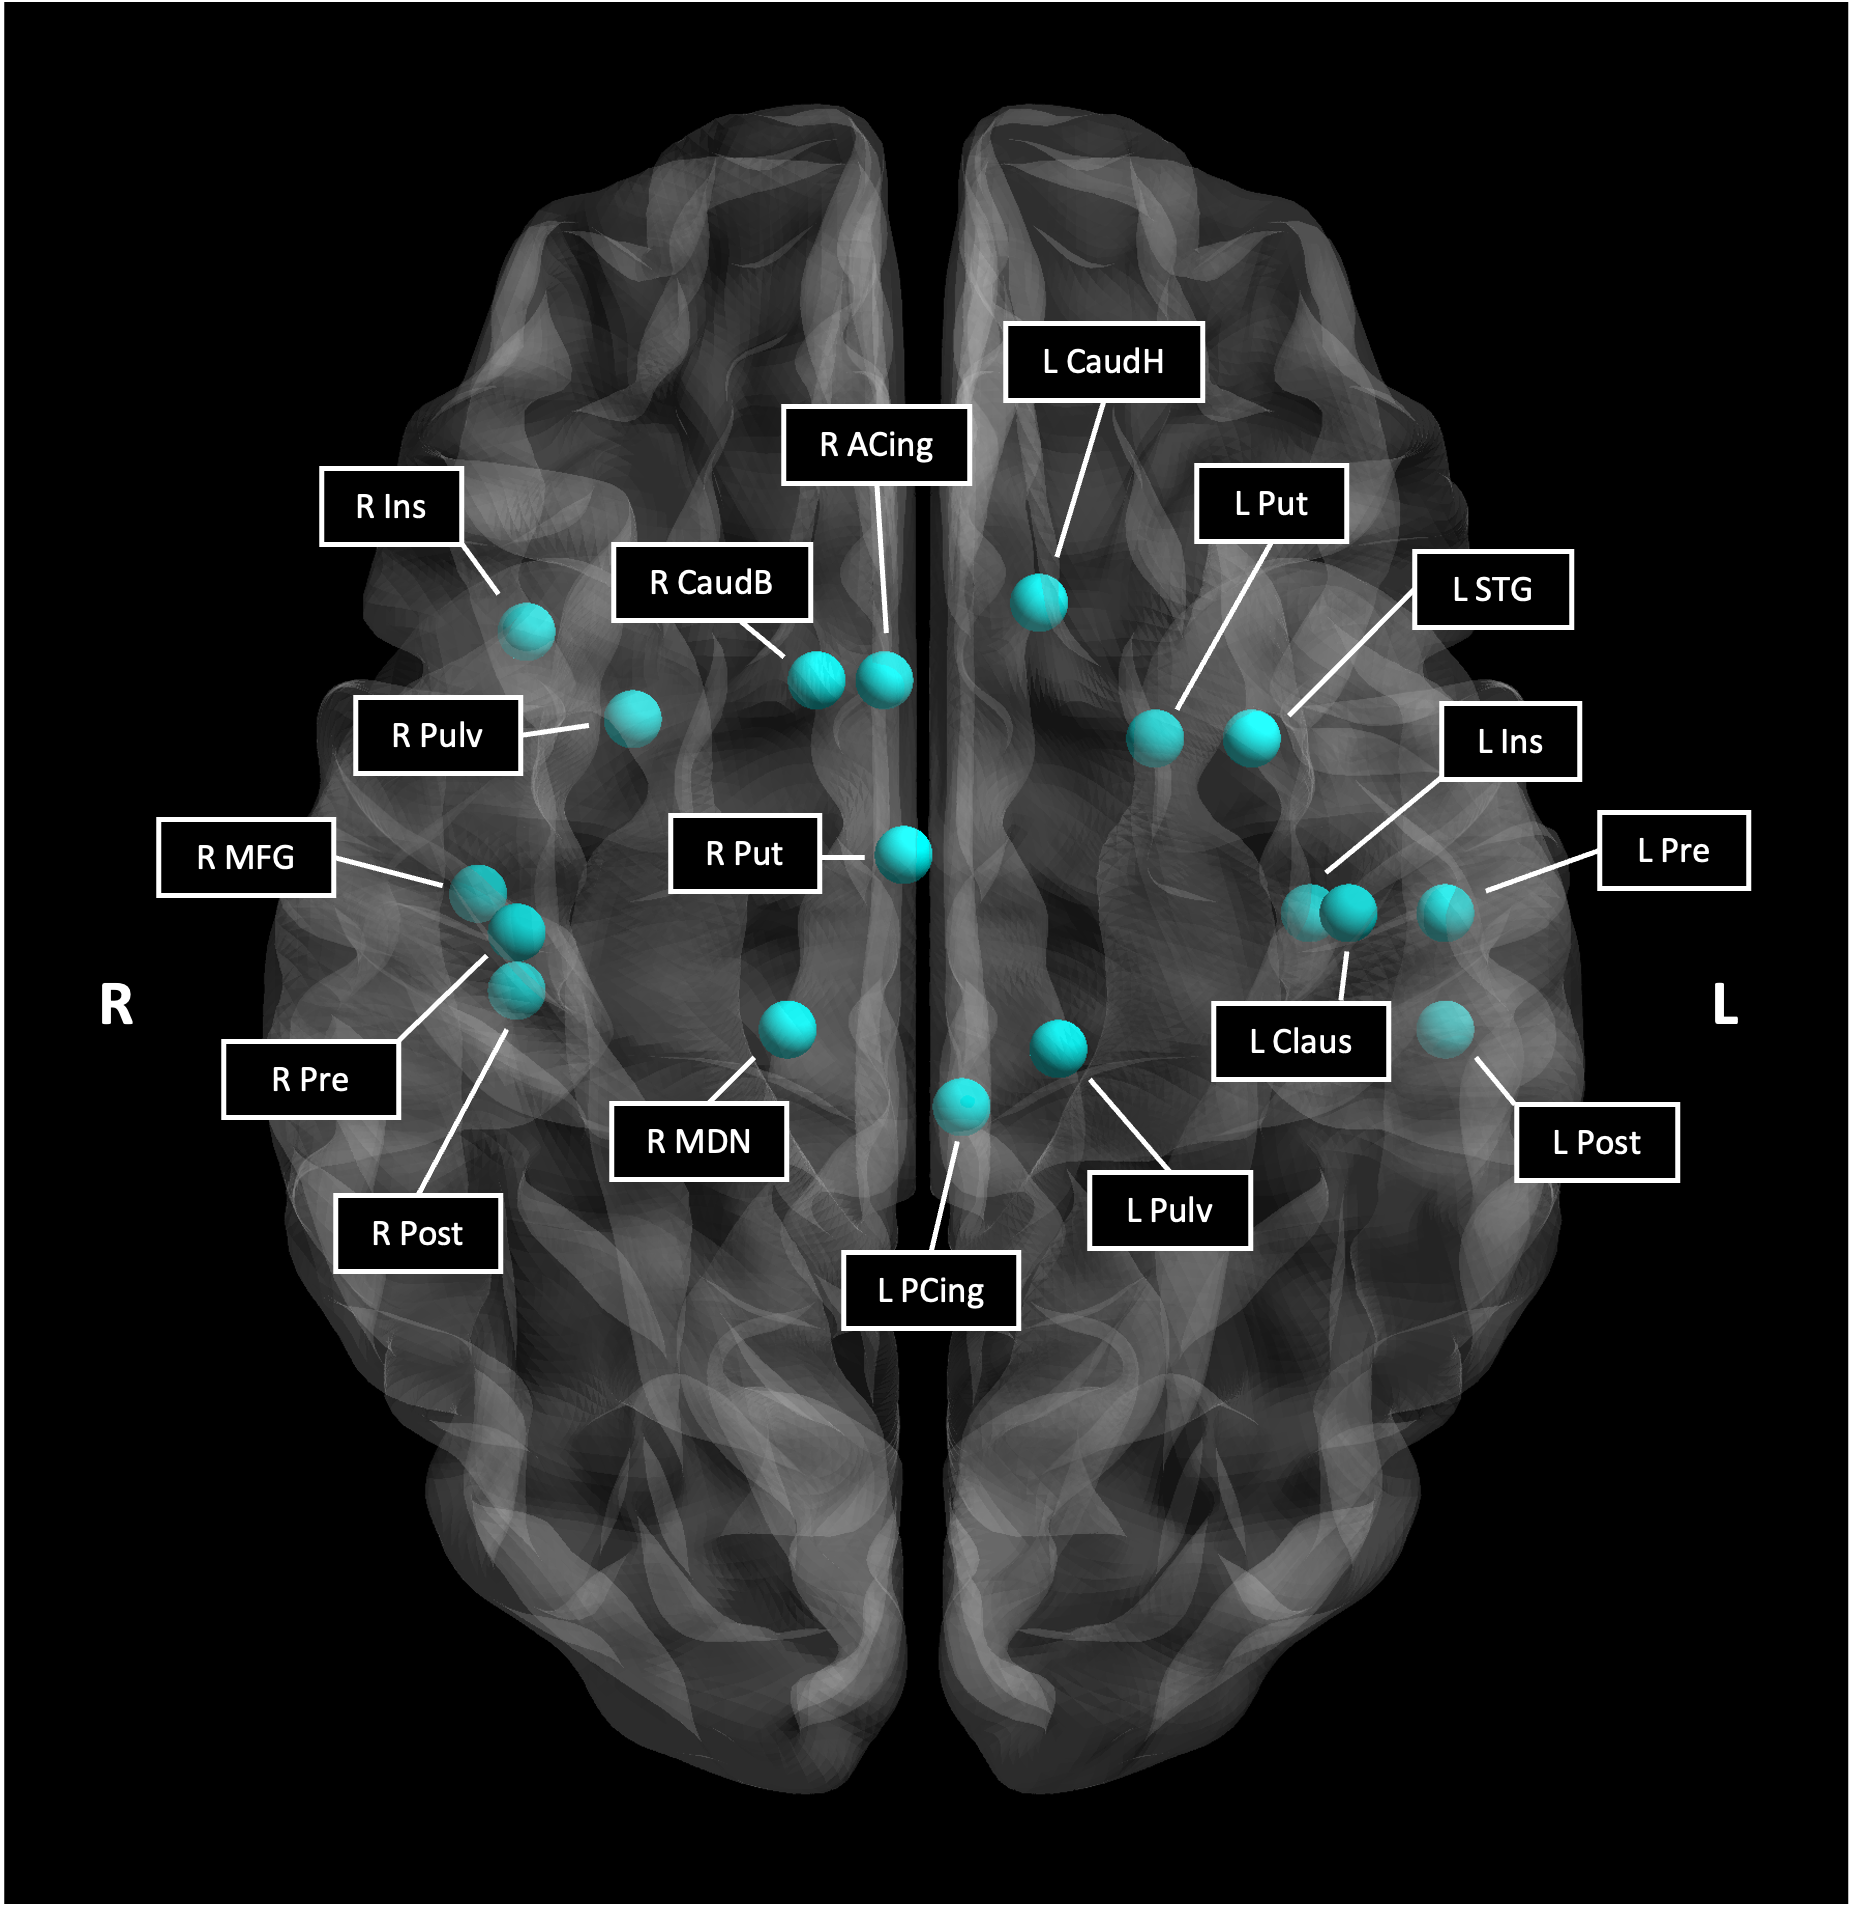
Figure 2. Atrophy Nodes in the AFN Model (Chiang et al. Radiology 2021). Meta-analytically defined nodes represent cortical and subcortical gray matter prone to atrophy in multiple sclerosis.
AFN, Atrophy-based Functional Network model; L, left; R, right; CaudH, caudate head; Ins, insula; Post, postcentral gyrus; Pulv, pulvinar; STG, superior temporal gyrus; CaudB, caudate body; MDN, mediodorsal nucleus; Claus, claustrum; PCing, posterior cingulate gyrus; Pre, precentral gyrus; Put, putamen; ACing, anterior cingulate gyrus; MFG, middle frontal gyrus.
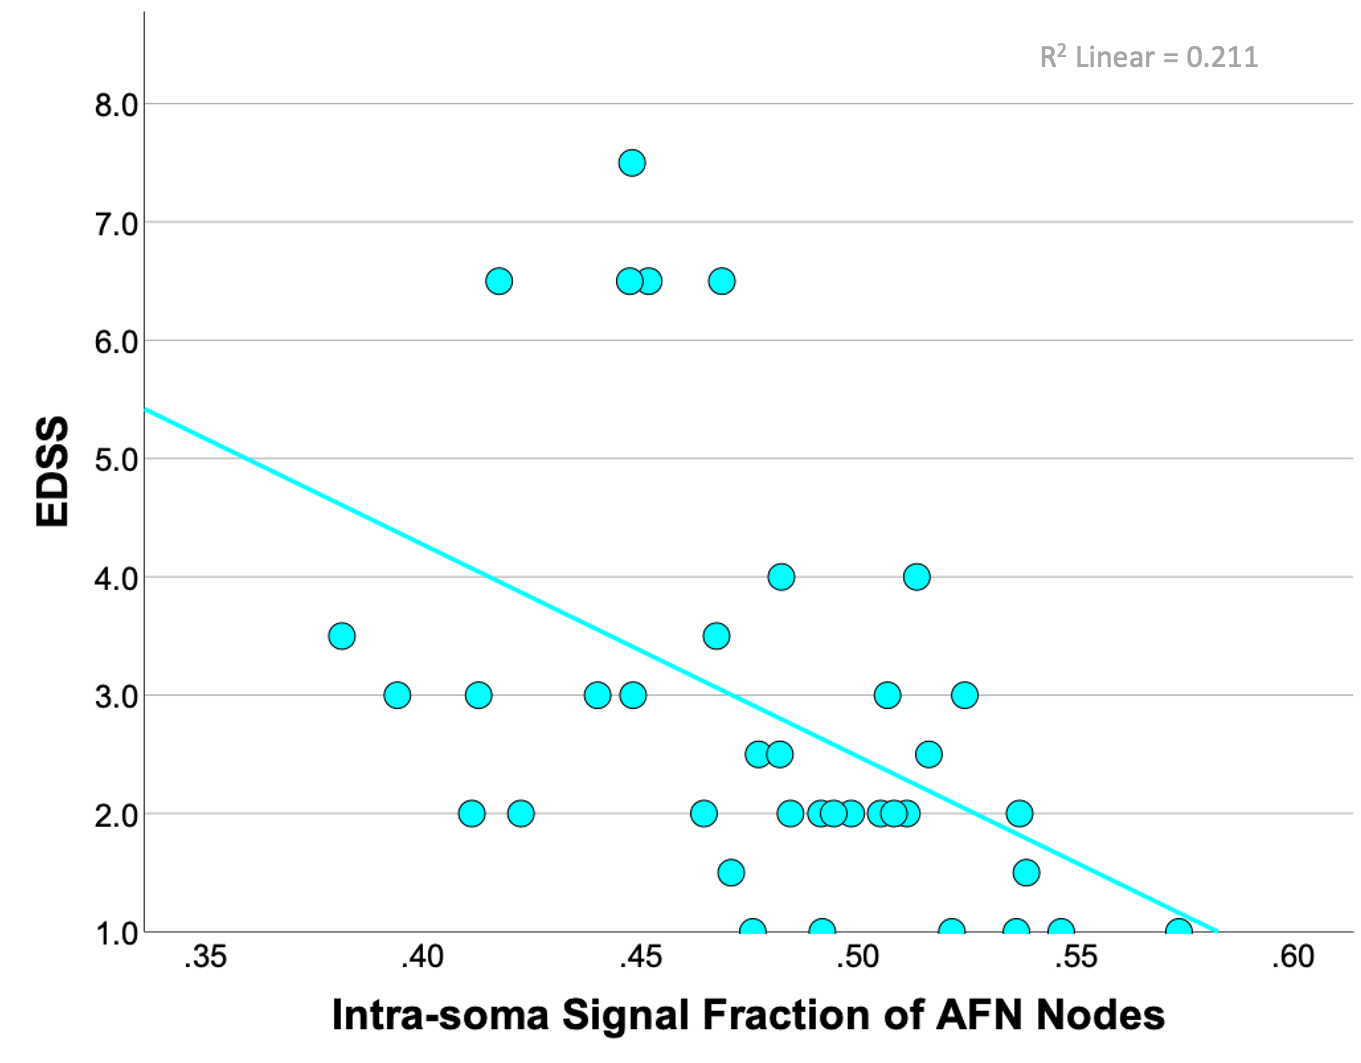
Figure 3. Clinical Correlation of fis and EDSS. Correlations of the EDSS (Expanded Disability Status Scale) and fis of AFN nodes show that cell body density decreases as disease severity worsens (ρ = -0.543, p < 0.001).
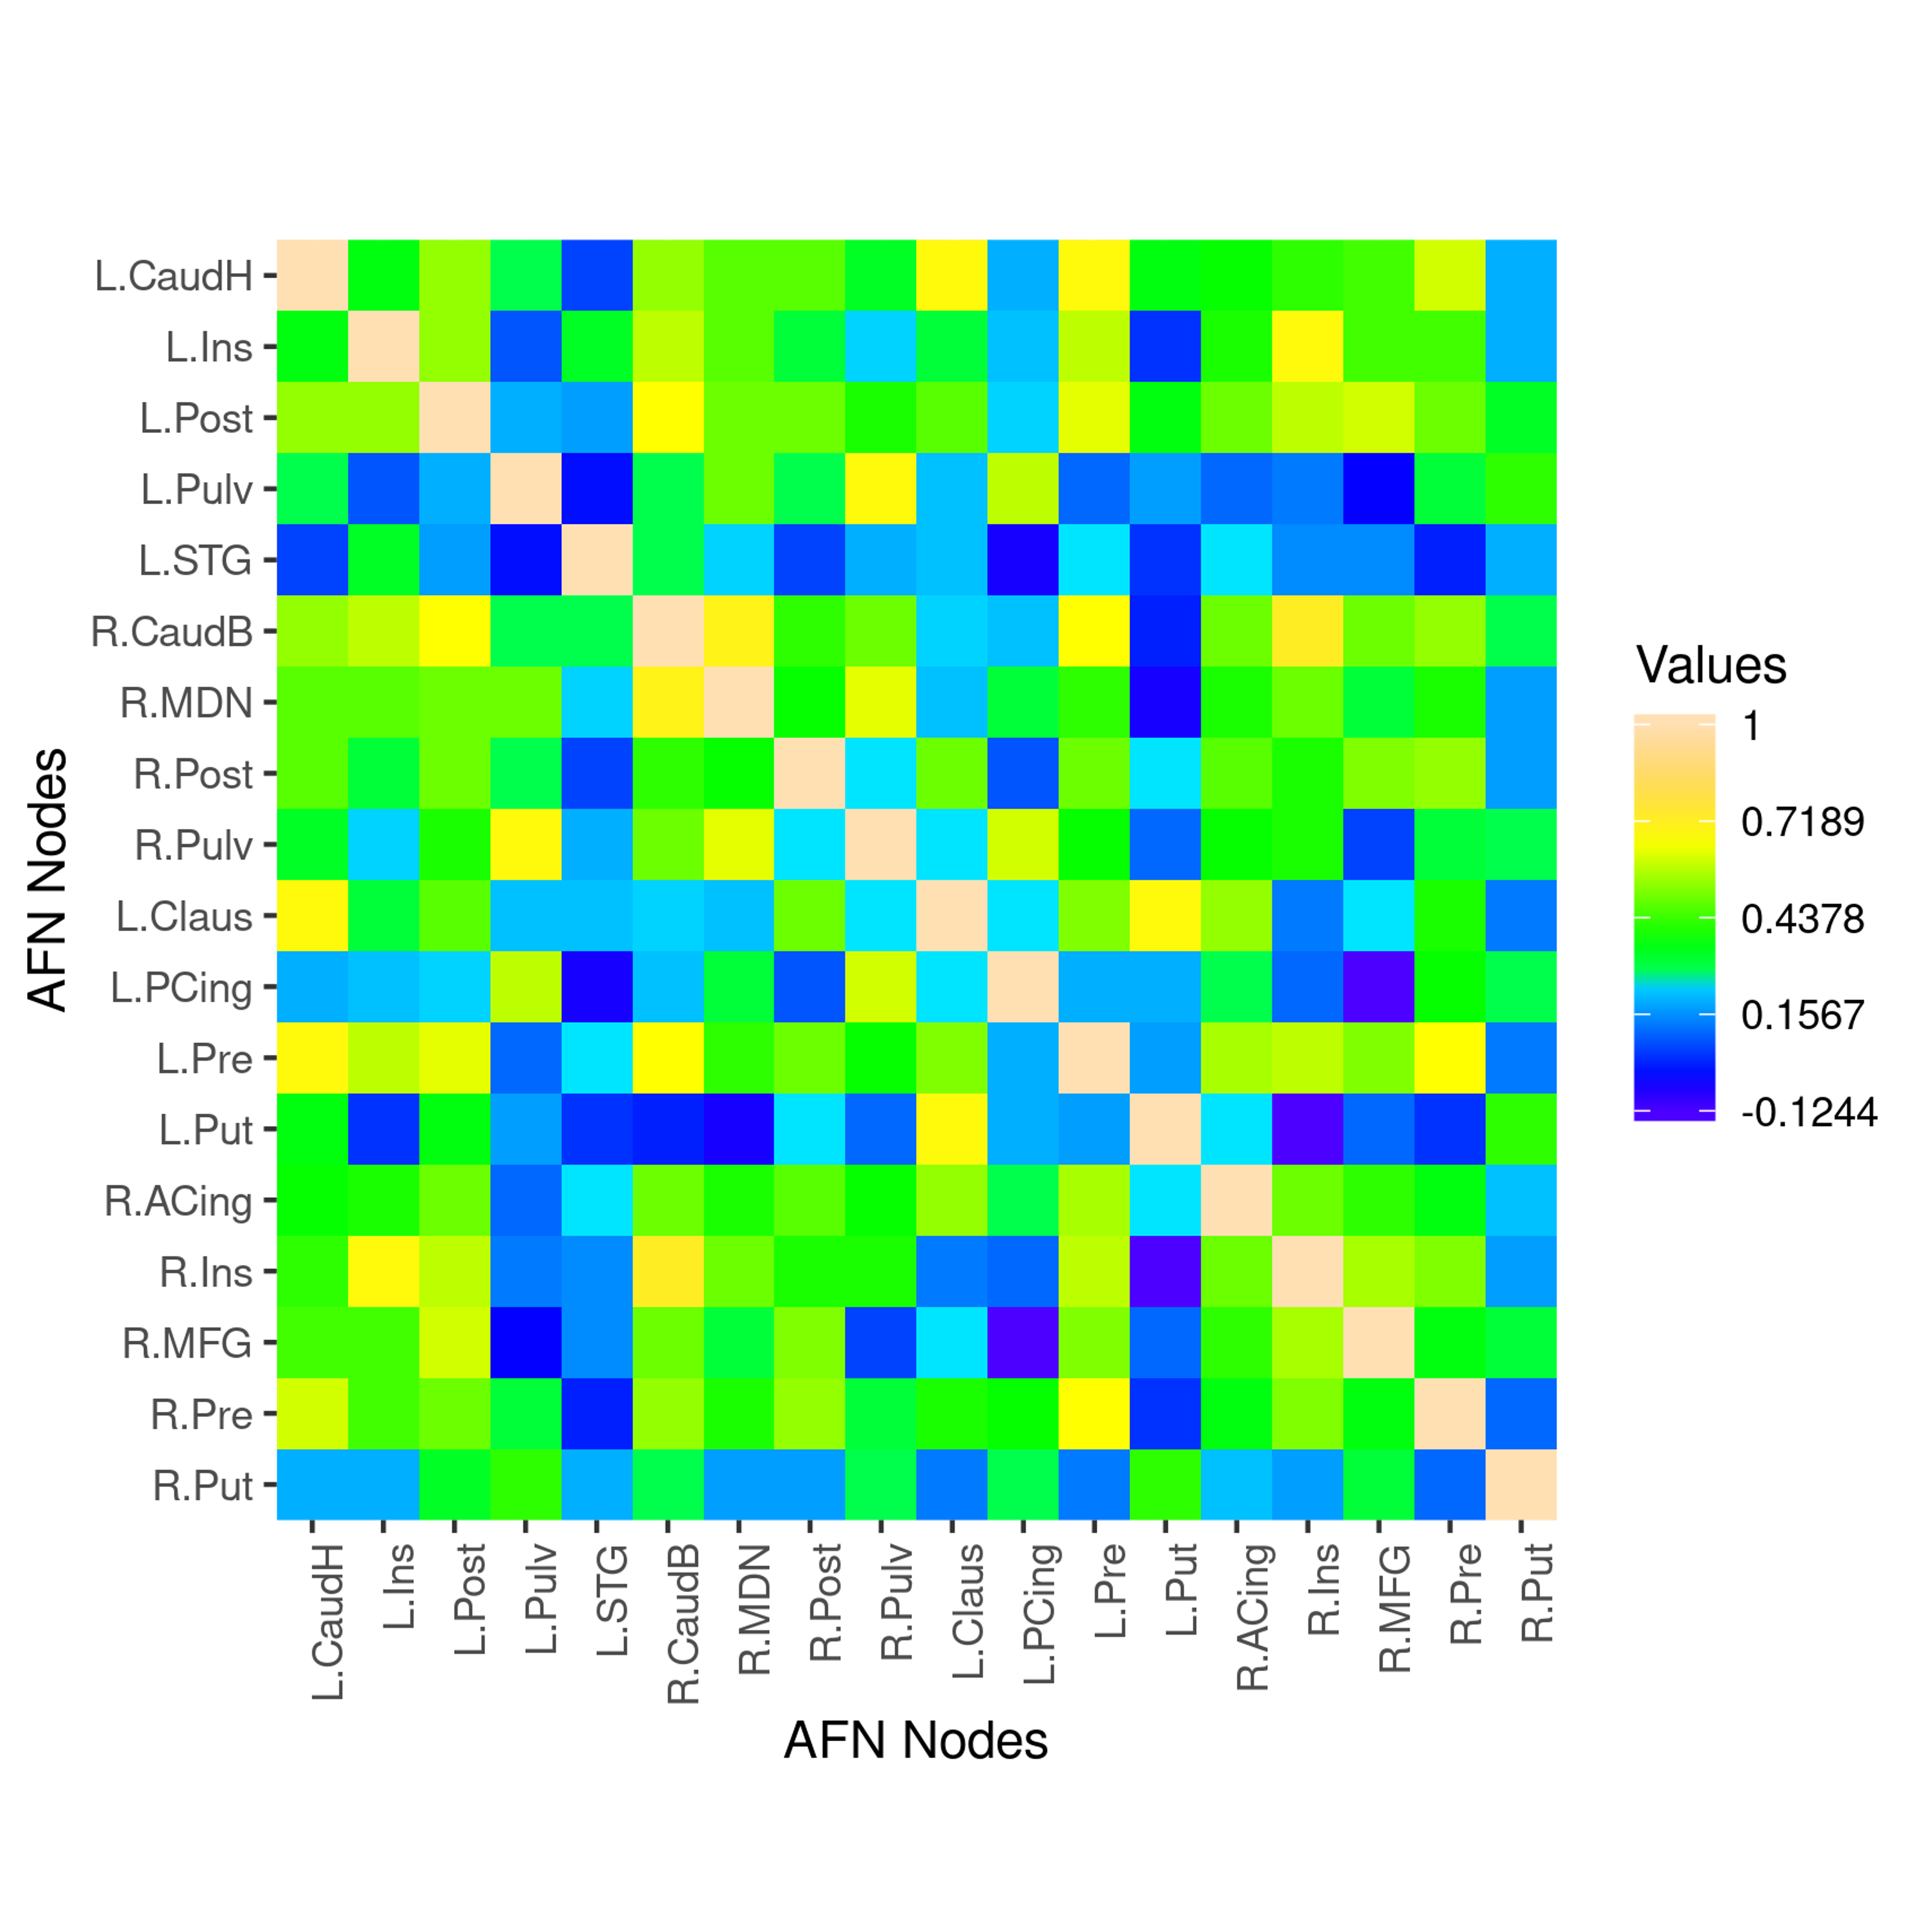
Figure 4. Heatmap of fis between AFN Nodes. Network behavior of microstructural alteration in multiple sclerosis is shown as a correlation matrix with Pearson’s correlation coefficients computed between every nodal pair. Medium to large effect sizes were detected.
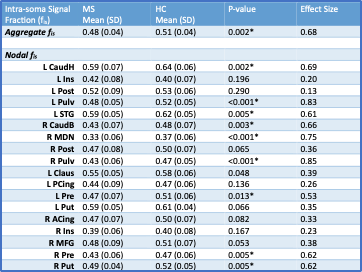
Table. Groupwise Comparisons of fis. Nodes in the AFN model demonstrate decreased cell body density in multiple sclerosis compared to healthy controls for the aggregate nodal average fis and individual nodal average fis. Effect sizes were computed as Hedges’ g. *P-values <0.05 after FDR correction.