0113
Investigation of Human Brain Parabrachial Nucleus (PBN) - Central Amygdala (CeA) Pathway by Diffusion Tractography1Dartmouth Brain Imaging Center, Department of Psychological and Brain Sciences, Dartmouth College, Hanover, NH, United States, 2Department of Psychological and Brain Sciences, Dartmouth College, Hanover, NH, United States
Synopsis
Keywords: Tractography, Brain Connectivity, nociceptive pain pathway, chronic pain, anxiety, Parabrachial nucleus, Center amygdala, ball and sticks model, msmt-csd, probabilistic diffusion tractography
Motivation: The parabrachial nucleus (PBN) to the central amygdala (CeA) is a critical pathway for multiple types of aversive, unconditional threat behaviors including chronic pain states in animals. However, there do not exist connectivity studies on this pathway in the human brain by diffusion tractography.
Goal(s): Study of connectivity between PBN and CeA by diffusion tractography.
Approach: Probabilistic tractography with the ball-and-stick model (FSL) and multi-shell, multi-tissue constrained spherical deconvolution, and fixel-based analysis (MRTRIX).
Results: The study showed the existence of a PBN-CeA pathway in the human brain. Average streamline density of this pathway differs across the subjects while the cross section is comparable.
Impact: This study has discovered that a PBN-CeA pathway exists in both hemispheres of the human brain, which is consistent with our previous functional connectivity study. This finding will open up new avenues of research on fear conditioning, anxiety, and pain.
Introduction
The spinothalamic pathway is commonly considered the main nociceptive (pain-related) pathway1, but in rodents, most nociceptive spinal neurons project to the parabrachial nucleus (PBN)2. PBN neurons that produce calcitonin gene-related peptide (CGRP) project to the central nucleus of the amygdala (CeA), forming a crucial pathway for multiple types of aversive, unconditioned threat behaviors in nonhuman animals, including chronic pain conditions3,4. However, the PBN→CeA pathway has not been definitively identified or extensively studied in humans using diffusion tractography. Previously, we identified functional connectivity between PBN and CeA5. In this study, we used probabilistic diffusion tractography to investigate the pathway between the two regions.Methods
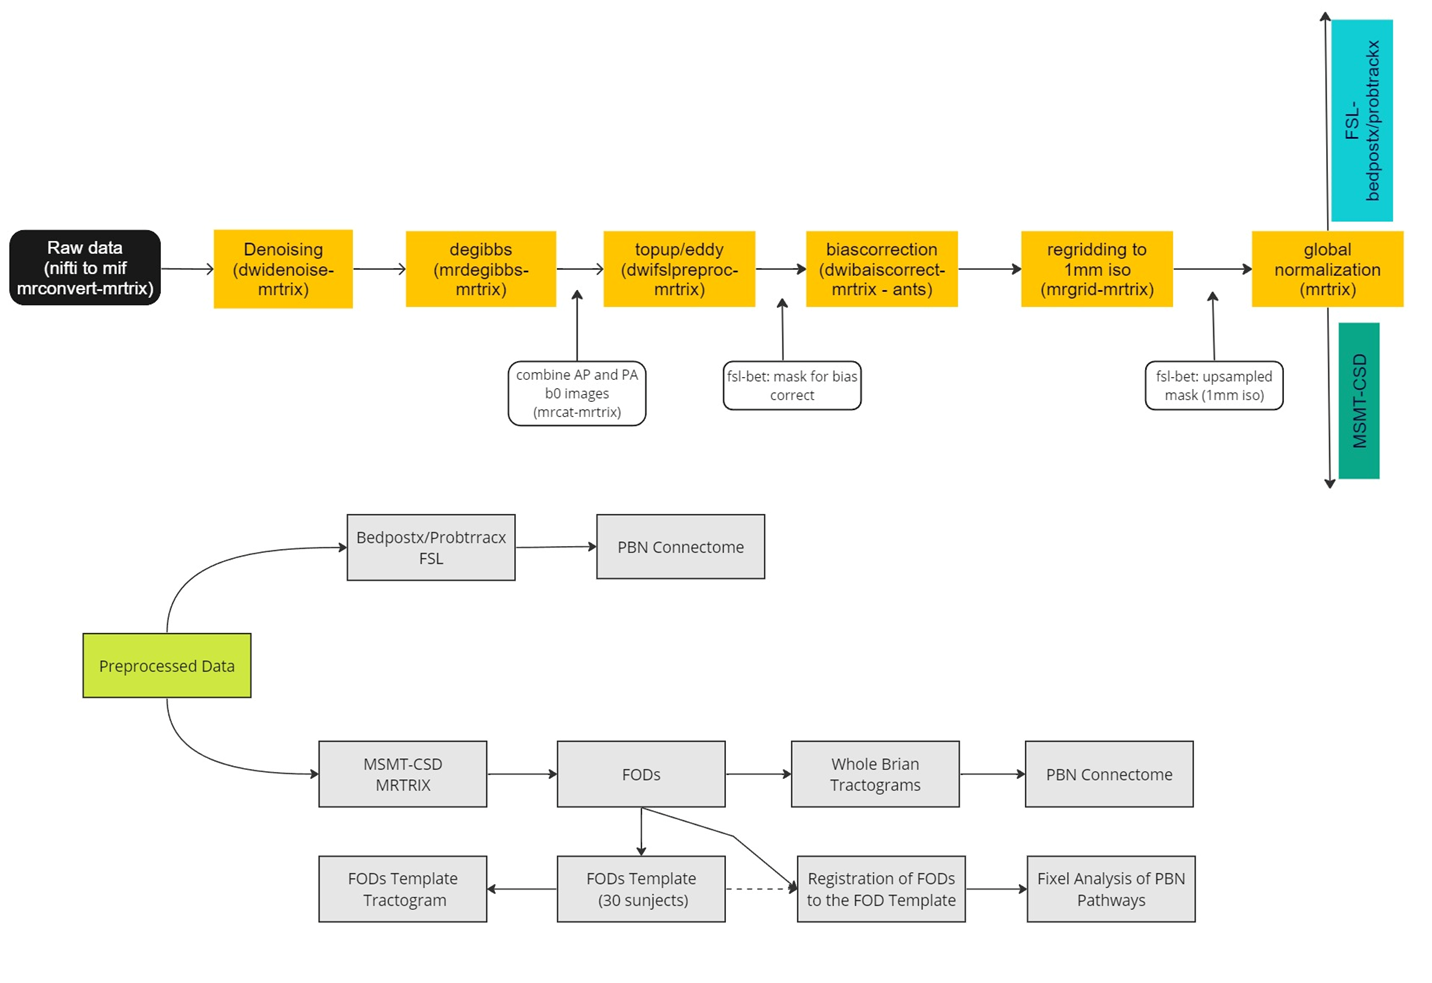
The processing pipeline is shown in Figure 1. The study used two different probabilistic tractography methods to identify the pathway between PBN and CeA. The first method is Bedpostx/Probtrackx tractography, which is based on the ball and sticks multi-tensor model6,7. The second method is based on fiber orientation distribution function (fODF) by multi-shell multi-tissue constrained spherical deconvolution (MSMT-CSD)8,9,10,11. In the abstract, we refer to them as method 1 and method 2.The diffusion data used in the study is multishell with b-values of 0, 500, 1000, 2000, and 3000. There are 96 non-zero diffusion directions, with 6, 15, 15, and 60 directions in each shell, respectively. The acquired 1.7 mm3 isotropic voxel size was resampled to 1 mm3. A total of 98 subjects were included in the study collected on a Siemen Magnetom Prisma 3T MRI scanner at Dartmouth Brain Imaging Center.
Voxel-to-voxel connectivity between PBN, CeA, and the dorsal posterior insula (dpIns) was produced with Bedpostx/Probtrackx (FSL)12,13,14 tractography in the MNI space. MSMT-CSD FODs were produced with MRTRIX15 on the same subjects and whole-brain tractograms were produced in the MNI space to produce a connectome between the above ROIs. The ROIs were extracted from the atlas16,and transformed to the analysis spaces as needed.
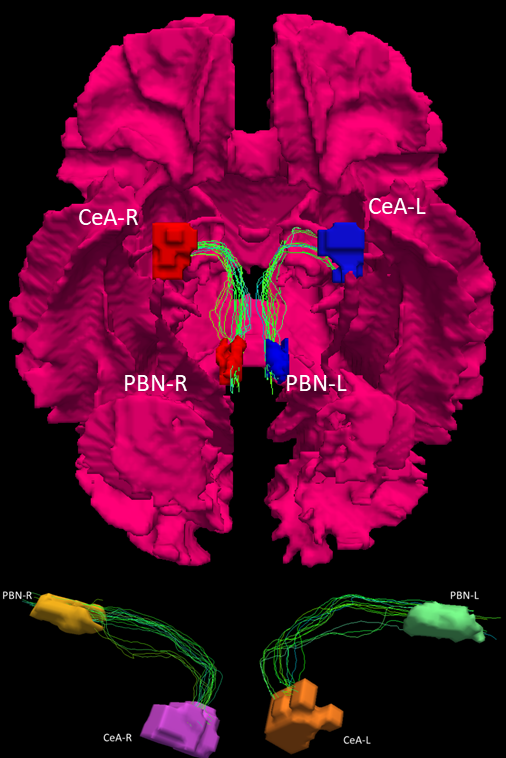
A FOD template was created using the first 30 subjects and individual FODs were transformed to the FOD template for fixel-based analysis17,18. A whole brain tractogram was created on the FOD template and fixel masks were generated on the PBN-CeA pathways extracted from the tractogram (Figure 4). These two fixel masks were then used to extract mean of steamline density (FD), mean of streamline cross section (FC), and mean of streamline density and cross-section (FDC) of the pathway from individual subjects. The PBN-dpIns pathway was used as an off-target pathway for comparison.
Results
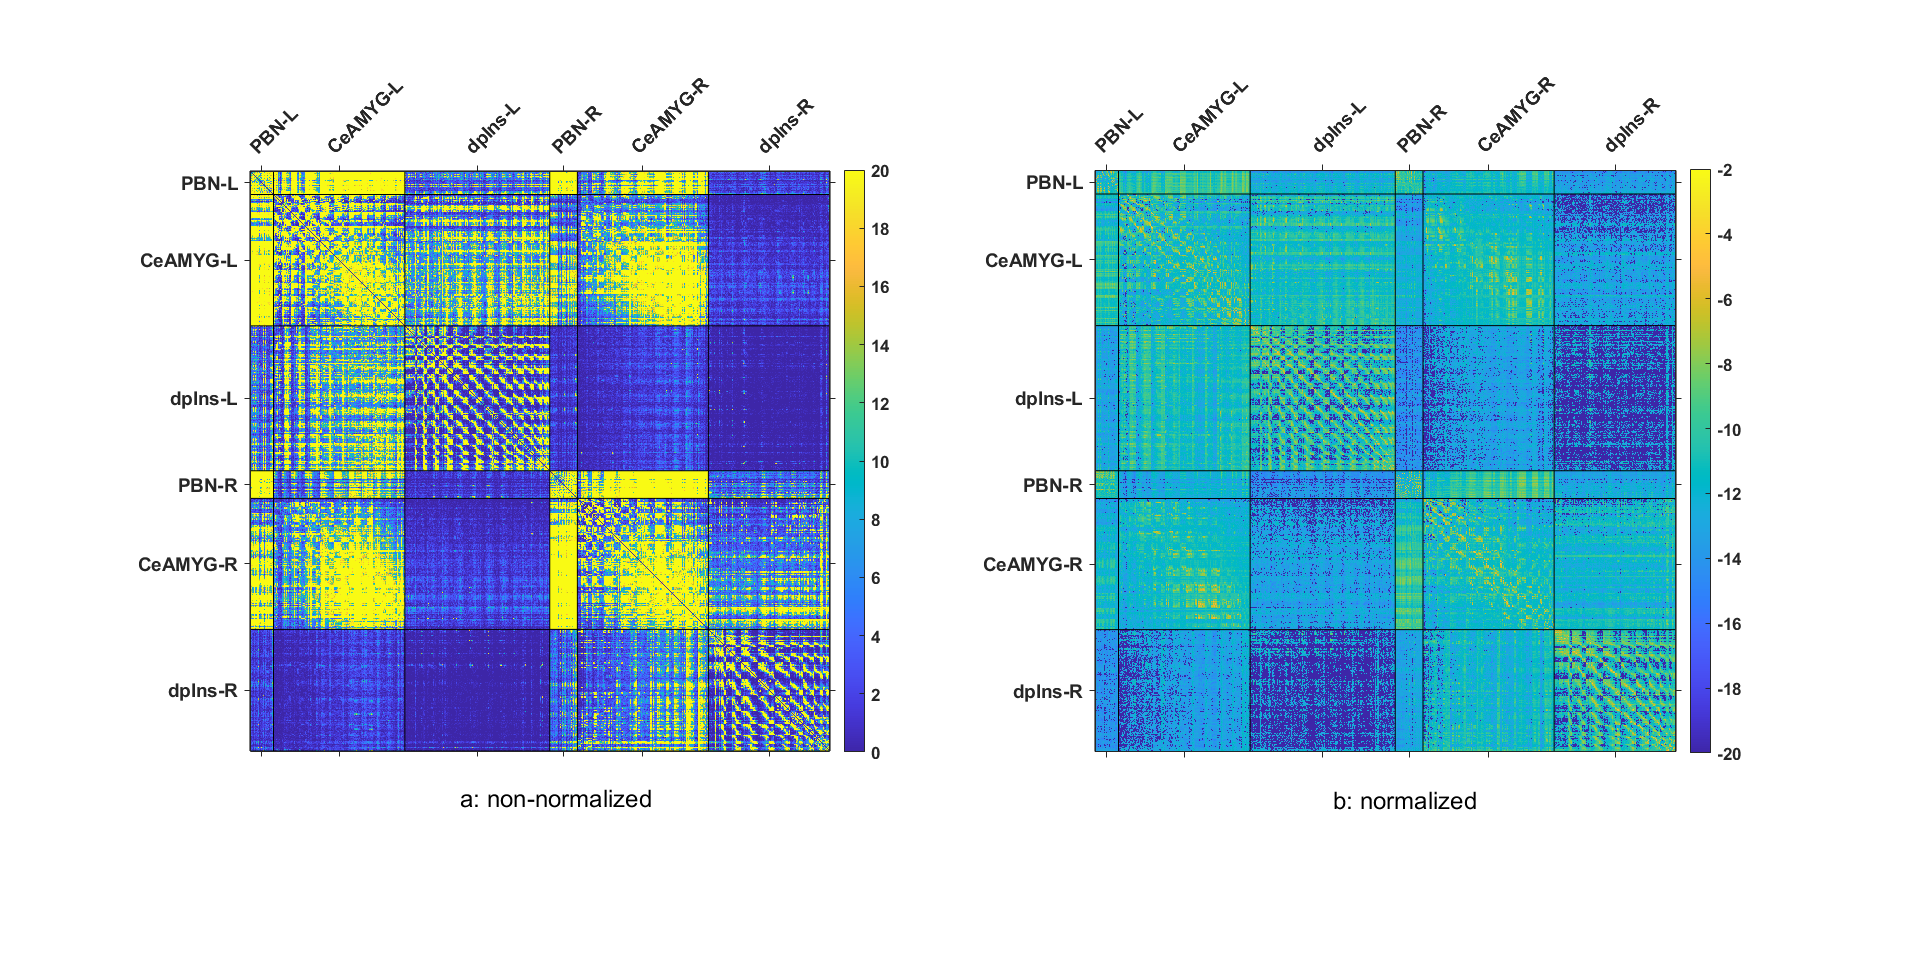
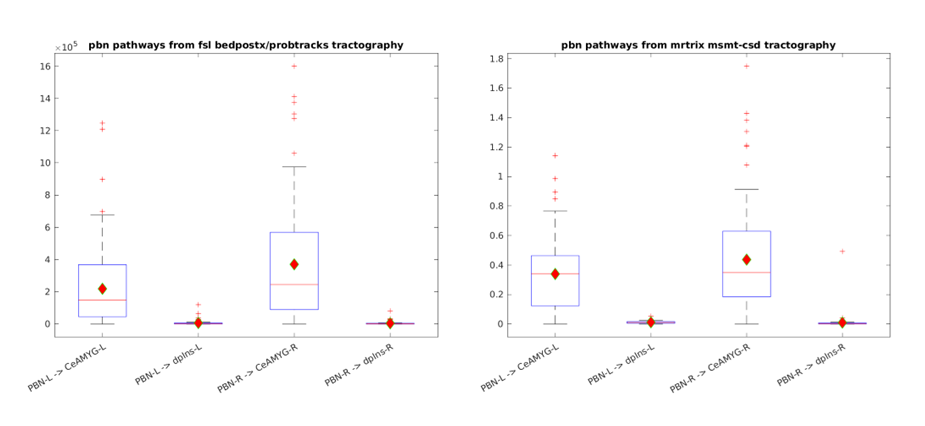
The connectivity matrix from method 1 shows more connections between PBN and CeA (on-target) than connections between PBN and dpIns (the off-target) on both sides of the brain. This is also evident in the normalized connections19 from method 1, which does not change the overall information (Figure 2).Both method 1 and method 2 show streamline connections between PBN and CeA that are significantly more than those between PBN and dpIns (Figure 3) (method 1: t = 8.74, p = 9.9920e-16 for PBN-L-CeA-L and t=9.95, p = 0 for PBN-R - CeA-R; method 2: t = 12.79, p = 0 for PBN-L-CeA-L and t = 11.93, p = 0 for PBN-R-CeA-R). Figure 4 shows the streamlines extracted from the tractogram which was generated from the FODs template, providing visual evidence of the existence of the PBN-CeA pathway.
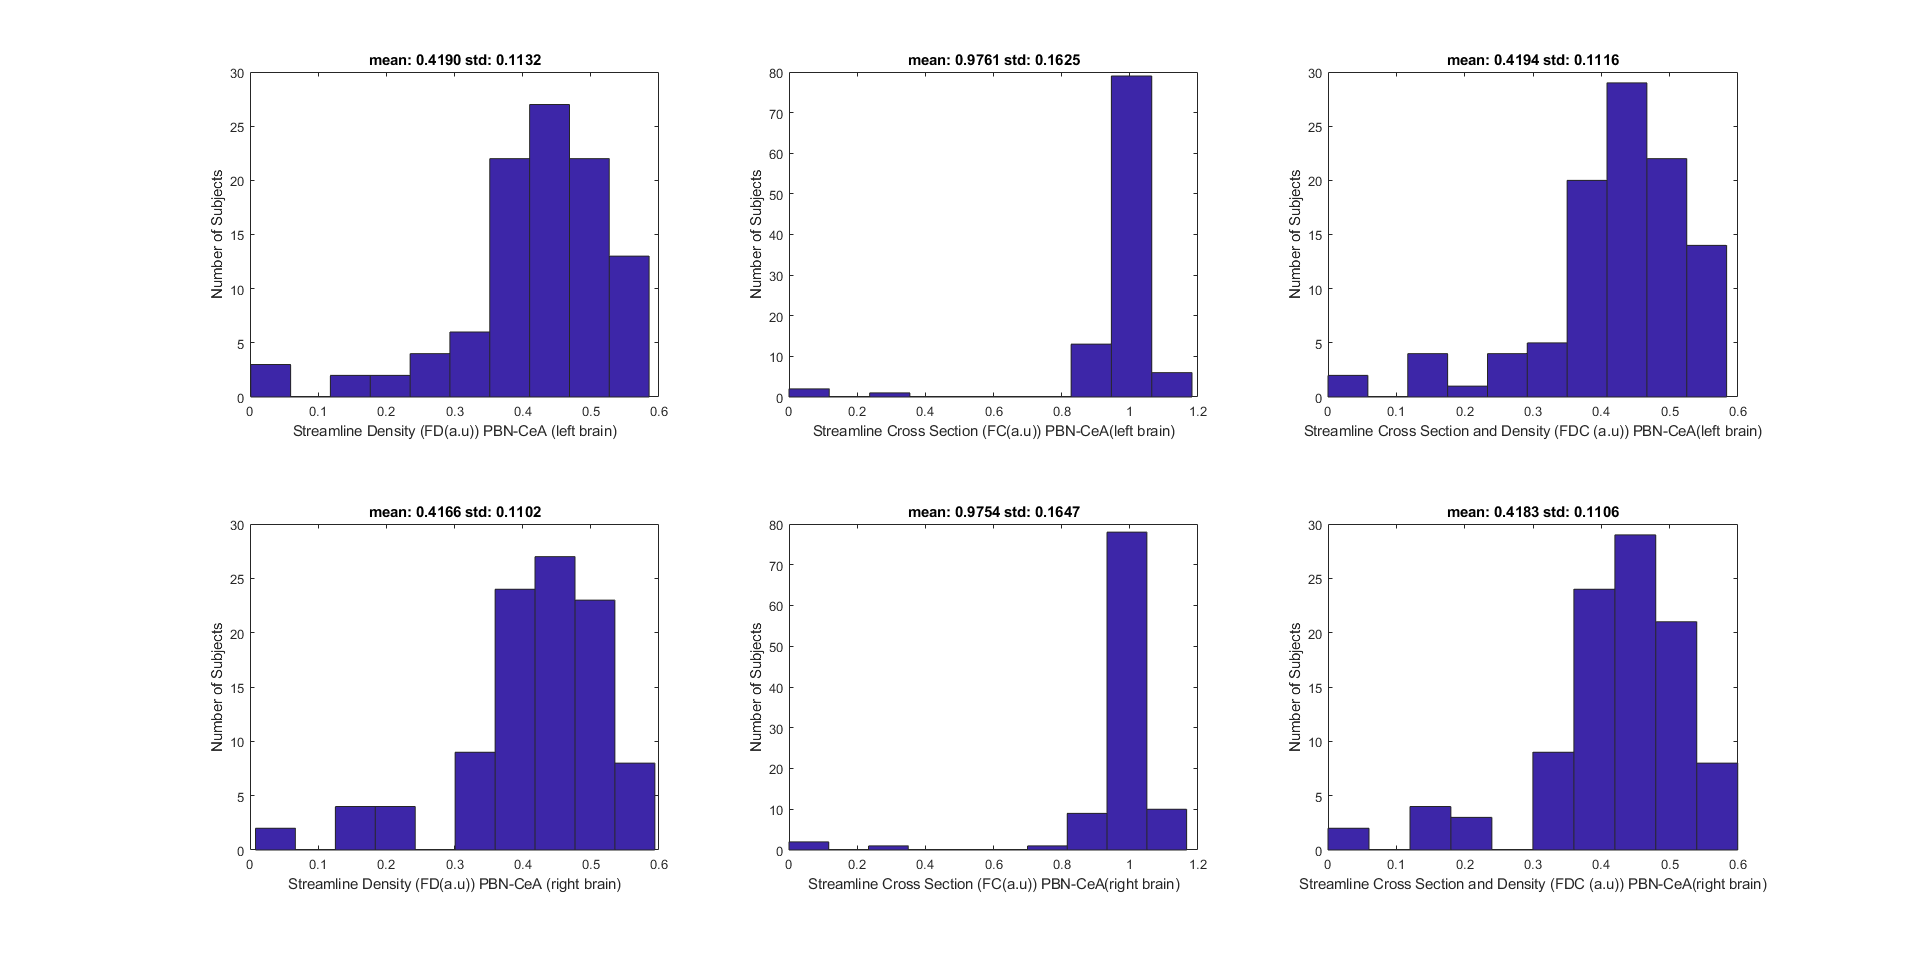
Streamline densities from fixel-based analysis have an approximately normal distribution, whereas streamline cross sections are concentrated around 1 (Figure 5).
Discussion
Overall, the findings from both method 1 and method 2 support the existence of a PBN-CeA pathway on both sides of the brain. This connection is likely involved in mediating the effects of the PBN on the CeA, which plays a role in a variety of functions, including fear conditioning, anxiety, and pain.Individuals have more or less the same average cross section of this pathway while the average density differs across the subjects. It would be interesting to look into individual differences in terms of streamline densities and demographics of the subjects.Conclusion
Both methods found that a PBN-CeA pathway exists in both sides of the human brain. The streamline density of the pathway differs across the subjects while the streamline cross section is comparable. The next step of the study will be to correlate individual differences to demographics.Acknowledgements
Research reported in this publication was supported by the National Institutes of Health (NIH) under award number R01 EB026549 .References
1. Kandel, E. R., Schwartz, J. H., Jessell, T. M., Siegelbaum, S., Hudspeth, A. J., & Mack, S. (Eds.). Principles of neural science. 2000: (Vol. 4, pp. 1227-1246). New York: McGraw-hill.
2. Todd, A. J. Neuronal circuitry for pain processing in the dorsal horn. Nature Reviews Neuroscience, 2010:11(12), 823-836.
3. Campos, C. A., Bowen, A. J., Roman, C. W., & Palmiter, R. D. Encoding of danger by parabrachial CGRP neurons. Nature, 2018:555(7698), 617-622.
4. Palmiter, R. D. The parabrachial nucleus: CGRP neurons function as a general alarm. Trends in neurosciences, 2018:41(5), 280-293.
5. Byeol Kim, Philip A. Kragel, Marta Čeko, Jordan Theriault, Danlei Chen, Ajay B. Satpute, Lawrence L. Wad, Martin A. Lindquist, Lisa Feldman Barrett and Tor D. Wager, Identification of a human parabrachial-amygdala pathway with 7T fMRI, SfN abstract 2022 (5540).
6. T.E.J. Behrens, M.W. Woolrich, M. Jenkinson, H. Johansen-Berg, R.G. Nunes, S. Clare, P.M. Mathews, J.M. Brady, and S.M. Smith. Characterization and Propagation of Uncertainty in Diffusion-Weighted MR Imaging. Magnetic Resonance in Medicine 50:1077–1088 (2003).
7. T.E.J. Behrens, H. Johansen Berg, S. Jbabdi, M.F.S. Rushworth, and M.W. Woolrich. Probabilistic diffusion tractography with multiple fibre orientations: What can we gain?. NeuroImage 34 (2007) 144–155.
8. Maxime Descoteaux, Rachid Deriche, Thomas R. Knosche, and Alfred Anwander. Deterministic and Probabilistic Tractography Based on Complex Fibre Orientation Distributions. IEEE TRANSACTIONS ON MEDICAL IMAGING, VOL. 28, NO. 2, FEBRUARY 2009.
9. Tournier, J.D., Calamante, F., Gadian, D., Connelly, A., 2004. Direct estimation of the fiberorientation density function from diffusion-weighted MRI data using sphericaldeconvolution. NeuroImage 23, 1176–1185.
10. Tournier, J.D., Calamante, F., Connelly, A., 2007. Robust determination of the fibre orientation distribution in diffusion MRI: non-negativity constrained super-resolvedspherical deconvolution. NeuroImage 35, 1459–1472.
11. Ben Jeurissen, Jacques-Donald Tournier, Thijs Dhollander, Alan Connelly, and Jan Sijbers. Multi-tissue constrained spherical deconvolution for improved analysis of multi-shell diffusion MRI data. NeuroImage103(2014)411–426.
12. M.W. Woolrich, S. Jbabdi, B. Patenaude, M. Chappell, S. Makni, T. Behrens, C. Beckmann, M. Jenkinson, S.M. Smith. Bayesian analysis of neuroimaging data in FSL. NeuroImage, 45:S173-86, 2009.
13. S.M. Smith, M. Jenkinson, M.W. Woolrich, C.F. Beckmann, T.E.J. Behrens, H. Johansen-Berg, P.R. Bannister, M. De Luca, I. Drobnjak, D.E. Flitney, R. Niazy, J. Saunders, J. Vickers, Y. Zhang, N. De Stefano, J.M. Brady, and P.M. Matthews. Advances in functional and structural MR image analysis and implementation as FSL. NeuroImage, 23(S1):208-19, 2004.
14. M. Jenkinson, C.F. Beckmann, T.E. Behrens, M.W. Woolrich, S.M. Smith. FSL. NeuroImage, 62:782-90, 2012.
15. J.-D. Tournier, R. E. Smith, D. Raffelt, R. Tabbara, T. Dhollander, M. Pietsch, D. Christiaens, B. Jeurissen, C.-H. Yeh, and A. Connelly. MRtrix3: A fast, flexible and open software framework for medical image processing and visualisation. NeuroImage, 202 (2019), pp. 116–37.
16. Bianciardi, M., Na, Y., Satizabal, I. M., & Morcom, A. (2015). In vivo human brainstem atlas derived from multi-contrast MRI. Brain connectivity, 5(5), 269-280.
17. David Raffelt, J-Donald Tournier, Jurgen Fripp, Stuart Crozier, Alan Connelly, and Olivier Salvado. Symmetric diffeomorphic registration of fibre orientation distributions. NeuroImage56(2011)1171–1180.
18. David A Raffelt, Robert E. Smith, Gerard R Ridgway, J-Donald Tournier, David N Vaughan, Stephen Rose, Robert Henderson, and Alan Connelly. Connectivity-based fixel enhancement: Whole-brain statistical analysis of diffusion MRI measures in the presence of crossing fibres. Neuroimage. 2015 Aug 15; 117: 40–55.
19. Burke Q. Rosen, and Eric Halgren. A Whole-Cortex Probabilistic Diffusion Tractography Connectome. https://doi.org/10.1523/ENEURO.0416-20.2020
Figures