0110
Quantifying Cervical Spinal Cord Pathology of Multiple Sclerosis Using Oscillating Gradient Spin-echo DWI1Center for Biomedical Imaging Research, Department of Biomedical Engineering, Tsinghua University, Beijing, China, 2Center for Nano and Micro Mechanics, Department of Engineering Mechanics, Tsinghua University, Beijing, China, 3Department of Neurology, Yuquan Hospital, School of Clinical Medicine, Tsinghua University, Beijing, China, 4MR Research Collaboration Team, Siemens Healthineers Ltd., Beijing, China, 5Institute of Imaging Science, Vanderbilt University Medical Center, Nashville, TN, United States, 6Department of Radiology and Radiological Sciences, Vanderbilt University Medical Center, Nashville, TN, United States, 7Department of Physics and Astronomy, Vanderbilt University, Nashville, TN, United States
Synopsis
Keywords: Microstructure, Diffusion Tensor Imaging, oscillating gradient, diffusion time, spinal cord, multiple sclerosis
Motivation: Spinal cord MRI has both diagnostic and prognostic value for multiple sclerosis (MS) patients. Several quantitative MRI biomarkers show high sensitivity to characterize MS lesions but lack pathological specificity. Time-dependent DWI may reveal microstructural features and pathological variations in MS.
Goal(s): To explore diffusion time-dependence in the cervical spinal cord and its potential to quantify pathology of MS
Approach: Optimized oscillating gradient spin-echo (OGSE) DTI were performed for healthy volunteers (N=18) and MS patients (N=17).
Results: Diffusivities show time-dependence in the dorsal-columns and lateral-funiculis of healthy controls. The increase of RD in MS lesions is larger than healthy WM when diffusion time decreases.
Impact: The time-dependence of diffusivities in the cervical spinal cord of healthy volunteers and MS patients are observed using optimized OGSE DWI sequences on a clinical scanner. This may reveal further insight into the microstructural differences and pathological variations in MS.
Introduction
Spinal cord MRI has been proven to play a vital role in both diagnosis and prognosis of MS patients 1,2. Various quantitative MRI techniques, such as T1 and T2 relaxometry, MT-based approaches and DWI, can provide potential biomarkers to characterize MS lesions with high sensitivity 3,4. However, the pathological specificity of these biomarkers is low. Time-dependent DWI 5 may reveal further insight into microstructural features of fiber bundles in the spinal cord and thus improve the specificity.Oscillating gradient spin-echo (OGSE) provides an access to shorter diffusion times (tdiff), enabling higher sensitivity to mesoscopic microstructures. Currently, OGSE are mostly applied to the brain for human neuroimaging studies 6. OGSE DWI of the spinal cord is limited partly due to the prolonged gradient durations and consequently longer TE, lower SNR. This is further limited by physiological motions, small transverse size of the spinal cord.
In this study, we optimized the oscillating diffusion encoding gradients and adopted ZOOMit excitation for OGSE DWI of the cervical spinal cord to achieve higher in-plane resolution and reduced distortions. The diffusion time-dependence of white matter (WM) in the spinal cord of both healthy volunteers (N=18) and MS patients (N=17) was investigated.
Methods
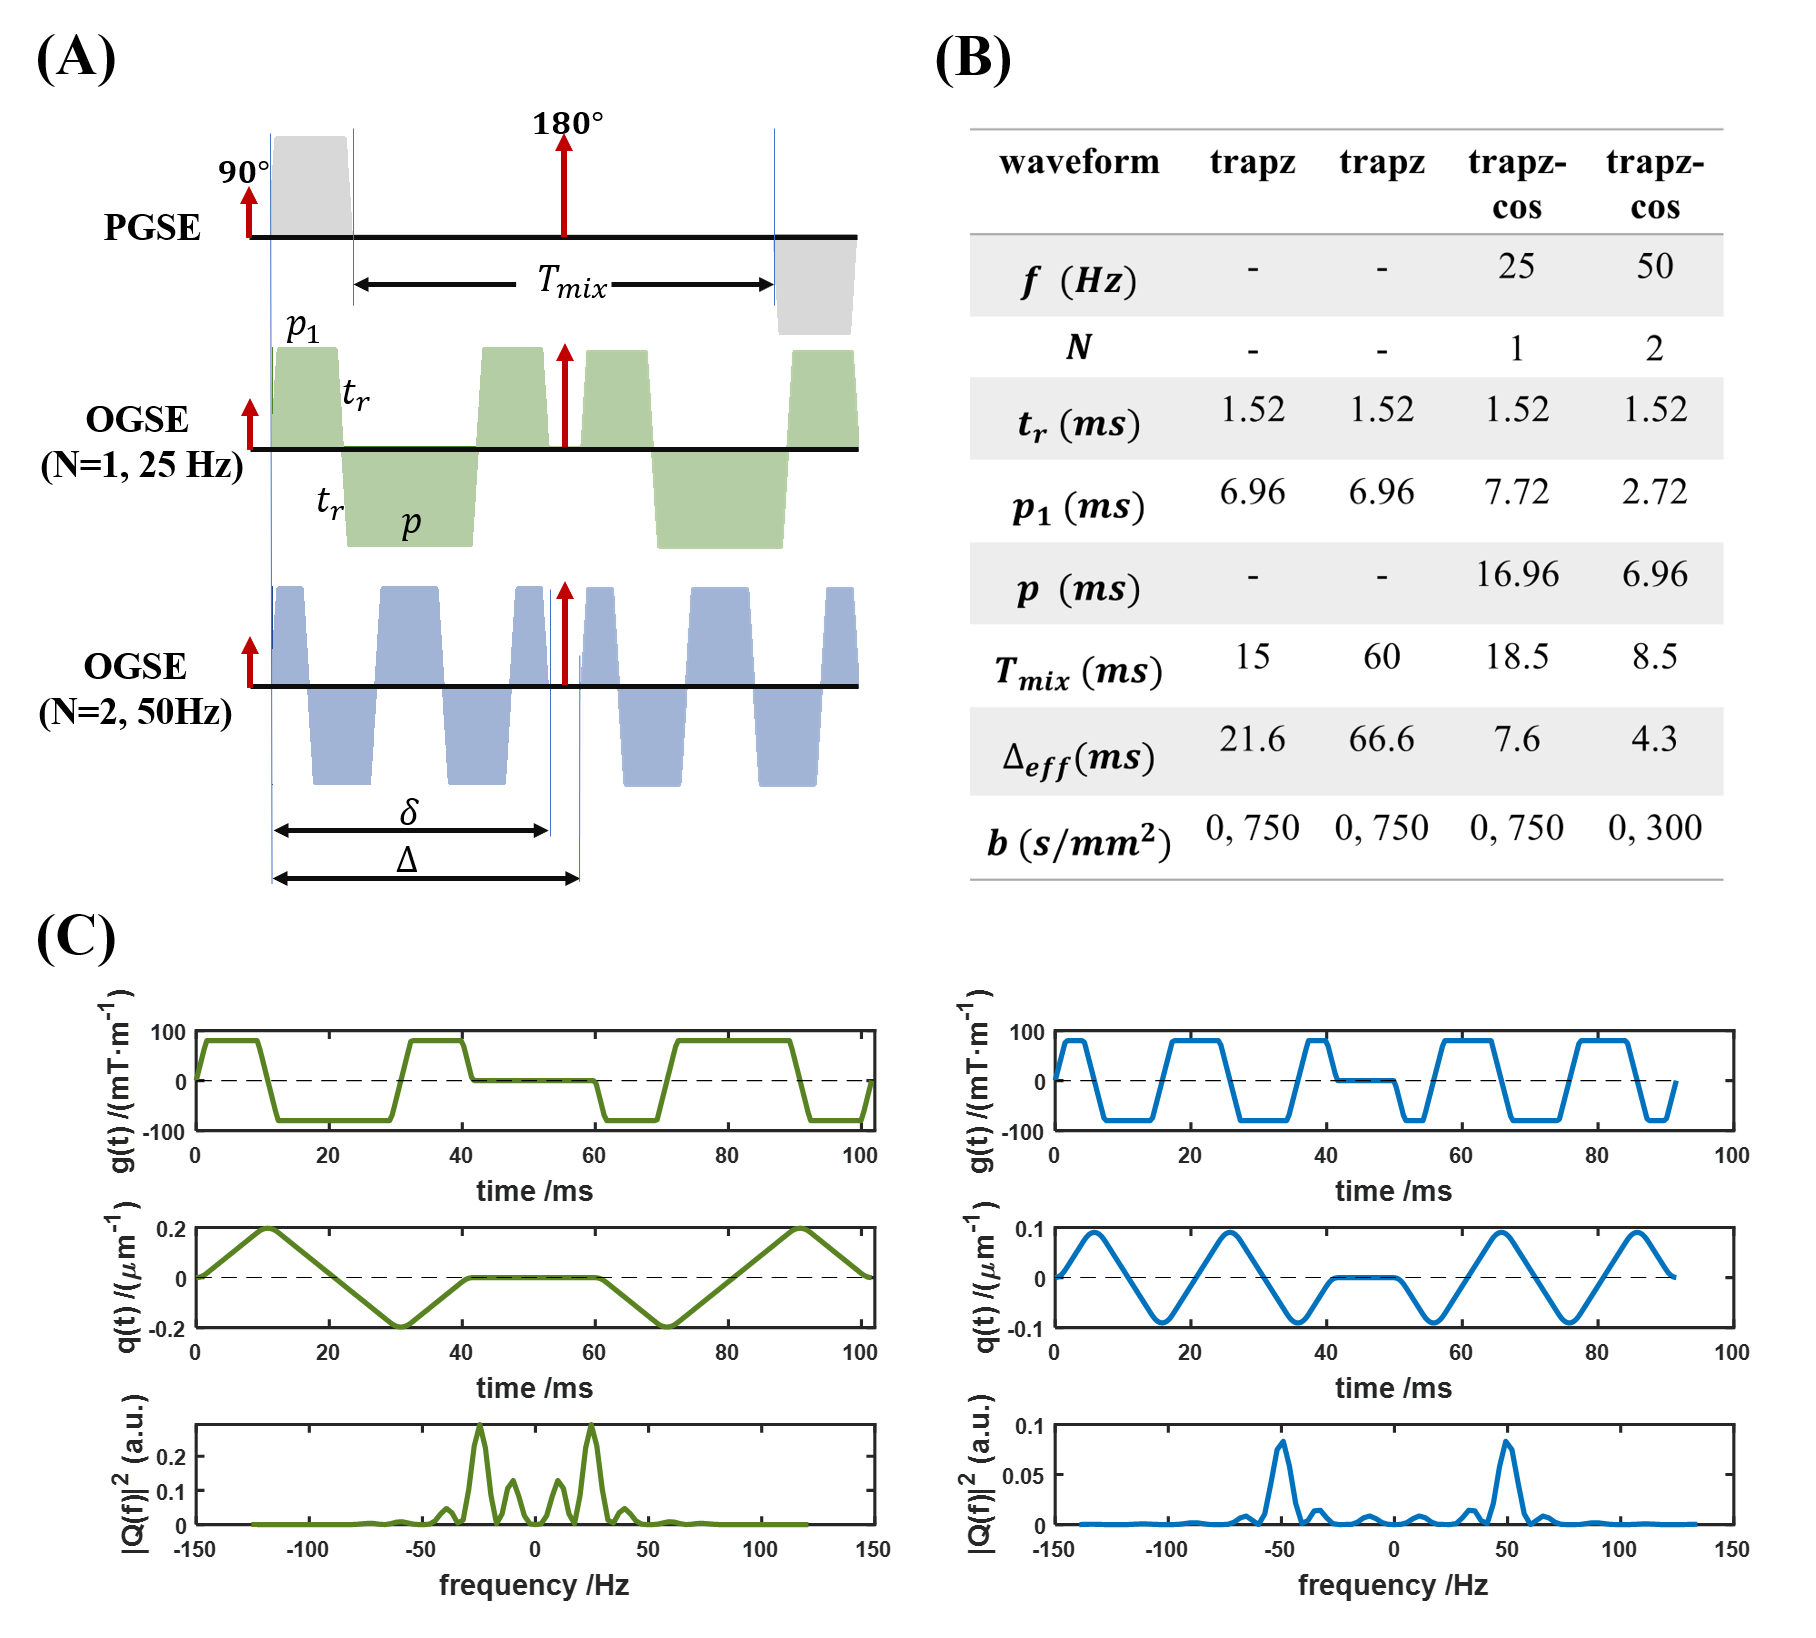
Waveform SimulationTrapezoid-cosine oscillating gradient waveforms were optimized through simulations to achieve good frequency selectivity (Fig.1A). Key parameters including mixing time, gradient polarity, gradient duration were tuned according to previous studies 7. Note that the effective diffusion time (Δeff) for OGSE is calculated as following 8:
$$\Delta_{\mathrm{eff}}=\frac{2\left(t_r+p_1\right)}{3}+t_r-\frac{t_r{ }^2}{6\left(t_r+p_1\right)}+\frac{t_r{ }^3}{60\left(t_r+p_1\right)^2}+\frac{t_r{ }^3}{60 N\left(t_r+p_1\right)^2}$$
Data Acquisition
All experiments were performed on a Siemens Magnetom 3T Prisma scanner (Siemens, Erlangen, Germany) using the commercial 64-channel head/neck coil. Eighteen healthy volunteers (29.7±10.9 yrs) and seventeen MS patients (38.2±12.3 yrs, EDSS median 3.2 (mean±std, 3.7±2.0)) were recruited. This study was approved by the local Institutional Review Board. Written informed consent was obtained from each participant.
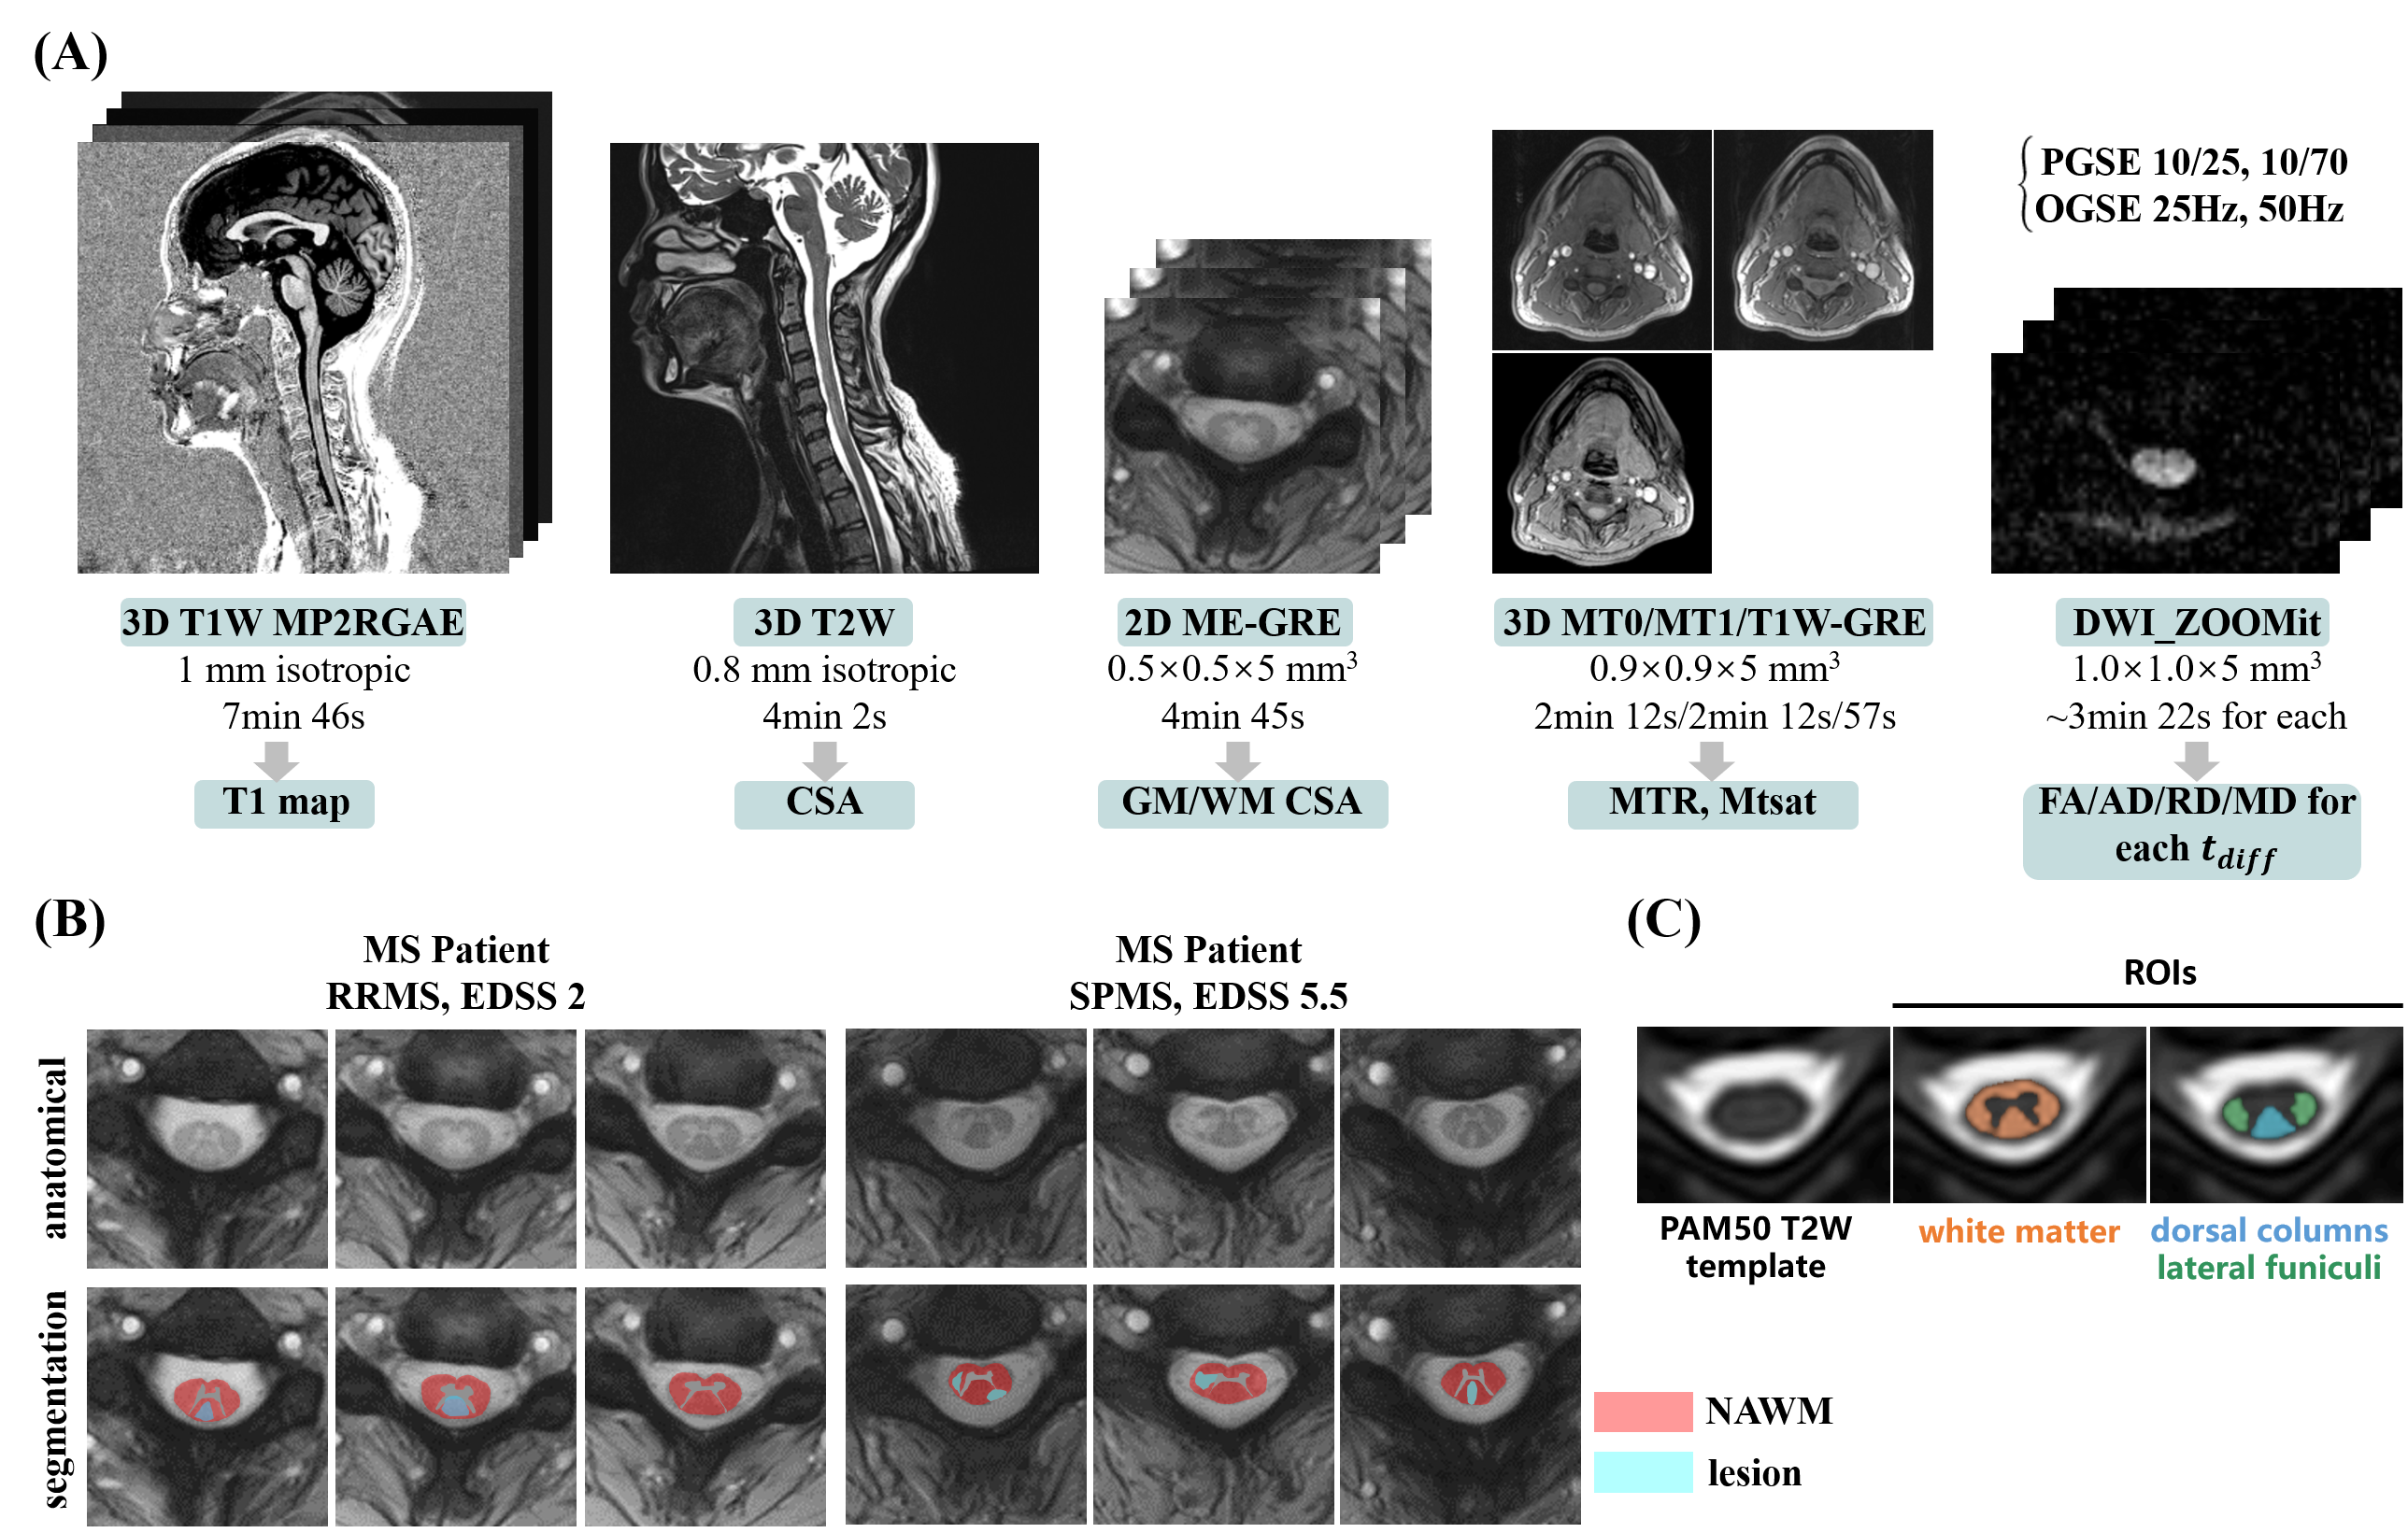
The detailed qMRI scan protocol is shown in Fig.2A. Particularly, PPU-triggered DWI with ZOOMit centered at C3/4 under different tdiff and 3D T1W MP2RAGE are added to the recommended qMRI protocol 9. The obtained quantitative MRI metrics include T1, MTR, MTsat, cross-sectional area (CSA) values and DTI metrics at different tdiff. The parameters of PGSE and 25Hz, 50Hz OGSE are listed in Fig.1B. TE/TRs of PGSE and OGSE are the same.
Data Processing
The anatomical images were processed automatically using Spinal Cord Toolbox (SCT) 10. DWI data were firstly denoised using MPPCA method 11,12 in MRTrix3 13. Then motion correction, segmentation, co-registration to the anatomical ME-GRE or PAM50 altas templates and computation of DTI metrics were sequentially performed using SCT. Additionally, the tract-specific metrics of the healthy volunteers are also extracted, including the whole WM, dorsal columns (DC) and lateral funiculis (LF).
MS lesions were defined and manually delineated on the ME-GRE images with guidance of the T1 map. Normal appearing white matter (NAWM) was defined as the area of segmented WM excluding manually drawn lesion voxels.
Typical examples of lesion segmentation and ROI labeling are shown in Fig.2B and Fig.2C.
Results and Discussion
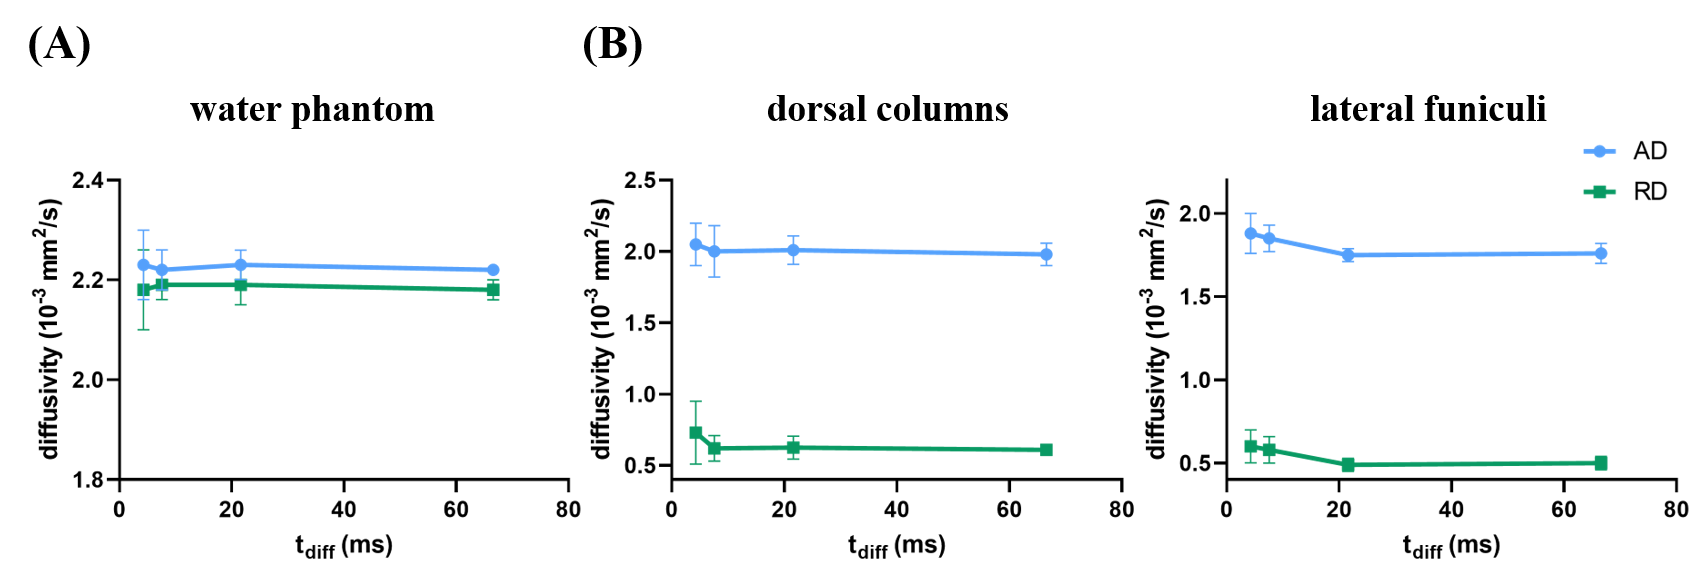
The simulation results of oscillating gradient with optimized parameters are shown in Fig.1C. The power spectrums demonstrate single frequency peak with minimized side lobes and acceptable main lobe FHMW.Fig.3 demonstrates the time-dependence of diffusivities. In the water phantom, no significant variation of measured mean AD and RD values is found. In contrast, obvious variations of AD and RD values are observed with respect to the effective tdiff in DC and LF of the healthy volunteers. However, the variation of measured diffusivities in the whole WM is smaller (not shown here). This indicates the capability of OGSE with short tdiff to probe microstructural features in the spinal cord.
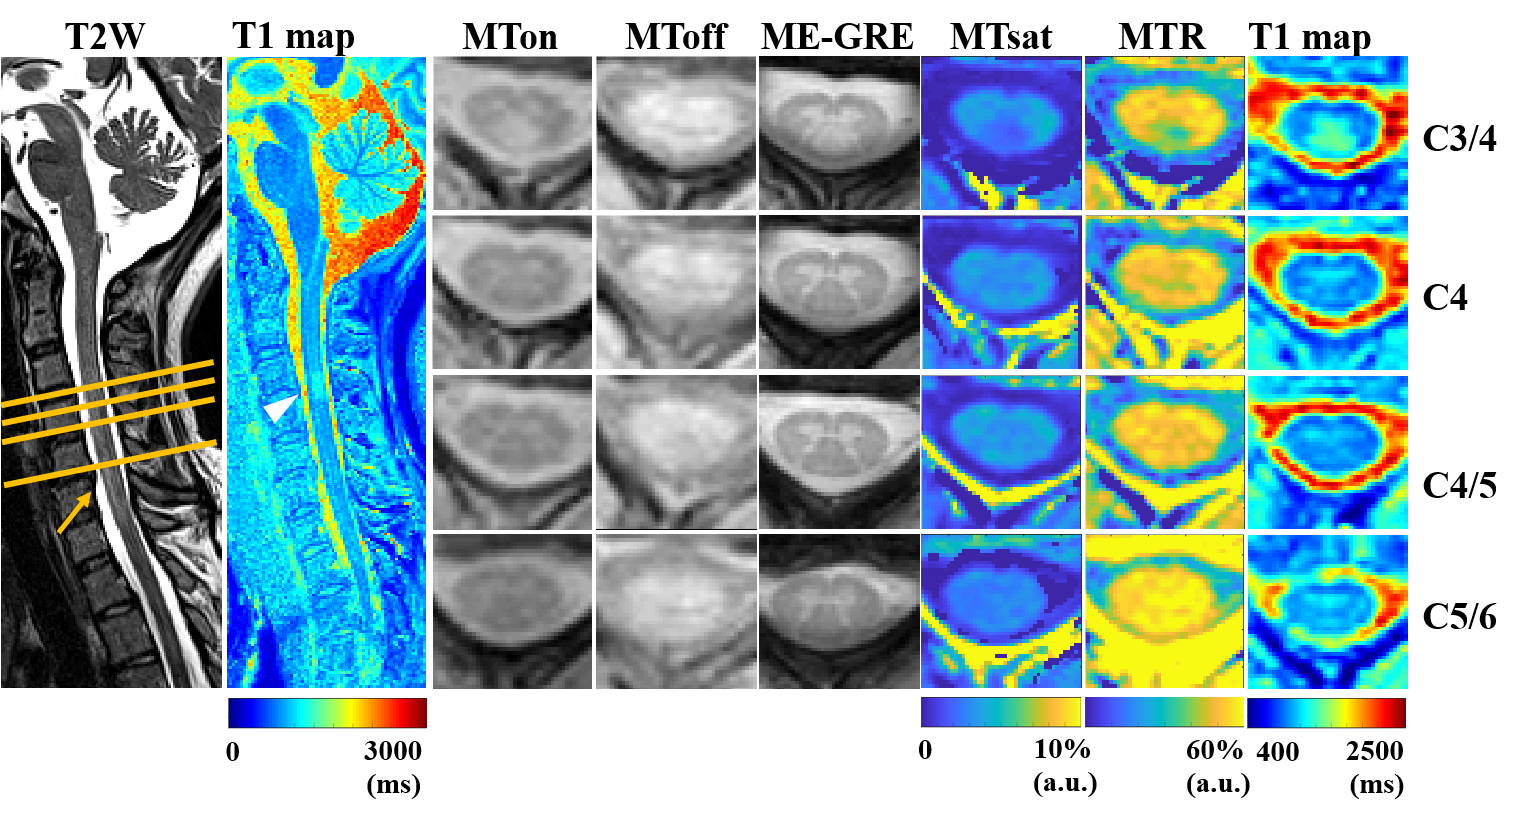
Fig.4 shows the representative quantitative maps of a MS patient. Largely decreased Mtsat, MTR and increased T1 are observed in the suspected lesion region at C3/4. The adjacent slice at C4 is also slightly affected. While these metrics show almost no changes near the compression region at C5/6.
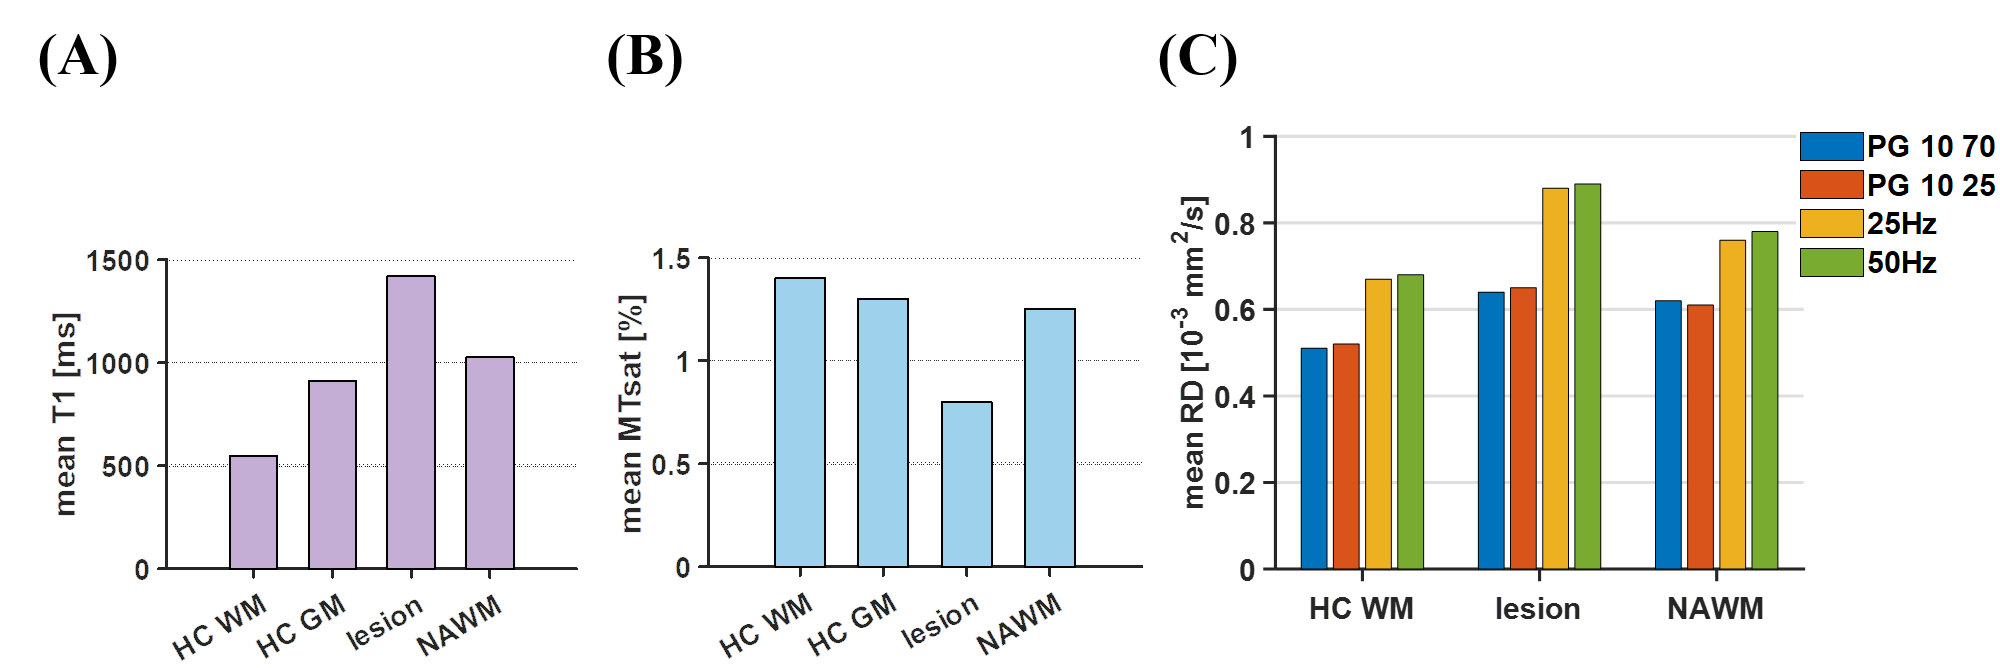
Fig.5 shows the measured mean T1, MTsat and RD values of the healthy controls and MS patients in healthy WM, NAWM and lesions. Increased T1 and decreased MTsat can be found in MS lesions and NAWM. Fig.5C shows that the increase of RD in MS lesions is larger than that in healthy WM when tdiff decreases, possibly indicating higher sensitivity to smaller axons due to demyelination. This provides novel insights into pathological variations in MS.
Conclusion
The time-dependence of diffusivities in the cervical spinal cord of healthy volunteers and MS patients reveals the microstructural differences and pathological variations in MS.Acknowledgements
The authors would like to acknowledge Dr. Thorsten Feiweier from Siemens Healthcare GmbH and Dr. Dehe Weng, Dr. Kun Zhou from Siemens Shenzhen Magnetic Resonance Ltd. for their kind help.References
1. Kearney H, Miller DH, Ciccarelli O. Spinal cord MRI in multiple sclerosis—diagnostic, prognostic and clinical value. Nature Reviews Neurology 2015;11(6):327-338.
2. Filippi M, Brück W, Chard D, et al. Association between pathological and MRI findings in multiple sclerosis. The Lancet Neurology 2019;18(2):198-210.
3. Piredda GF, Hilbert T, Thiran J-P, Kober T. Probing myelin content of the human brain with MRI: A review. Magnetic Resonance in Medicine 2021;85(2):627-652.
4. Granziera C, Wuerfel J, Barkhof F, et al. Quantitative magnetic resonance imaging towards clinical application in multiple sclerosis. Brain 2021;144(5):1296-1311.
5. Gore JC, Xu J, Colvin DC, Yankeelov TE, Parsons EC, Does MD. Characterization of tissue structure at varying length scales using temporal diffusion spectroscopy. NMR in Biomedicine 2010;23(7):745-756.
6. Xu J. Probing neural tissues at small scales: Recent progress of oscillating gradient spin echo (OGSE) neuroimaging in humans. Journal of Neuroscience Methods 2021;349:109024.
7. Van AT, Holdsworth SJ, Bammer R. In vivo investigation of restricted diffusion in the human brain with optimized oscillating diffusion gradient encoding. Magnetic Resonance in Medicine 2014;71(1):83-94.
8. Parsons EC, Does MD, Gore JC. Modified oscillating gradient pulses for direct sampling of the diffusion spectrum suitable for imaging sequences. Magn Reson Imaging 2003;21(3-4):279-285.
9. Cohen-Adad J, Alonso-Ortiz E, Abramovic M, et al. Generic acquisition protocol for quantitative MRI of the spinal cord. Nature Protocols 2021;16(10):4611-4632.
10. De Leener B, Lévy S, Dupont SM, et al. SCT: Spinal Cord Toolbox, an open-source software for processing spinal cord MRI data. Neuroimage 2017;145:24-43.
11. Veraart J, Novikov DS, Christiaens D, Ades-aron B, Sijbers J, Fieremans E. Denoising of diffusion MRI using random matrix theory. Neuroimage 2016;142:394-406.
12. Veraart J, Fieremans E, Novikov DS. Diffusion MRI noise mapping using random matrix theory. Magnetic Resonance in Medicine 2016;76(5):1582-1593.
13. Tournier JD, Smith R, Raffelt D, et al. MRtrix3: A fast, flexible and open software framework for medical image processing and visualisation. Neuroimage 2019;202:116137.
Figures