0109
Joint Estimation of Brain Connectivity and Propagation of Neurodegeneration1Centre for Medical Image Computing, Department of Computer Science, University College London, London, United Kingdom, 2Cardiff University Brain Research Imaging Centre, School of Psychology, Cardiff University, Cardiff, United Kingdom, 3ASG Superconductors S.p.A, Genoa, Italy, 4Department of Computer Science, University of Verona, Verona, Italy
Synopsis
Keywords: Tractography, Brain Connectivity
Motivation: Models of propagation of neurodegeneration encode hypotheses on the mechanisms of pathology spread via the brain’s connectome. However, they fail to accurately capture pathology patterns, partly due to errors in tractography-estimated connectomes.
Goal(s): We use this link between pathology and connectivity to help resolve errors in connectivity estimation. Specifically, we use disease-related pathology to jointly estimate brain connectivity and pathology propagation.
Approach: We introduce a new algorithm to use an estimate of the false-positive potential (FPP) of each connection to constrain the pathology-informed connectome-optimisation.
Results: Combining FPP and pathology-informed optimisation yields substantial improvement to both the connectome and the connectome-based prediction of pathology.
Impact: By jointly estimating pathology and the connectome, we advance both disease understanding and understanding of structural connectivity. The work is a first demonstration of the general idea of using pathology to inform on brain connectivity.
Introduction
Diffusion MRI tractography enables estimation of the brain’s structural connectome in vivo. Computational models of neurodegenerative diseases predict disease-related pathology from the brain’s connectome1–3. However, tractography-estimated connectomes are subject to high error rates, largely false positive connections4, which hinder prediction of pathology from computational models.Here we make a first exploration into joint estimation of brain connectivity and pathology propagation parameters. To enable this, we introduce an algorithm that accounts for both the false-positive potential5 (FPP) and measures of pathology. We demonstrate that simultaneously accounting for both these measures yields improvement to connectome estimates and accuracy of pathology predictions.
Methods
We consider three models of pathology accumulation: centrality1, segregation1 and the network diffusion model (NDM)2. Joint estimation has two methodological components: the false-positive potential (FPP) and pathology-informed optimisation (see Figure 1).Connectivity-based models of Pathology Accumulation
Centrality and segregation assume pathology accumulation is proportional to network topology. Centrality assumes highly connected regions are vulnerable to disease; segregation assumes isolated regions are vulnerable. The NDM simulates temporal pathology propagation via a diffusion equation (see Figure 2).False-Positive Potential (FPP)
FPP, introduced in5, uses the COMMIT framework6 to evaluate the contribution each connectome edge independently makes to reproducing the diffusion MRI signal. For each connection, we calculate the root-mean-squared-error (RMSE) between simulated diffusion images with and without the contributing streamlines and calculate FPP=1-RMSE.Pathology-Informed Optimisation
Joint optimisation of pathology and connectivity was performed using simulated annealing7. We randomly perturb the connectome by adding or pruning a connection and evaluate the change in objective function, ΔE. We vary E to consider either pathology pattern alone, or pathology and FPP. If E decreases, we accept the change. If E increases, we accept the change with probability P=e-ΔE/T where temperature T exponentially decreases with each iteration. This produces an optimised connectome, $$$C*$$$. We repeat the optimisation K times (K=100), producing $$$C_k*$$$ which we binarise ($$$C_k*>0$$$). We consider the rate of inclusion of each connectome edge and calculate pathology-informed false-positive likelihood (FPL) as 1 minus rate of inclusion:$$pathology-informed\quad FPL=1- \frac{\sum_{k=1}^{K}(C_k*>0)}{K}$$
Experiments
Diffusion images were used to estimate structural connectomes and the FPP, pathology patterns enable pathology-informed optimisation.Synthetic Data
Diffusion: We use a synthetic dataset based on brain-like geometry4. This provided ground truth bundles with simulated, clinically-realistic diffusion images (b=[0,1000]s/mm2, 33 diffusion directions, resolution=2x2x2mm3).Pathology: Regional pathology was simulated from the ground truth connectome according to each model of interest (segregation, centrality or the NDM), thereby providing a best-case scenario to test our framework.
In-vivo data
Diffusion: Pre-processed diffusion and structural MR images from five healthy subjects were downloaded from the Human Connectome Project (b=[0,1000,2000,3000]s/mm2, 288 diffusion directions, resolution=1.25x1.25x1.25mm3).Pathology: Positron Emission Tomography (PET) imaging provided input pathology patterns. Tau-PET regional SUVRs (AV-1451) were obtained from the ADNI (adni.loni.usc.edu) for β-Amyloid positive subjects (global AV-45 SUVR>1.118) with a dementia or mild cognitive impairment diagnosis (N=126). Sub-cortical regions were excluded due to off-target binding. Regional tau-PET (AV-1451) values were averaged over all subjects and normalised between [0,1].
Tractography and Connectome Construction
We generated 5 million streamlines using probabilistic tractography in MrTrix39, from which we estimated connectivity between 85 Desikan Killiany regions10 (cortical, sub-cortical and medulla). COMMIT2-filtering11 was applied to each tractogram to reduce false positive edges in the connectome.Optimisation Strategies
We evaluated three strategies to optimise the COMMIT2-filtered connectomes:1. FPP: streamline count is weighted by (1-FPP), such that connections with a high FPP are down-weighted.
2. Pathology-informed optimisation: objective function, E=mean average error between predicted and observed pathology (MAE).
3. Dual-constrained optimisation: objective function, $$$E=α*MAE+(1-α)*mean(FPP)$$$, where α controls the trade-off between pathology and FPP.
Results
In the synthetic dataset, dual-constrained optimisation (strategy 3) results in the highest connectome accuracy across all pathology models (Figure 3).In the in vivo dataset, optimisation accounting for pathology alone (strategy 2) provides the best correlation between measured and predicted tau SUVR for all pathology models (Figure 4). Dual-constrained optimisation maintains a high correlation with NDM providing the best fit (R2=0.91).
Figure 5 shows FPP and pathology-informed FPL for bundles in the in vivo dataset. Mean pathology-informed FPL is consistently higher for true positive bundles compared to false positive bundles. When comparing FPP to pathology-informed FPL, incorporating observations of pathology reduces the pathology-informed FPL for true positive bundles and increases for false positive bundles.
Discussions and Conclusions
In this work, we introduce a novel approach to improve connectome estimation. By exploiting the link between brain connectivity and spread of pathology to constrain the structural connectome, we improve both pathology prediction and connectome accuracy. Furthermore, results highlight the value of the FPP in maximising connectome accuracy.Acknowledgements
AS and TE are supported by the EPSRC funded UCL Centre for Doctoral
Training in Intelligent, Integrated Imaging in Healthcare [EP/S021930/1]. AS is supported by Engineering and Physical Sciences Research Council (EPSRC), Impact Acceleration Account (IAA) 2022-25. ET, TH and DCA are supported by Wellcome Trust (221915). NPO acknowledges funding from a UKRI Future Leaders Fellowship (MR/S03546X/1), the Early Detection of Alzheimer's Disease Subtypes project (E-DADS; EU JPND, MR/T046422/1), and the National Institute for Health Research University College London Hospitals Biomedical Research Centre. MP is supported by UKRI Future Leaders Fellowship (MR/T020296/2). Data collection and sharing for this project was funded by the Alzheimer's Disease Neuroimaging Initiative (ADNI) (National Institutes of Health Grant U01AG024904) and DOD ADNI (Department of Defense award number W81XWH-12-2-0012). ADNI is funded by the National Institute on Aging, the National Institute of Biomedical Imaging and Bioengineering, and through generous contributions from the following: AbbVie, Alzheimer's Association; Alzheimer's Drug Discovery Foundation; Araclon Biotech; BioClinica, Inc.; Biogen; Bristol-Myers Squibb Company; CereSpir, Inc.; Cogstate; Eisai Inc.; Elan Pharmaceuticals, Inc.; Eli Lilly and Company; Euro Immun; F. Hoffmann-La Roche Ltd and its affiliated company Genentech, Inc.; Fujirebio; GE Healthcare; IXICO Ltd.; Janssen Alzheimer Immunotherapy Research & Development, LLC.; Johnson & Johnson Pharmaceutical Research & Development LLC.; Lumosity; Lundbeck; Merck & Co., Inc.; Meso Scale Diagnostics, LLC.; Neuro Rx Research; Neurotrack Technologies; Novartis Pharmaceuticals Corporation; Pfizer Inc.; Piramal Imaging; Servier; Takeda Pharmaceutical Company; and Transition Therapeutics. The Canadian Institutes of Health Research is providing funds to support ADNI clinical sites in Canada. Private sector contributions are facilitated by the Foundation for the National Institutes of Health (www.fnih.org). The grantee organization is the Northern California Institute for Research and Education, and the study is coordinated by the Alzheimer's Therapeutic Research Institute at the University of Southern California. ADNI data are disseminated by the Laboratory for Neuro Imaging at the University of Southern California.
References
Zhou J, Gennatas ED, Kramer JH, Miller BL, Seeley WW. Predicting Regional Neurodegeneration from the Healthy Brain Functional Connectome. Neuron. 2012 Mar 22;73(6):1216–27.
2. Raj A, Kuceyeski A, Weiner M. A network diffusion model of disease progression in dementia. Neuron. 2012 Mar 22;73(6):1204–15.
3. Weickenmeier J, Jucker M, Goriely A, Kuhl E. A physics-based model explains the prion-like features of neurodegeneration in Alzheimer’s disease, Parkinson’s disease, and amyotrophic lateral sclerosis. J Mech Phys Solids. 2019 Mar 1;124:264–81.
4. Maier-Hein KH, Neher PF, Houde JC, Côté MA, Garyfallidis E, Jidan Zhong, et al. The challenge of mapping the human connectome based on diffusion tractography. Nat Commun. 2017 Nov 7;8(1):1349–1349.
5. Schroder A, Oxtoby NP, Palombo M, Schiavi S, Daducci A, Alexander DC. False-positive potential of tractography-derived connections improves network reconstruction for disease spreading models. In: Proceedings of the international society for magnetic resonance in medicine. 2021.
6. Daducci A, Dal Palù A, Lemkaddem A, Thiran JP. COMMIT: Convex Optimization Modeling for Microstructure Informed Tractography. IEEE Trans Med Imaging. 2015 Jan 1;34(1):246–57.
7. Kirkpatrick S, Gelatt CD, Vecchi MP. Optimization by Simulated Annealing. Science. 1983 May 13;220(4598):671–80.
8. Landau SM, Mintun MA, Joshi AD, Koeppe RA, Petersen RC, Aisen PS, et al. Amyloid deposition, hypometabolism, and longitudinal cognitive decline. Ann Neurol. 2012 Oct;72(4):578–86.
9. Tournier JD, Smith RE, Raffelt D, Tabbara R, Dhollander T, Pietsch M, et al. MRtrix3: A fast, flexible and open software framework for medical image processing and visualisation. bioRxiv. 2019 Feb 15;551739.
10. Desikan RS, Ségonne F, Fischl B, Quinn BT, Dickerson BC, Blacker D, et al. An automated labeling system for subdividing the human cerebral cortex on MRI scans into gyral based regions of interest. NeuroImage. 2006 Jul 1;31(3):968–80.
11. Schiavi S, Ocampo-Pineda M, Barakovic M, Petit L, Descoteaux M, Thiran JP, et al. A new method for accurate in vivo mapping of human brain connections using microstructural and anatomical information. Sci Adv. 2020 Jul 29;6(31):1–11.
Figures
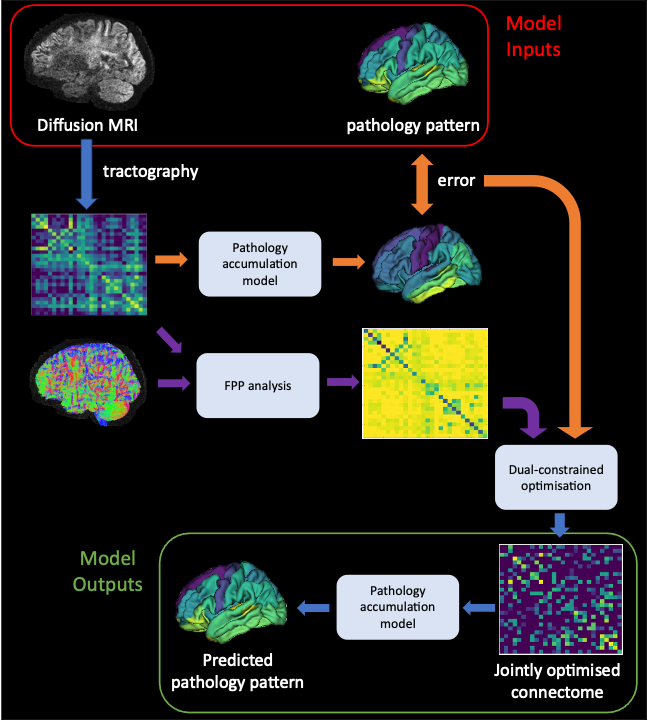
Figure 1: Overview of joint optimisation framework. Diffusion MRI scans and the pattern of disease-related pathology (tau-PET SUVR in this work), provide input to the model. Tractography is run on the DW-MRI. FPP (analysis pipeline in purple) and pathology-informed optimisation (in orange) combine to produce a jointly optimised connectome, from which we can produce a predicted pathology pattern.
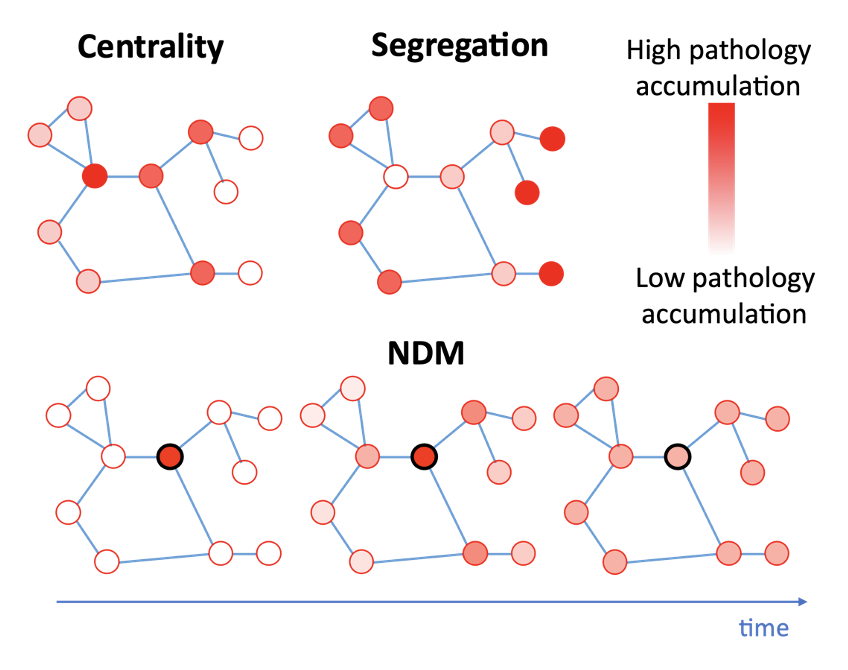
Figure 2: Predicted pathology patterns from centrality, segregation the network diffusion models (NDM) on a toy connectome. Edges are represented by blue lines, nodes are represented by red circles, and pathology accumulation is represented by the transparency of the node. Centrality and segregation models are independent of time, while the NDM includes a time parameter.
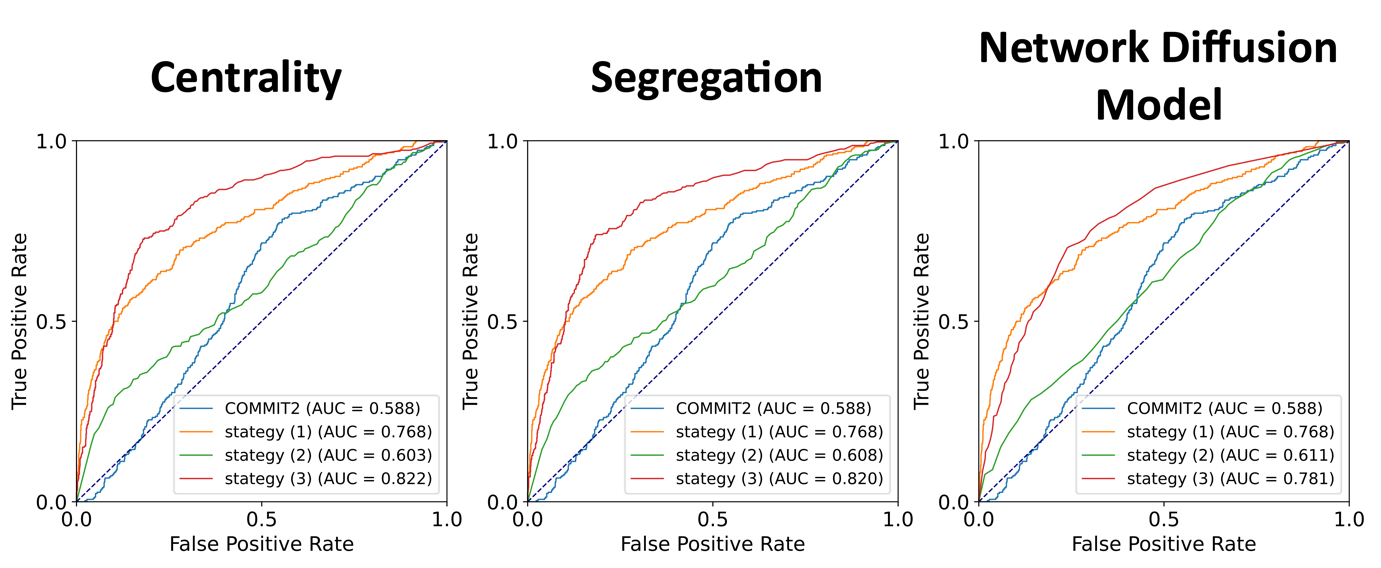
Figure 3: ROC curves illustrating the improvements to connectome accuracy in the synthetic dataset. Three connectome optimisation strategies are shown for each pathology model: Strategy 1. FPP only (orange), Strategy 2. pathology-informed optimisation (green), and Strategy 3. dual-constrained optimisation (red). Optimisation strategies are compared to COMMIT2 which we take as our baseline, where we consider the mean COMMIT2 weight across all streamlines contributing to each connectome edge.
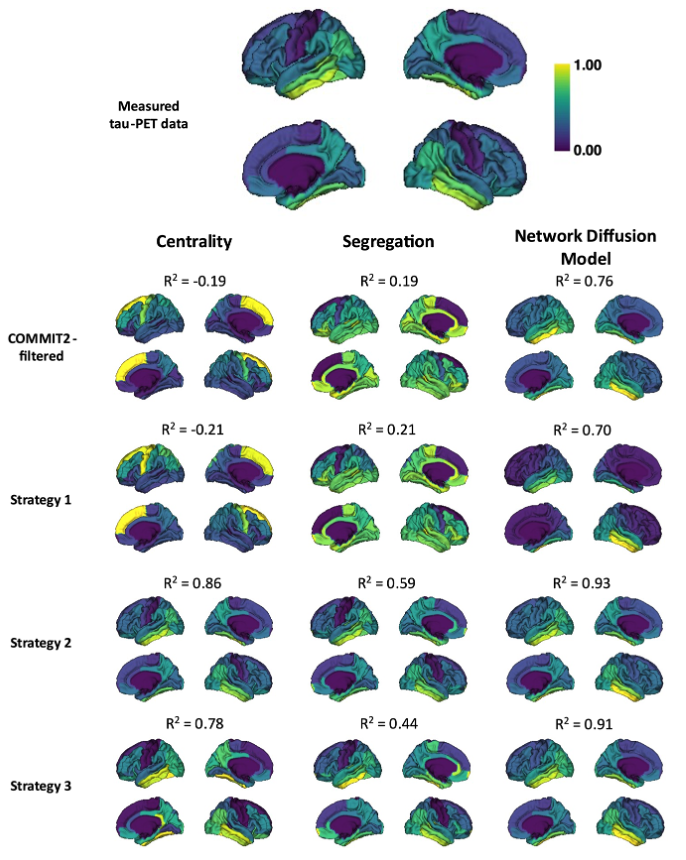
Figure 4: Measured and predicted patterns of tau-PET SUVR in the in vivo dataset. SUVR values are normalised between zero and one (high tau accumulation shown in yellow, low tau in purple). Measured SUVR from ADNI are shown in the top row. Patterns of tau were predicted using the COMMIT2-filtered connectome (second row), and strategies 1 (third row), 2 (forth row) and 3 (fifth row) for each pathology model. Pearson’s R correlation (R2) between predicted and measured tau are above each subplot.
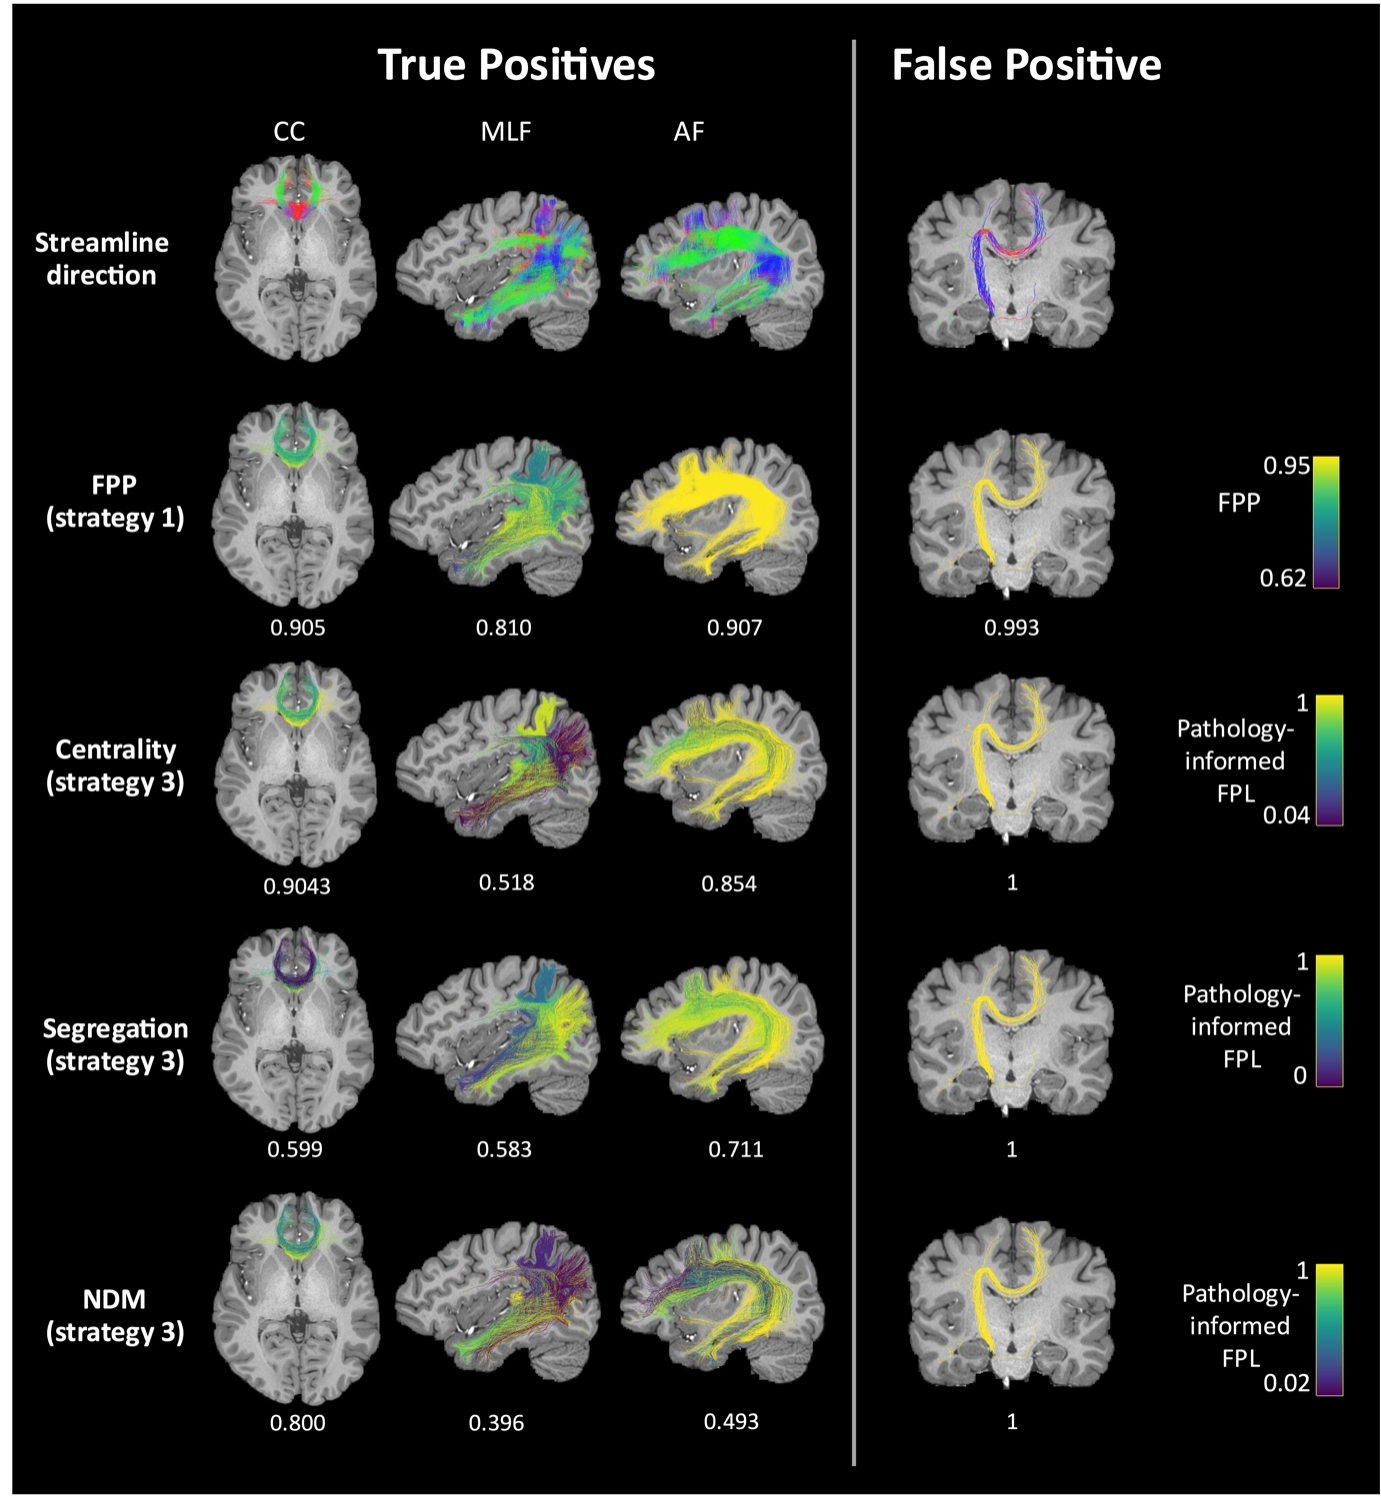
Figure 5: FPP and pathology-informed FPL for true positive and false positive bundles in the in vivo dataset. Streamlines are coloured according to their direction in the top row, by FPP in the second row, and by pathology-informed FPL using strategy 3 in the final three rows when centrality (third row), segregation (forth row) or the NDM (fifth row) are assumed to be the underlying models of disease propagation. The mean FPP or pathology-informed FPL is provided below each figure.