0104
Association between Aortic Morphology and Aortic Wall Properties1Johns Hopkins University, Baltimore, MD, United States, 2Sorbonne Universete, Paris, France, 3Pitie Salpetriere APHP University Hospital, Paris, France, 4Hôpital Européen Georges Pompidou, Paris, France
Synopsis
Keywords: Vascular, Machine Learning/Artificial Intelligence
Motivation: To understand how closely aortic morphology is associated with aortic wall properties.
Goal(s): (1) To correlate aortic shape using morphometrics to aortic stiffness indexed by pulse wave velocity
(2) To correlate shape to regional aortic wall shear stress
Approach: We use atlas-based shape analysis (morphometrics) to generate principal modes of shape variation, and then correlate modes of shape variation with pulse wave velocity to check their association. We also generate deep-learning based WSS using aortic shapes defined as point clouds forming the input to the neural network.
Results: Aortic shapes were moderately associated with aortic stiffness as well as regional wall shear stress.
Impact: Studying aortic morphological remodeling patterns may provide key insight into underlying disease processes that involve changes in aortic material wall properties and regional flow characteristics.
Introduction
Elevated arterial stiffness and wall shear stress (WSS) are known markers of cardiovascular disease (CVD) as well as aneurysm formation.(1–5) Aortic shape(6–8) is seen to be a key influencer of flow patterns through the aorta.(9, 10) The pathogenesis of aortic stiffness‐related comorbidities may be due to but also potentiate abnormal aortic shape.(11) However, little is known regarding how closely variations in shape are related to aortic stiffness and WSS. Here we use a combination of atlas-based shape analysis (morphometrics) and deep-learning to understand whether aortic shape is related to global aortic stiffness and regional variations in WSS.Methods
Population: 4D flow MRI was acquired in 100 subjects - 17 patients with ascending thoracic aortic aneurysm and a tricuspid aortic valve with no stenosis or regurgitation graded more than moderate (67±14 years, 11 males), 53 healthy volunteers without overt CVD (50±17 years, 27 males) and 30 participants with type 2 Diabetes Mellitus (55±11 years, 16 males). All subjects gave informed consent, and the study protocol was approved by Institutional Review Board.(12, 13)Data Acquisition: MRI was performed on 3T GE and 1.5T Siemens systems with a 32-channel phased-array coil. 4D flow data were acquired during free-breathing with ECG gating in a sagittal oblique volume encompassing the thoracic aorta, using the following scan parameters: echo time~1.7-2.7 ms, repetition time TR=4.3-5.4 ms, flip angle=8-15°, spatial resolution=2-2.2×2-2.2×2.4-2.7 mm3, and velocity encoding~200-250 cm/s in all directions. Data were reconstructed into 20-50 temporal phases.
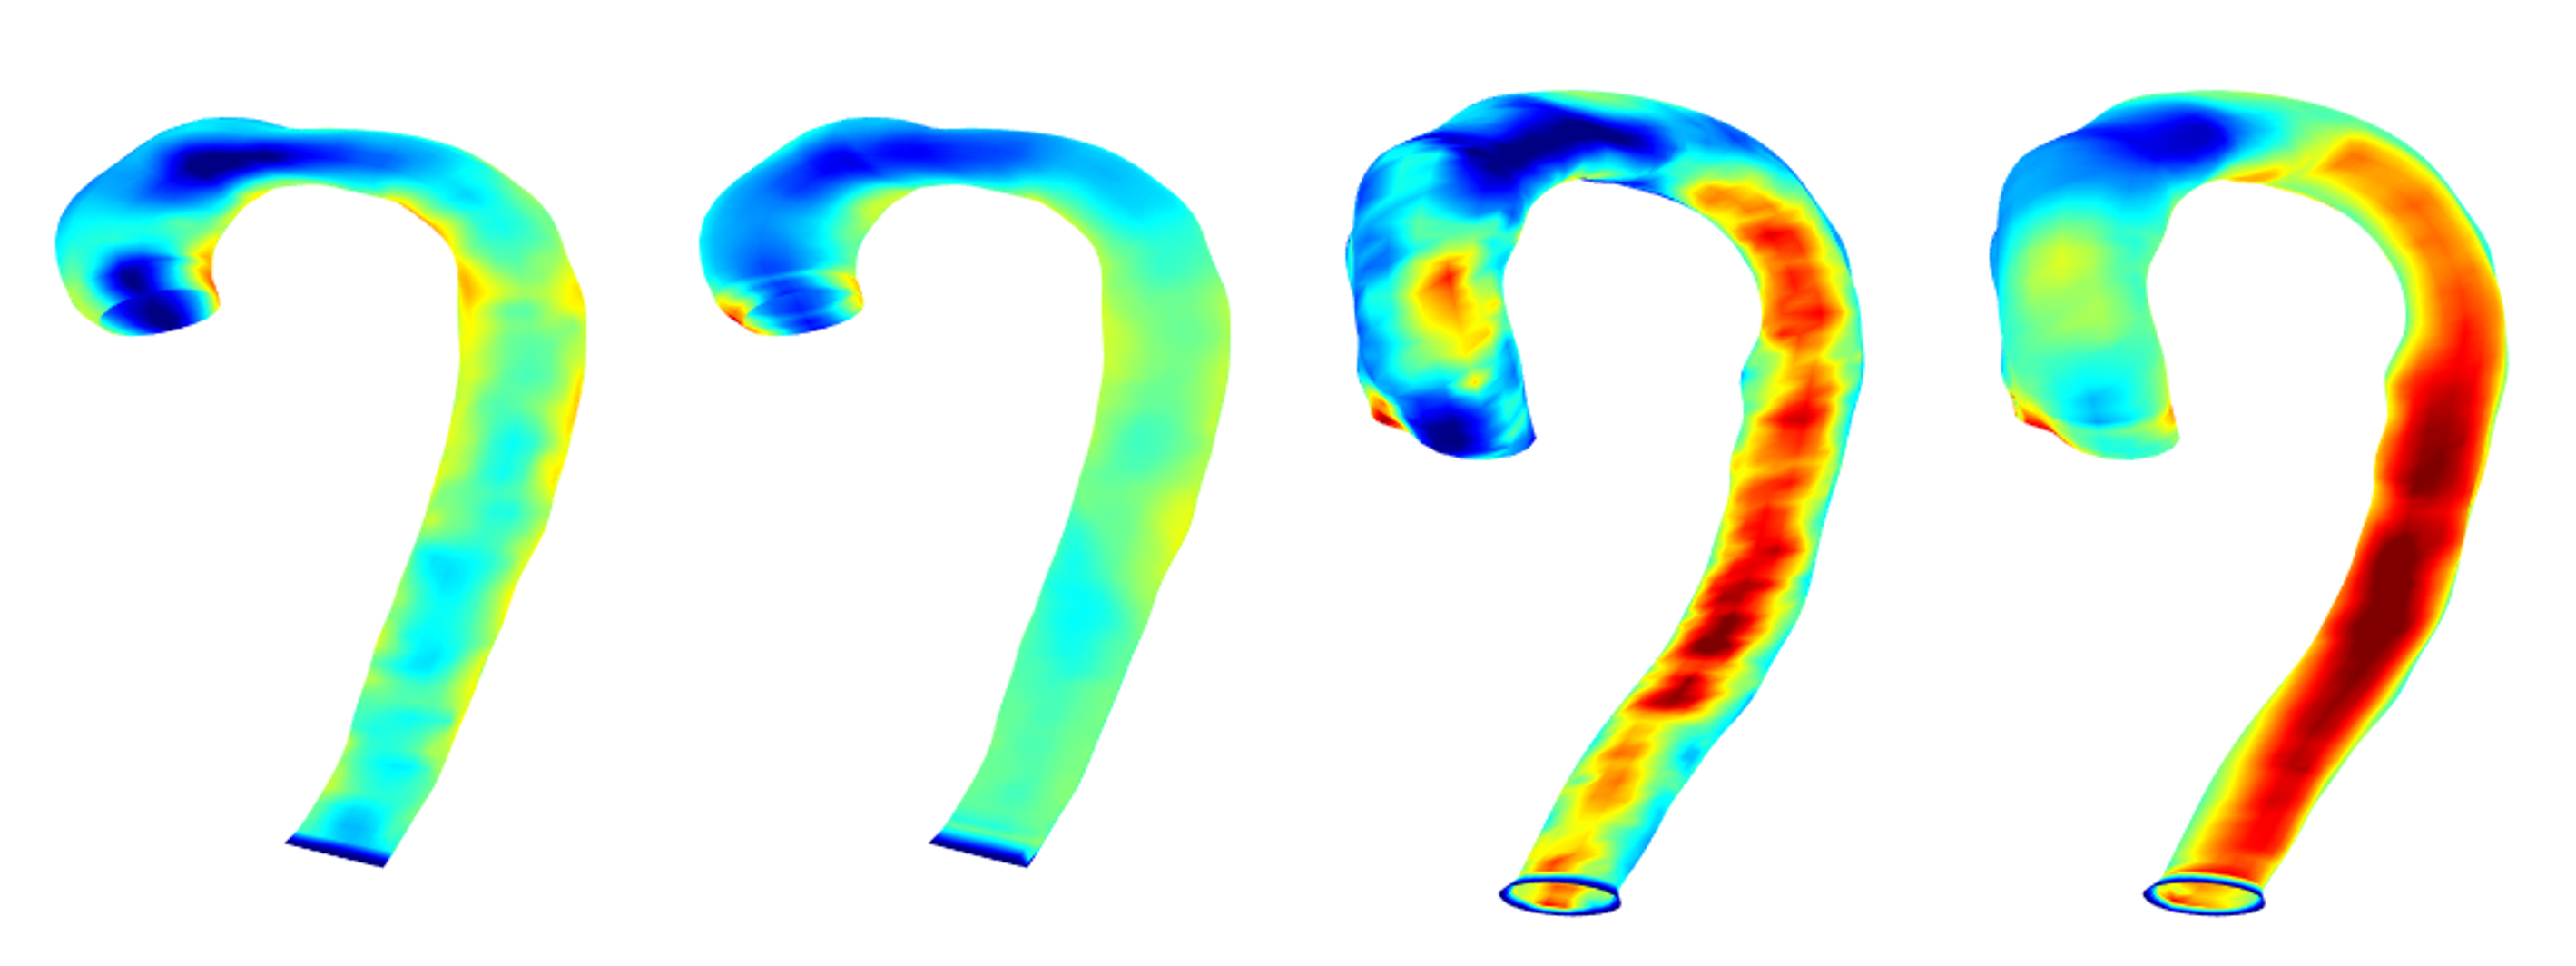
WSS estimation from 4D flow images: Phase offset and phase wrapping were corrected. A time-averaged phase-contrast MR angiography (PC-MRA) was derived from the 3 directional velocities weighted by modulus images. Such PC-MRA was used to segment the thoracic aortic volume with an explicit active contours algorithm(14) and isolate aortic velocity fields. WSS vectors were evaluated on the aortic wall segmentation as described before.(13, 15) Finally, WSS at peak systole was calculated at the points of a parametric mesh with 4096 points (128 longitudinal and 32 cross-sectional locations across the length of the aorta) for each subject.
Deep-Learning based analysis: A 10-fold cross-validation scheme was used. We used a modified PointNet transformer architecture(16, 17) with an additional input with ascending aortic flow. The inputs to the network were the mesh geometry (x, y and z coordinates of the parametric aortic mesh, 4096 points) and the aortic flow waveform at the ascending aorta. The network was trained to compute the deep learning (DL) WSS estimates at each of the 4096 mesh points of the aorta, using only the above-mentioned inputs.
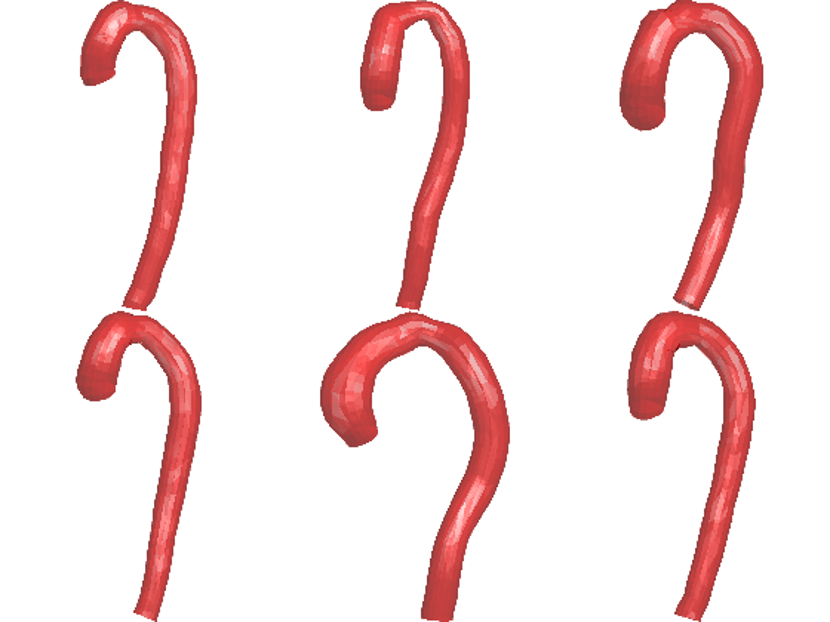
Morphometrics: The mean aortic shape in the population and variations around this mean were computed using the statistical shape modeler (SSM) which is based on the large deformation diffeomorphic mapping technique.(18) The models were uniformly remeshed (Figure 1), smoothed and rigidly registered before SSM. The deformation vectors from the SSM were used as shape vectors to perform statistical shape analysis. Principal Component Analysis (PCA) was used to identify the major cross-sectional variations in aortic shape across the population.
Pulse wave velocity (PWV): Distances (D) between 25 cross-sectional planes along the 3D thoracic aortic centerline and transit times (TT) between the corresponding 25 normalized mean velocity waveforms were automatically computed. Regional PWV was calculated as the inverse of the slope of TT vs. D linear regression. Of note, TT were measured using the wavelet transform method applied on systolic velocity upslopes.(19)
Results
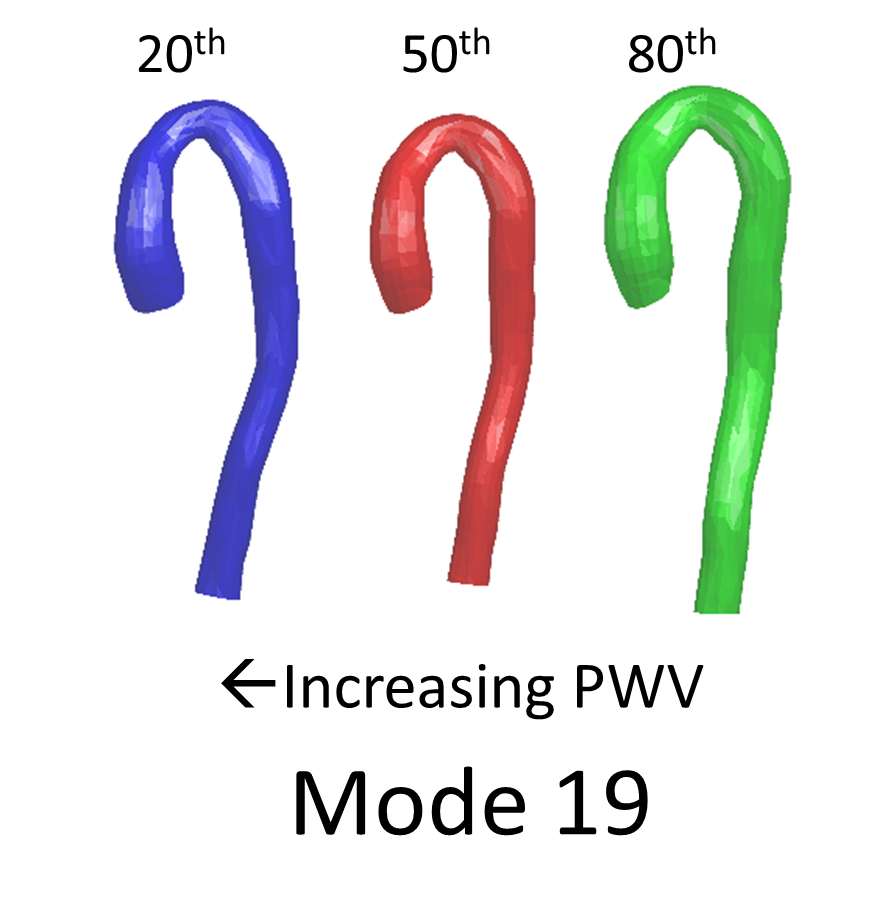
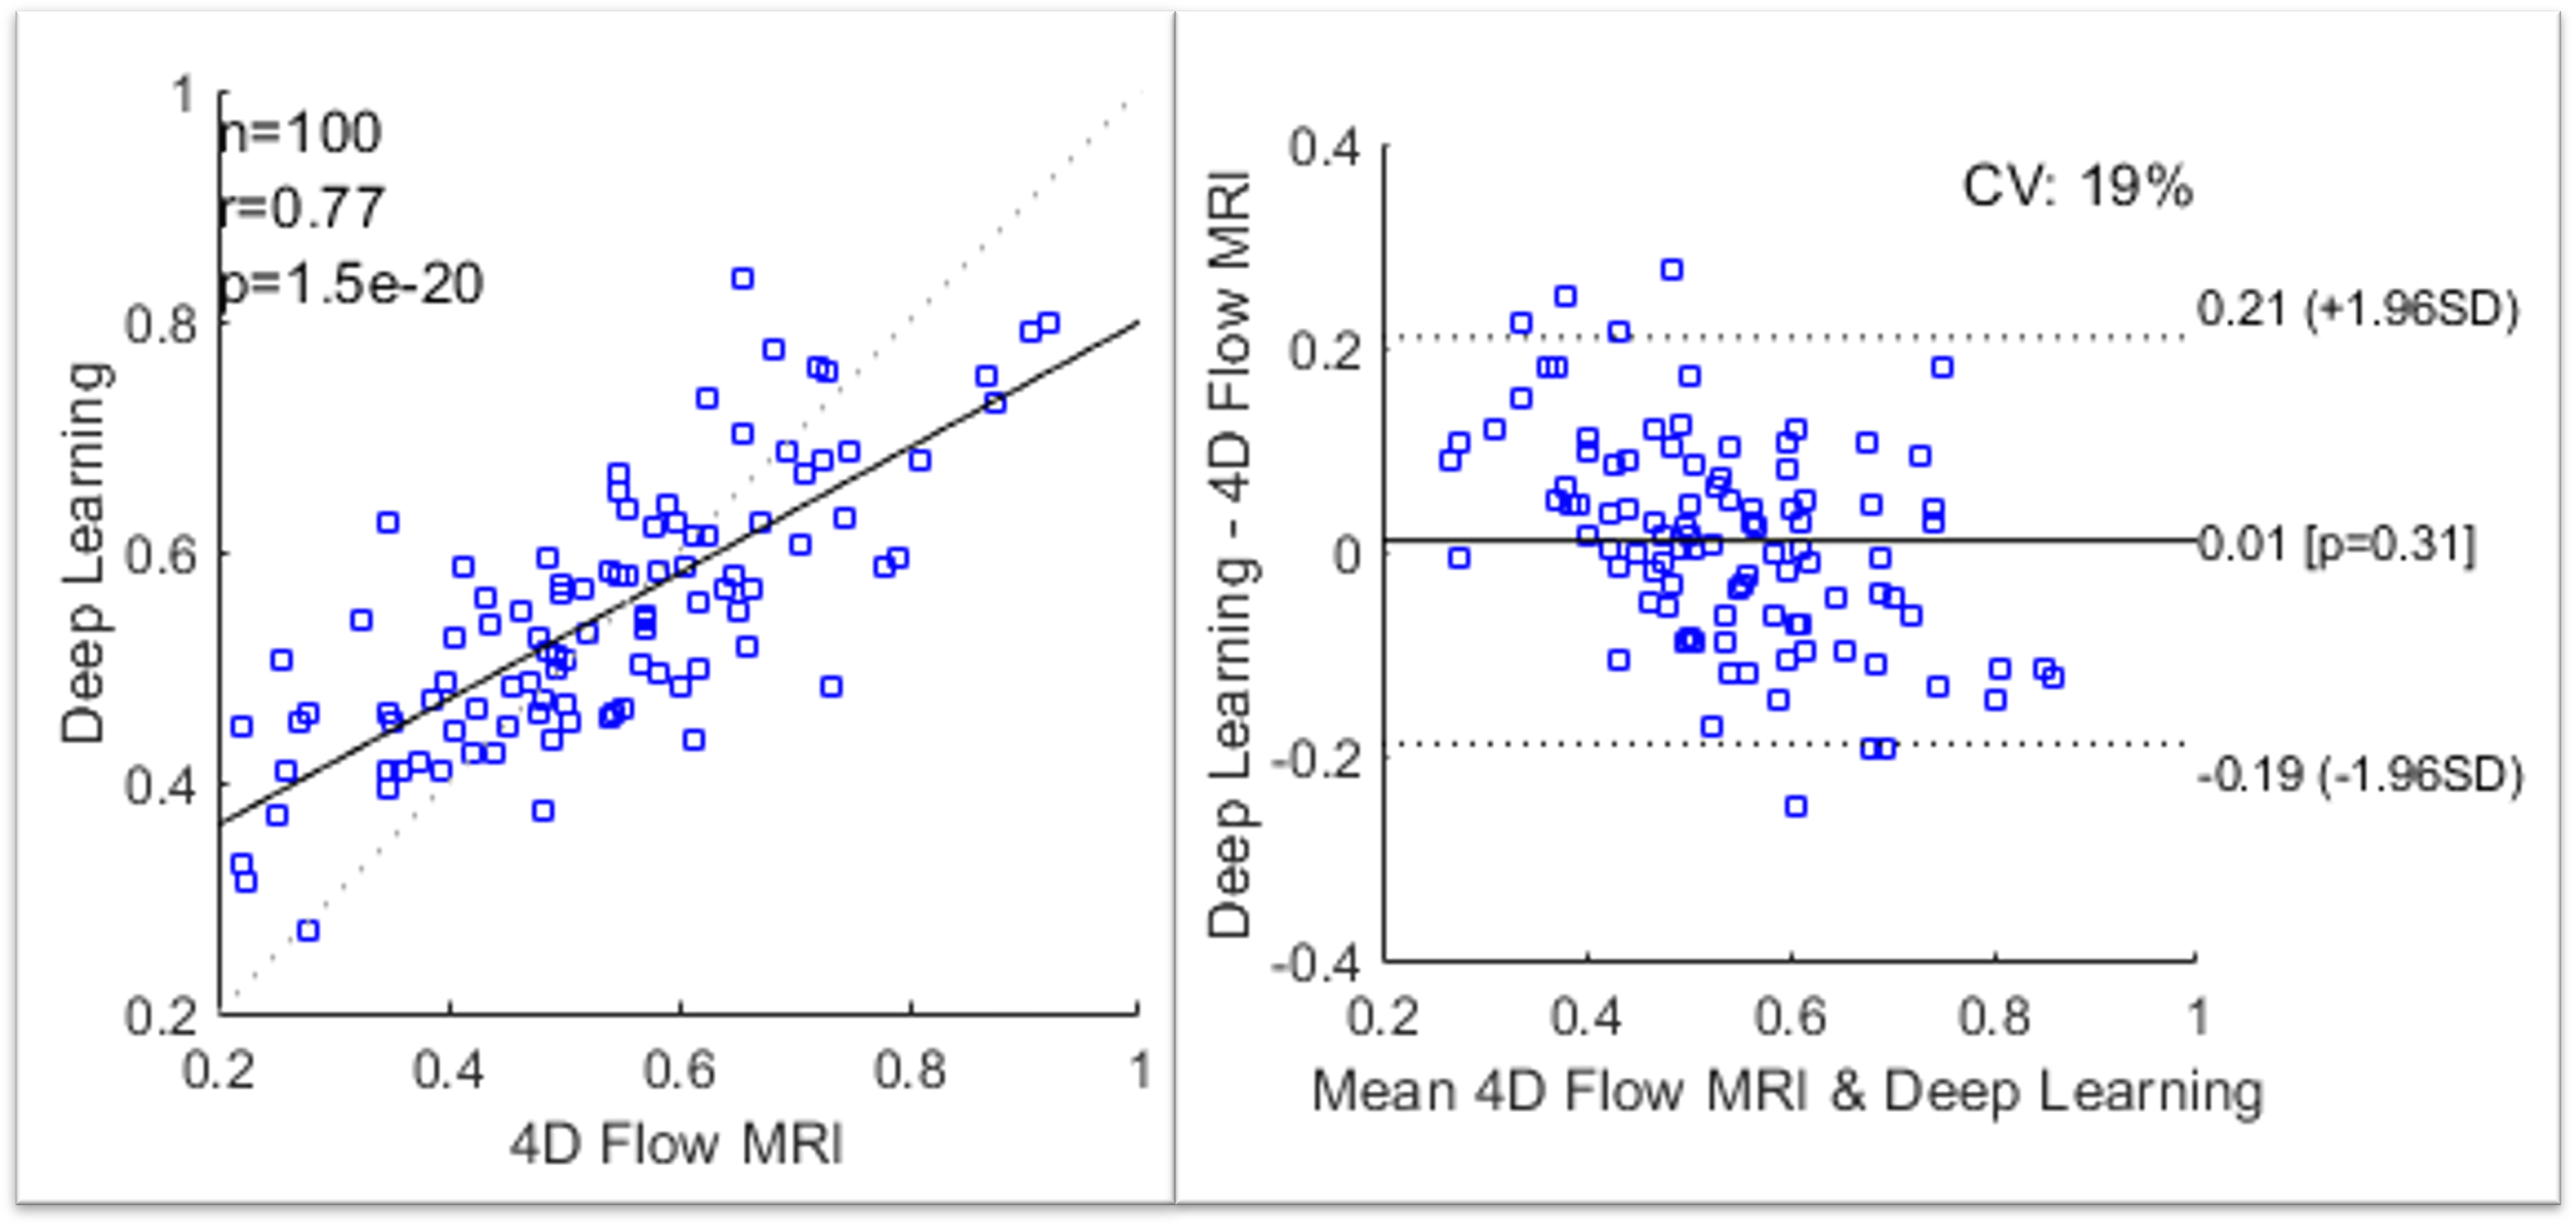
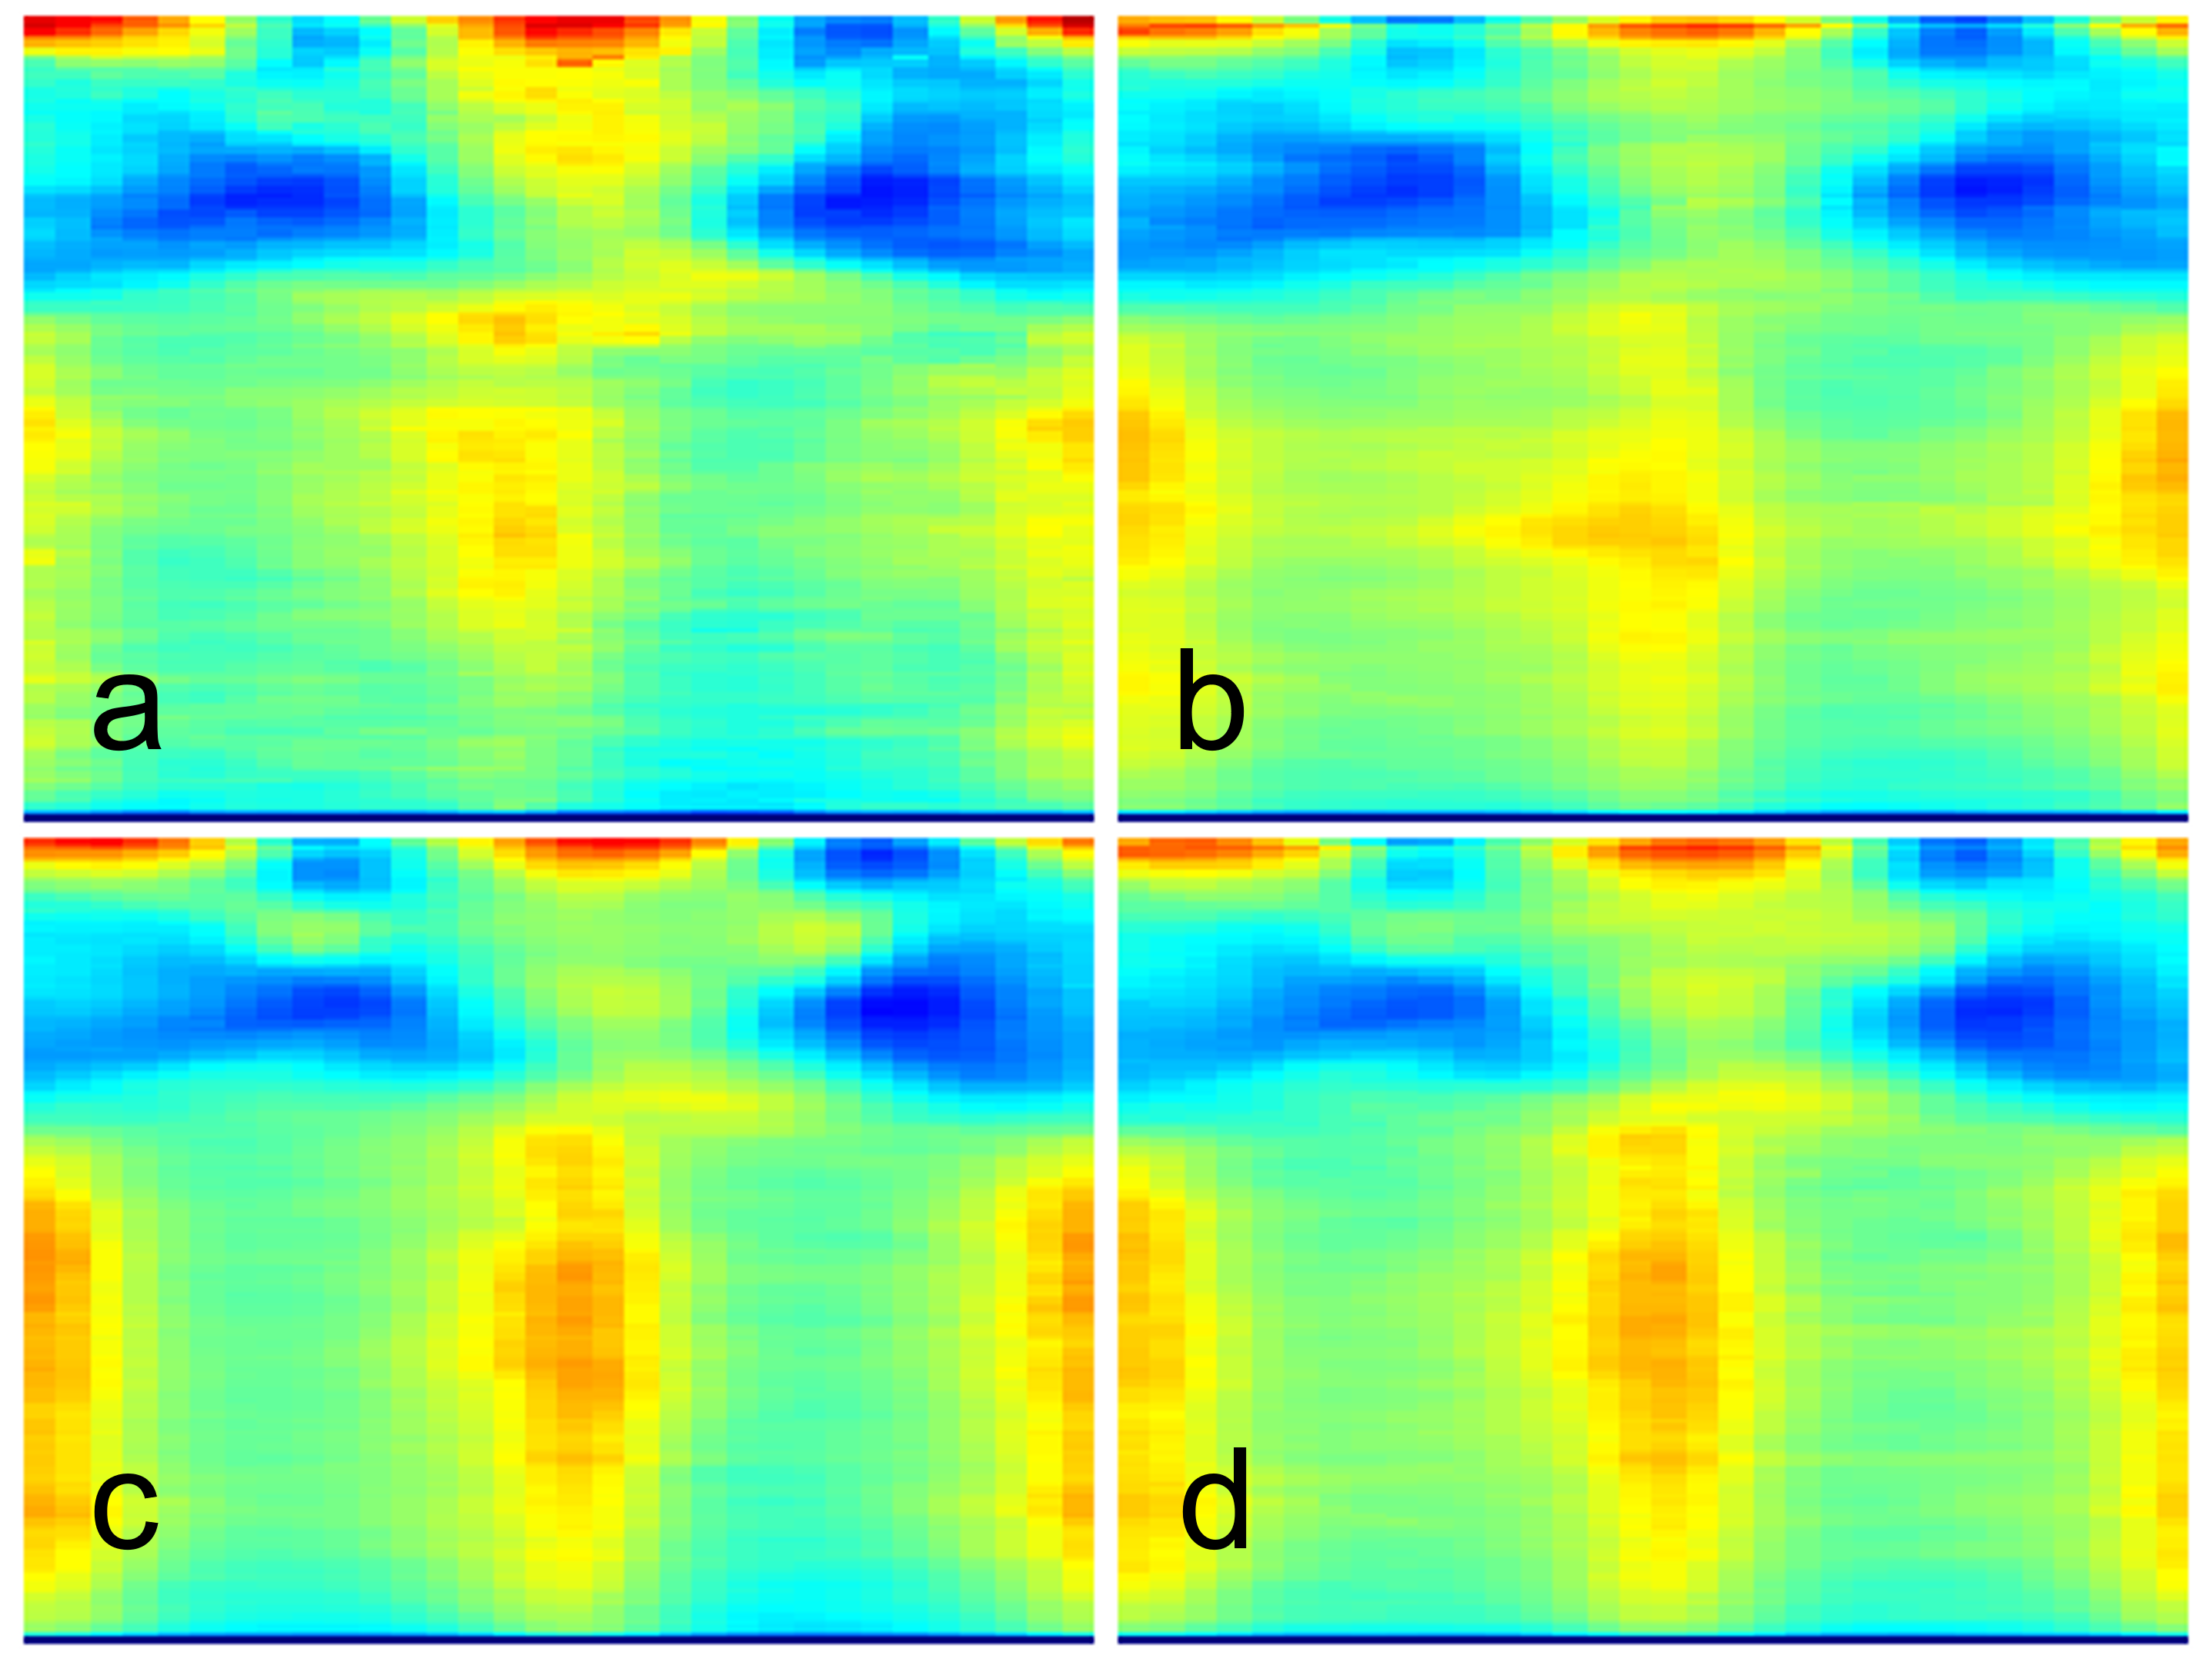
PCA analysis was performed to understand the major modes of shape variation. The first 50 shape modes explained 91% of the variation. Figure 2 shows two of the modes (mode number 19, r=-0.28, p<0.01; mode number 27: r=0.28, p<0.01) associated with PWV in this population – greater PWV was associated with a more tortuous aorta. We also computed DL-WSS estimates with 4D flow MRI as the true data. Results (Figure 3) show that the correlation between DL-WSS and the 4D flow WSS calculated at systole was moderate (r=0.77, p<0.001). Figure 4 shows point-wise mean pixel estimates using the two techniques in those with and without aortic dilatation. Figure 5 shows visual comparison of WSS maps from two participants.Discussion
We use a combination of morphometry and point-cloud based deep learning techniques to show that aortic shape is correlated with regional wall shear stress and global stiffness assessed by pulse wave velocity. Further study of these remodeling patterns may provide key insight into underlying disease processes.Conclusion
In conclusion, aortic shapes vary based on the material properties of the aorta as well as regional flow characteristics.Acknowledgements
No acknowledgement found.References
1. Redheuil A, Wu CO, Kachenoura N, et al.: Proximal Aortic Distensibility Is an Independent Predictor of All-Cause Mortality and Incident CV Events The MESA Study. J Am Coll Cardiol 2014; 64:2619–2629.
2. Ohyama Y, Ambale-Venkatesh B, Noda C, et al.: Aortic Arch Pulse Wave Velocity Assessed by Magnetic Resonance Imaging as a Predictor of Incident Cardiovascular Events. Hypertension 2017; 70:524–530.
3. Sutton-Tyrrell K, Najjar SS, Boudreau RM, et al.: Elevated Aortic Pulse Wave Velocity, a Marker of Arterial Stiffness, Predicts Cardiovascular Events in Well-Functioning Older Adults. Circulation 2005; 111:3384–3390.
4. Boussel L, Rayz V, McCulloch C, et al.: Aneurysm Growth Occurs at Region of Low Wall Shear Stress. Stroke 2008; 39:2997–3002.
5. Soulat G, Scott MB, Allen BD, et al.: Association of Regional Wall Shear Stress and Progressive Ascending Aorta Dilation in Bicuspid Aortic Valve. Jacc Cardiovasc Imaging 2022; 15:33–42.
6. Bruse JL, McLeod K, Biglino G, et al.: A statistical shape modelling framework to extract 3D shape biomarkers from medical imaging data: assessing arch morphology of repaired coarctation of the aorta. Bmc Med Imaging 2016; 16:40.
7. Bruse JL, Zuluaga MA, Khushnood A, et al.: Detecting Clinically Meaningful Shape Clusters in Medical Image Data: Metrics Analysis for Hierarchical Clustering Applied to Healthy and Pathological Aortic Arches. Ieee T Bio-med Eng 2017; 64:2373–2383.
8. Schnell S, Smith DA, Barker AJ, et al.: Altered aortic shape in bicuspid aortic valve relatives influences blood flow patterns. European Hear J Cardiovasc Imaging 2016; 17:1239–1247.
9. Bensalah MZ, Bollache E, Kachenoura N, et al.: Geometry is a major determinant of flow reversal in proximal aorta. Am J Physiol-heart C 2014; 306:H1408–H1416.
10. Westerhof BE, Westerhof N: Magnitude and return time of the reflected wave. J Hypertens 2012; 30:932–939.
11. Hundley WG, Kitzman DW, Morgan TM, et al.: Cardiac cycle-dependent changes in aortic area and distensibility are reduced in older patients with isolated diastolic heart failure and correlate with exercise intolerance. J Am Coll Cardiol 2001; 38:796–802.
12. Bouaou K, Bargiotas I, Dietenbeck T, et al.: Analysis of aortic pressure fields from 4D flow MRI in healthy volunteers: Associations with age and left ventricular remodeling. J Magn Reson Imaging 2019; 50:982–993.
13. Bouaou K, Dietenbeck T, Soulat G, et al.: Pressure and Flow Interplay in Aortic Dilation Using 4D Flow Magnetic Resonance Imaging. 2019 Comput Cardiol Cinc 2019; 00:Page 1-Page 4.
14. Dietenbeck T, Craiem D, Rosenbaum D, et al.: 3D aortic morphology and stiffness in MRI using semi-automated cylindrical active surface provides optimized description of the vascular effects of aging and hypertension. Comput Biol Med 2018; 103:101–108.
15. Potters WV, Ooij P, Marquering H, vanBavel E, Nederveen AJ: Volumetric arterial wall shear stress calculation based on cine phase contrast MRI. J Magn Reson Imaging 2015; 41:505–516.
16. Qi CR, Su H, Mo K, Guibas LJ: PointNet: Deep Learning on Point Sets for 3D Classification and Segmentation. Arxiv 2016.
17. Qi CR, Yi L, Su H, Guibas LJ: PointNet++: Deep Hierarchical Feature Learning on Point Sets in a Metric Space. Arxiv 2017.
18. Piazzese C, Carminati MC, Pepi M, Caiani EG: Statistical Shape and Deformation Analysis. Part Iii Appl 2017:445–480.
19. Bargiotas I, Mousseaux E, Yu W-C, et al.: Estimation of Aortic Pulse Wave Transit Time in MRI Using Complex Wavelet Cross-Spectrum Analysis. 2015 Comput Cardiol Conf Cinc 2015:725–728.
Figures