0096
Combining 4D balanced SSFP and 4D flow MRI for highly localized 3D pulse wave velocity calculations1Radiology and Nuclear Medicine, Amsterdam UMC, Amsterdam, Netherlands, 2Biomedical Engineering and Physics, Amsterdam UMC, Amsterdam, Netherlands
Synopsis
Keywords: Flow, Velocity & Flow, Aorta, Pulse wave velocity, Arterial stiffness
Motivation: To measure 3D pulse wave velocity (PWV) for the investigation of arterial stiffness on a local scale which could benefit patients with aortic disease.
Goal(s): To calculate aortic 3D PWV with the flow-area method and compare with the global method.
Approach: The flow-area method for PWV calculation is applied to 4D flow data combined with automatically-segmented 4D balanced SSFP scans along the thoracic aorta.
Results: This measurement is feasible and shows the expected trend of increasing PWV along the length of the aorta. Averaged values corresponded moderately with the global method.
Impact: Increased arterial stiffness measured by PWV is a well-established risk factor for adverse cardiac events. Development of novel MRI technology to locally map arterial stiffness may allow for improved risk-stratification in cardiovascular disease and ultimately guide therapy.
Introduction
Aortic stiffness is an important marker for aortic disease but is challenging to measure locally. Pulse wave velocity (PWV) is a proxy for stiffness and can be estimated from area and flow measurements directly1,2. The flow-area (QA) method allows for the estimation of PWV as the ratio between change in flow and change in cross-sectional area during the reflection-free period of the cardiac cycle1,2. The aim of this study was to measure local 3D PWV in the thoracic aorta by combining high resolution 4D flow and 4D bSSFP data.Methods
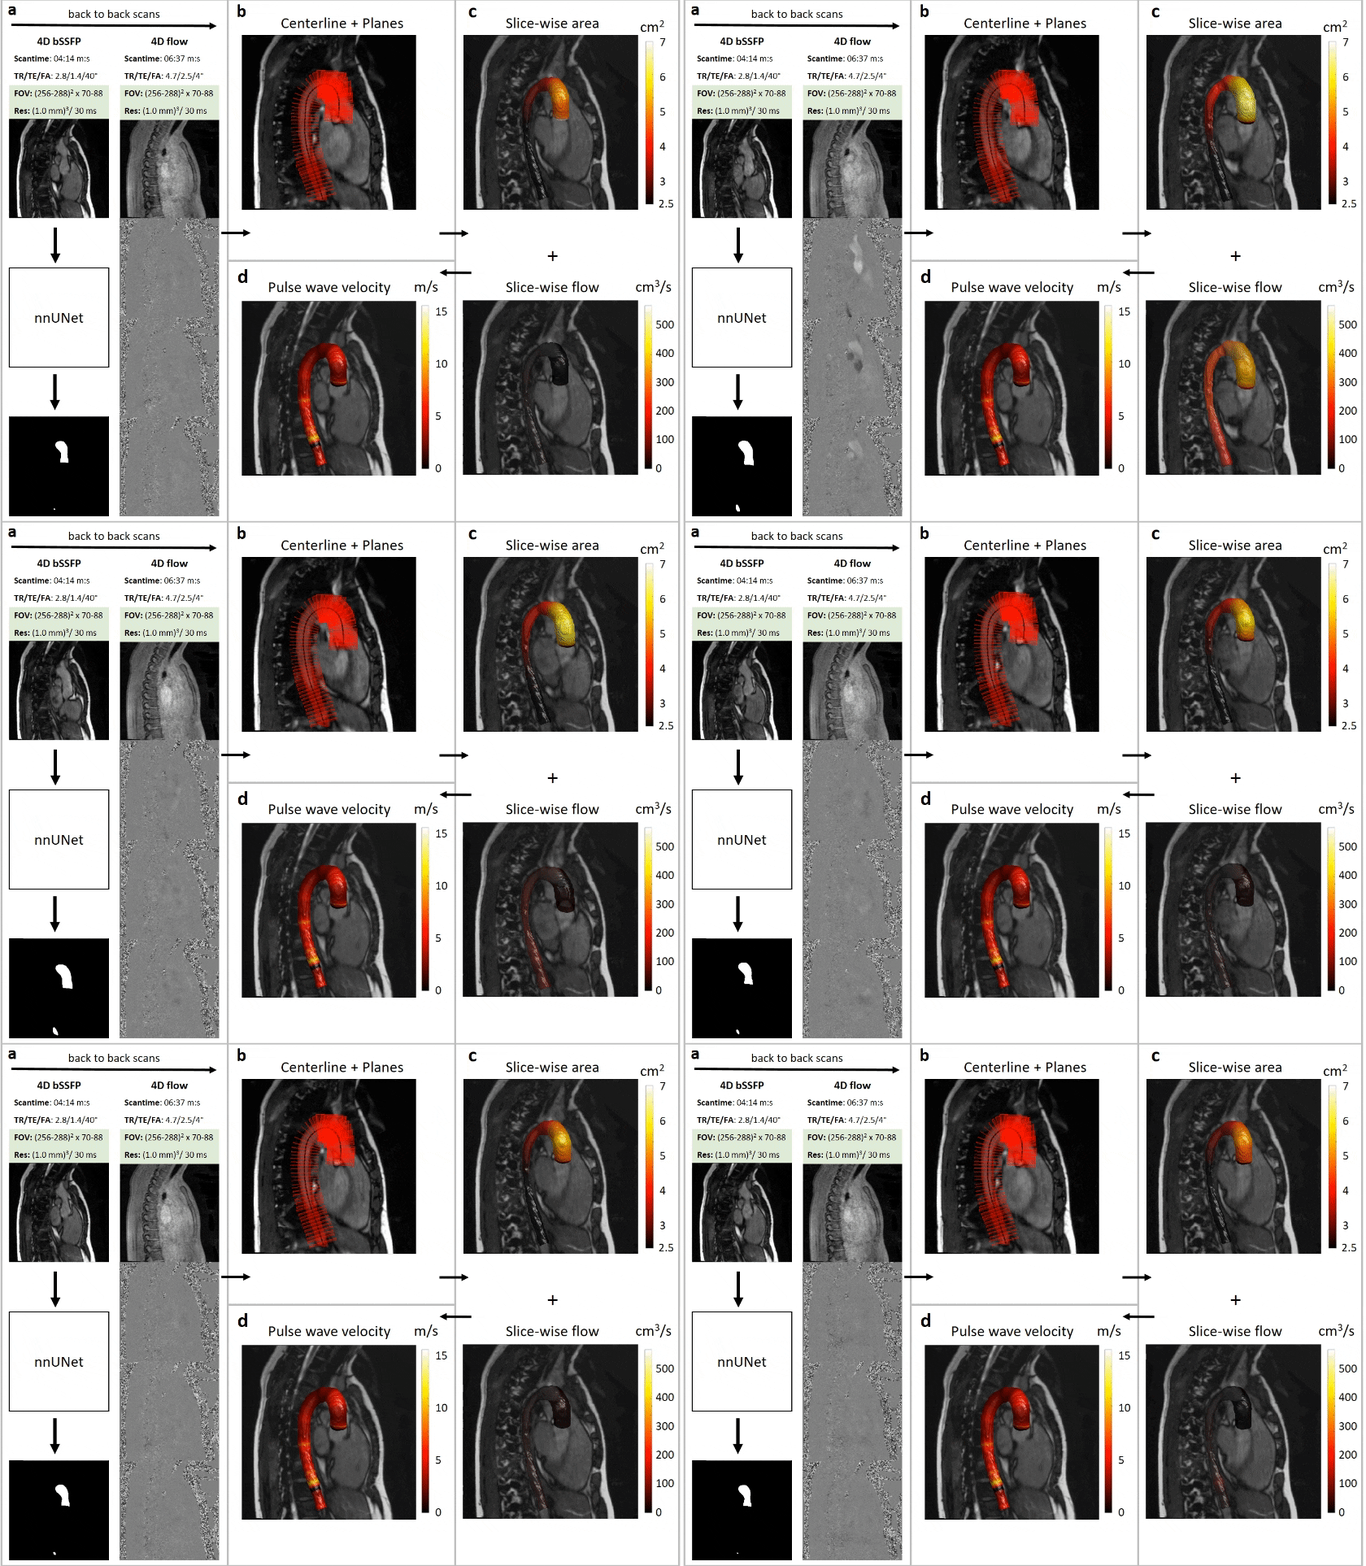
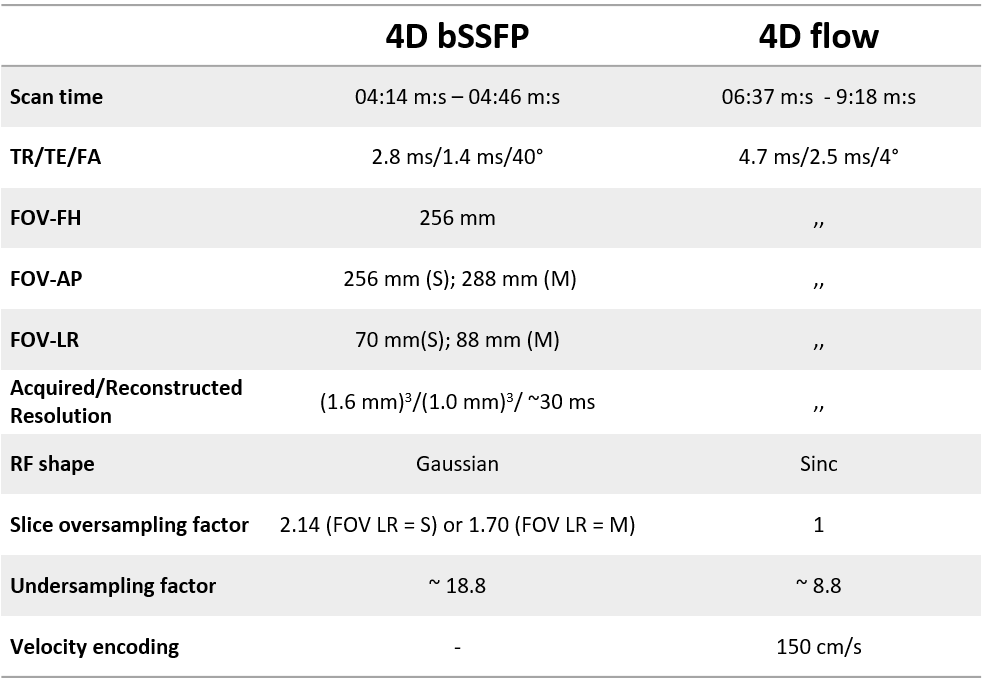
In seven volunteers a 4D bSSFP scan was acquired directly followed by a 4D flow scan with the same FOV. Both scans were reconstructed to the same spatiotemporal resolution of (1.0mm)3 and 30 cardiac phases (figure 1a, see specifics in table 1)3. An nnUNet trained on 84 manual segmentations from 14 healthy volunteers and 10 Marfan patients was used to automatically segment the thoracic aorta from the bSSFP volumes4.Using these 3D segmentations in combination with planes perpendicular to time-resolved, spline-smoothed centerlines, the change in area and flow over time can be calculated by overlaying them on the 4D flow scan (figure 1b-c).
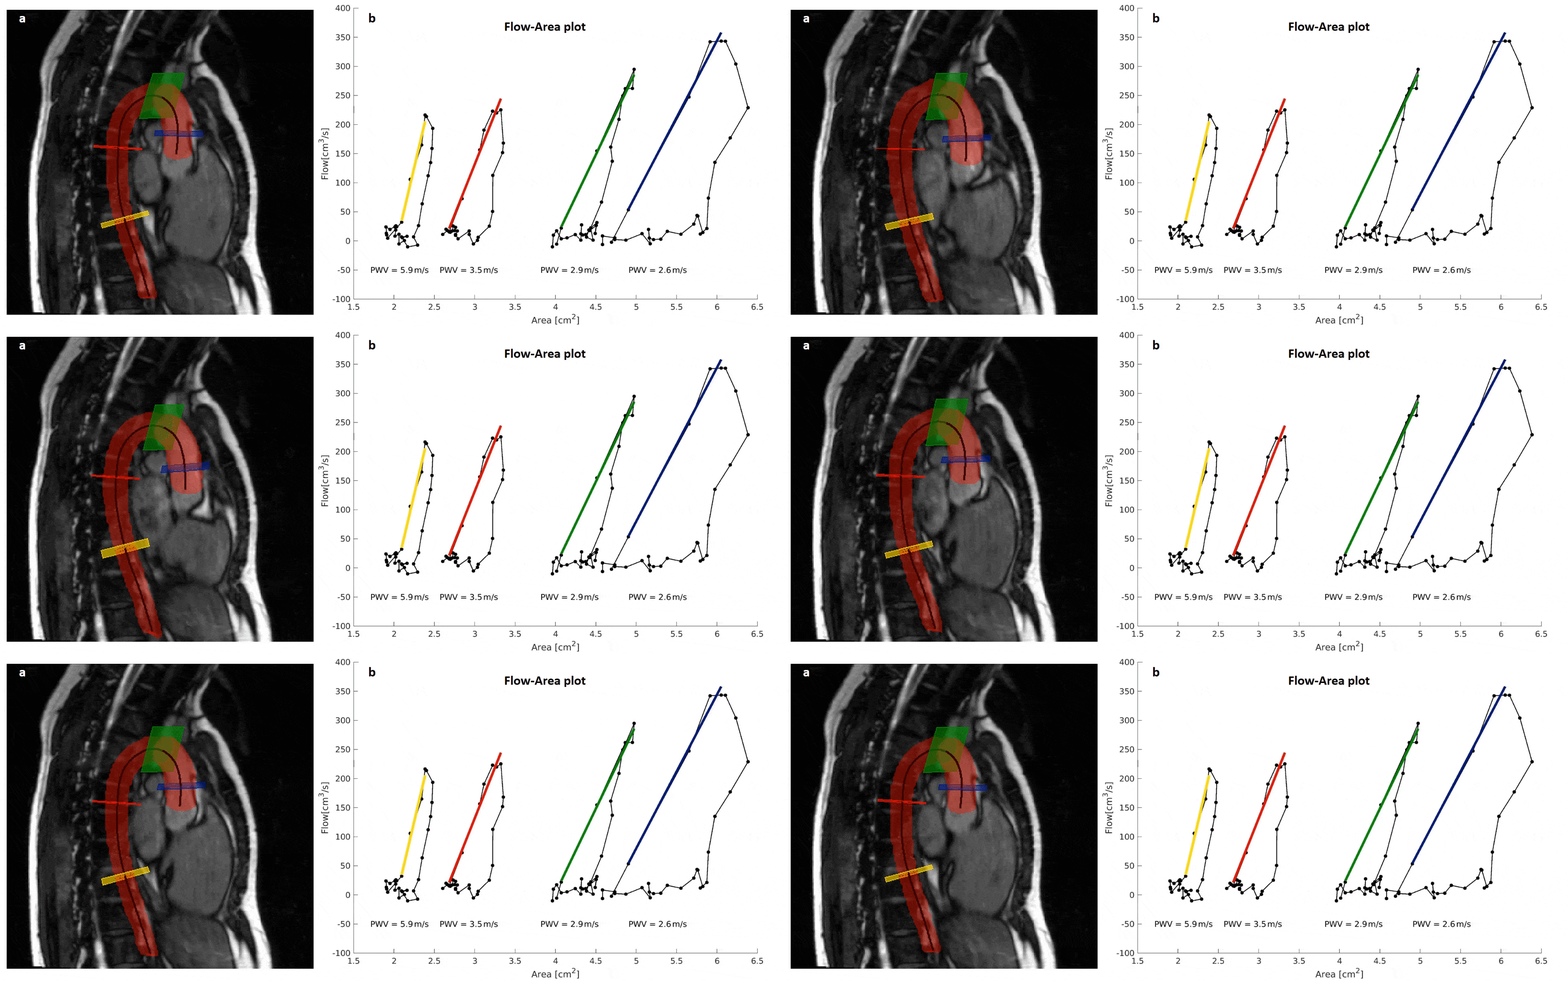
After plotting this flow against area for each cardiac frame, a linear regression model is used to estimate the upslope of the QA curve, which quantifies the PWV. The points used for this regression are determined automatically, starting from the latest timeframe with flow less than 30% of the maximum flow and ending with the timeframe with the highest flow. PWV is calculated in every plane and subsequently mapped on the aortic wall (figure 1d).
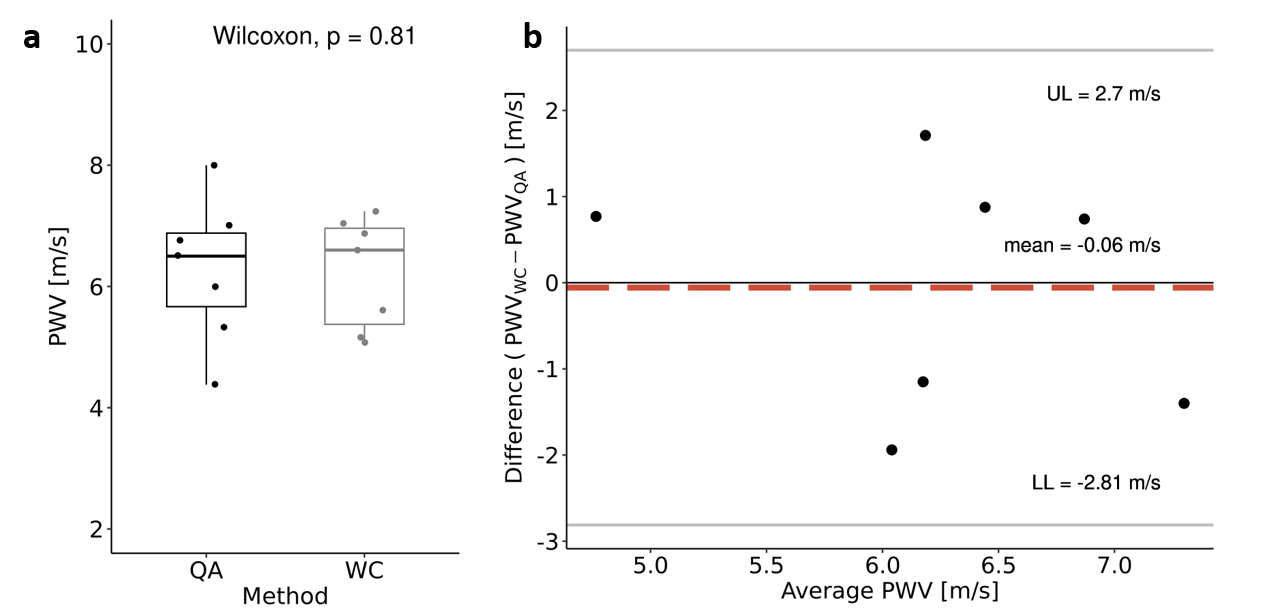
The spatially averaged PWV calculated using the proposed method (PWVQA) was compared (Wilcoxon rank sum test/Bland-Altman) with the global PWV calculated for the entire thoracic aorta using a wavelet cross-spectrum (WC) analysis method5 (PWVWC) using an open-source software tool as previously described by Bosshardt et al.6.
Results
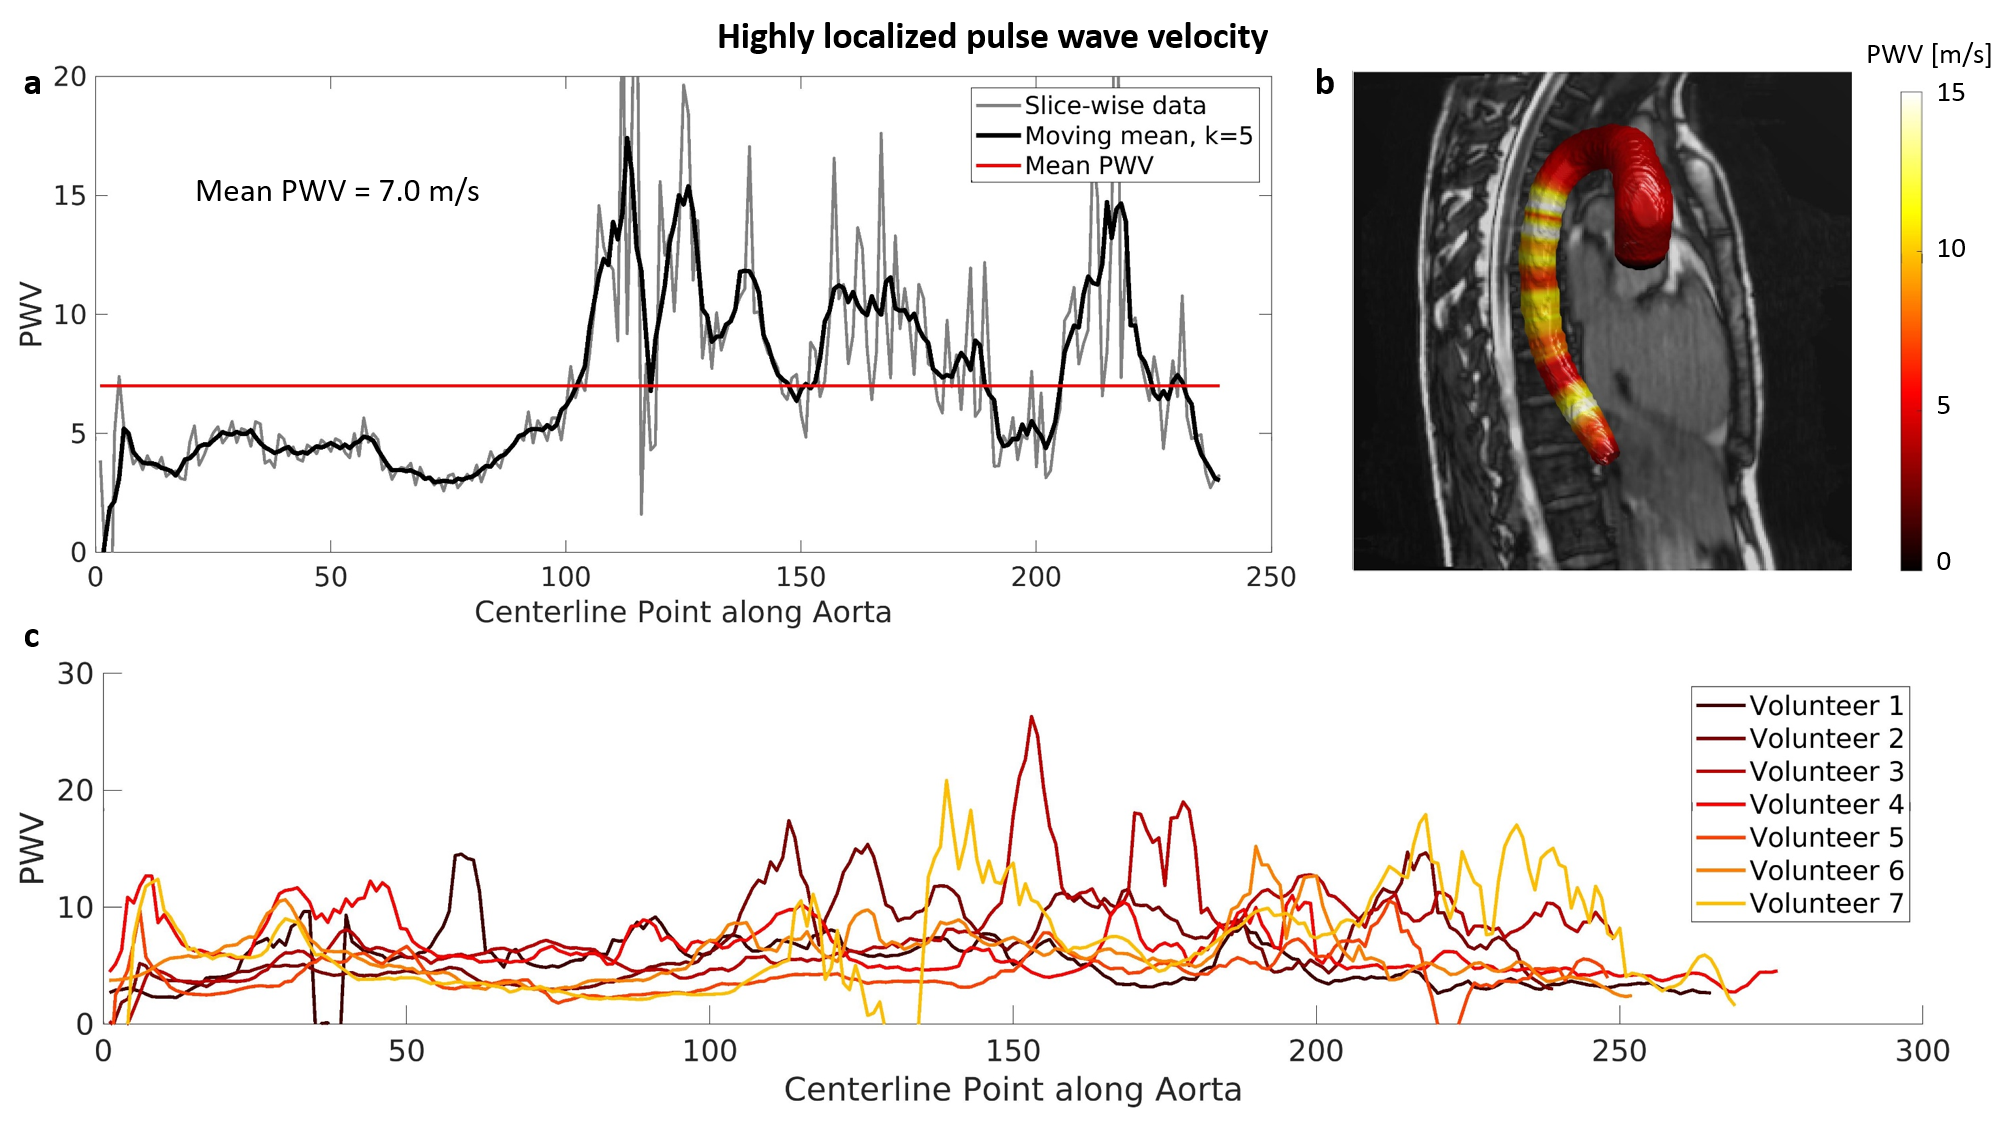
Figure 1b shows the segmentations with time-resolved centerlines and 1/5th of the perpendicular planes calculated for one example volunteer. In 1c the 4D area and flow are shown which are used to calculate the PWV map in 1d. Figure 2 shows the QA plots corresponding to four slices in the thoracic aorta of one volunteer with the corresponding PWV measures. Figure 3a and b show the PWVQA in a 2D plot and mapped onto the aortic wall for one example volunteer and 3c the moving averaged filtered PWV plots for all volunteers. The comparison of PWVQA with PWVWC can be found in figure 4 and shows no significant differences and no bias, but limits of agreements of ~2.8 m/s in the Bland-Altman graph.Discussion
The typical PWV in the thoracic aorta is about 5 m/s and increases, with distance from the heart, to about 15 m/s in the arteries of the lower leg7. The calculated PWVQA plots are largely within these limits, especially for the ascending aorta and arch, and seem to generally increase along the length of the aorta.The variability in PWV measurements is especially large for the descending aorta. A possible cause for this increase in variability is the decrease in the amplitude of area-change along the descending aorta which makes the regression of the QA plots potentially more vulnerable to small perturbations in the limited amount of flow/area values. An increase in temporal resolution could improve this. Another cause could be that the assumption of a reflection free period no longer holds by the time the flow wave reaches the descending aorta. The threshold of 30% of max flow was picked empirically for the determination of the first regression point, which is a limitation of this method.
No volunteer movement between 4D bSSFP and 4D flow was assumed and qualitatively checked on flow vs. segmentation graphs. This could in future work be improved by rigid registration of the peak systolic bSSFP segmentation to peak-systolic PCMRA based 4D flow segmentation.
The difference in PWV between the proposed QA method and the WC method, that are both positive and negative as can be seen in figure 4b, could (partly) be explained by the influence of “outliers”, visible as peaks in figure 3c, on PWVQA.
Conclusion
Combining 4D balanced SSFP and 4D flow MRI for highly localized 3D pulse wave velocity calculations is feasible, which was shown using dynamic flow and area maps. However, the resulting PWVQA maps show high variability around a sensible mean, especially in the descending aorta, and might require higher temporal resolution and further investigation to become more robust.Acknowledgements
This publication is part of the project Comprehensive Assessment of 4D Thoracic Aorta Biomechanics Using Novel Cardiac MRI Technology (project number 18402) of the research program Applied and Engineering Sciences, funded by the Dutch Research Council (NWO).References
1. Vulliemoz, S., Stergiopulos, N., Meuli, R., 2002. Estimation of local aortic elastic properties with MRI. Magnetic Resonance in Medicine 47, 649–654.
2. Rabben SI, Stergiopulos N, Hellevik LR, et al. An ultrasound-based method for determining pulse wave velocity in superficial arteries. J Biomech. 2004 Oct;37(10):1615-22. doi: 10.1016/j.jbiomech.2003.12.031. PMID: 15336937.
3. Merton R, Bosshardt D, Strijkers GJ, Nederveen AJ, van Ooij P, Schrauben EM. Improving robustness of 3D cine bSSFP at 3 T. Global CMR 2024 joint meeting; Accepted.
4. Merton R, Bosshardt D, Strijkers GJ, Nederveen AJ, Schrauben EM, van Ooij P. 4D aortic motion maps from isotropic high-resolution 3D CINE balanced steady state free precession at 3T and automated segmentations. Joint Annual Meeting ISMRM-ESMRMB & ISMRT 32st Annual Meeting; Toronto, Canada. 2023. 0544
5. Bargiotas I, Mousseaux E, Yu WC, Venkatesh BA, Bollache E, de Cesare A, et al. Estimation of aortic pulse wave transit time in cardiovascular magnetic resonance using complex wavelet cross-spectrum analysis. J Cardiovasc Magn Reson. 2015;17(1):65.
6. Bosshardt D, van Andel, MM, Merton R, et al. Repeatability of whole aorta 4D flow pulse wave velocity in healthy volunteers and comparison with Marfan Syndrome patients. Joint Annual Meeting ISMRM-ESMRMB & ISMRT 32st Annual Meeting; Toronto, Canada. 2023. 0932.
7. Hoskins PR, Lawford PV, Doyle BJ. Cardiovascular Biomechanics. Cham (Switzerland): Springer Nature; 2017: 1–462.
Figures