0093
Evaluation of Aortic Hemodynamics Using Four-Dimensional Flow of Magnetic Resonance Imaging in Rabbits with Liver Fibrosis1Department of Radiology, The Affiliated Hospital of Southwest Medical University, Lu Zhou, China, 2School of Public Health, Southern Medical University, Guangzhou, China, 3Clinical Science, Philips Healthcare, Chengdu, China
Synopsis
Keywords: Flow, Cardiovascular
Motivation: Hepatic fibrosis impacts systemic blood flow.
Goal(s): In this rabbit study, we tracked aortic hemodynamics during fibrosis development.
Approach: Thirty rabbits underwent biweekly 4D cardiac magnetic resonance (CMR) scans for 14 weeks post-bile duct ligation (BDL).
Results: Results revealed significant increases in wall shear stress, energy loss, and most aortic parameters at each plane by the 2nd week after bile duct ligation (BDL), peaking at the 6th week (p < 0.05). Liver fibrosis appeared at the 2nd, 4th, and 6th weeks post-BDL, corresponding to grades F2, F3, and F4. Plane 2's relative pressure difference strongly correlated with fibrosis severity (R=0.86).
Impact: The occurrence of liver fibrosis could increase WSS, EL, RPD and other hemodynamic parameters of aorta as early as the second week following BDL, which can be detected by 4D flow MRI.
Introduction
Liver fibrosis (LF) poses a significant public health challenge due to its prevalent occurrence 1. It undermines liver architecture and hampers cellular microcirculation, often leading to severe conditions like cirrhosis and liver failure2. Beyond the liver, fibrosis provokes cardiovascular disruptions, such as increased blood volume and vascular resistance3. This study aimed to fill that gap by observing aortic hemodynamic changes during LF onset and progression in bile duct-ligated rabbits, providing non-invasive insight into abnormal aortic dynamics. Additionally, this study sought to correlate intra-aortic blood flow shifts with LF severity and use four-dimensional (4D) flow magnetic resonance parameters for risk stratification of LF-induced aortic hemodynamic alterations.Methods
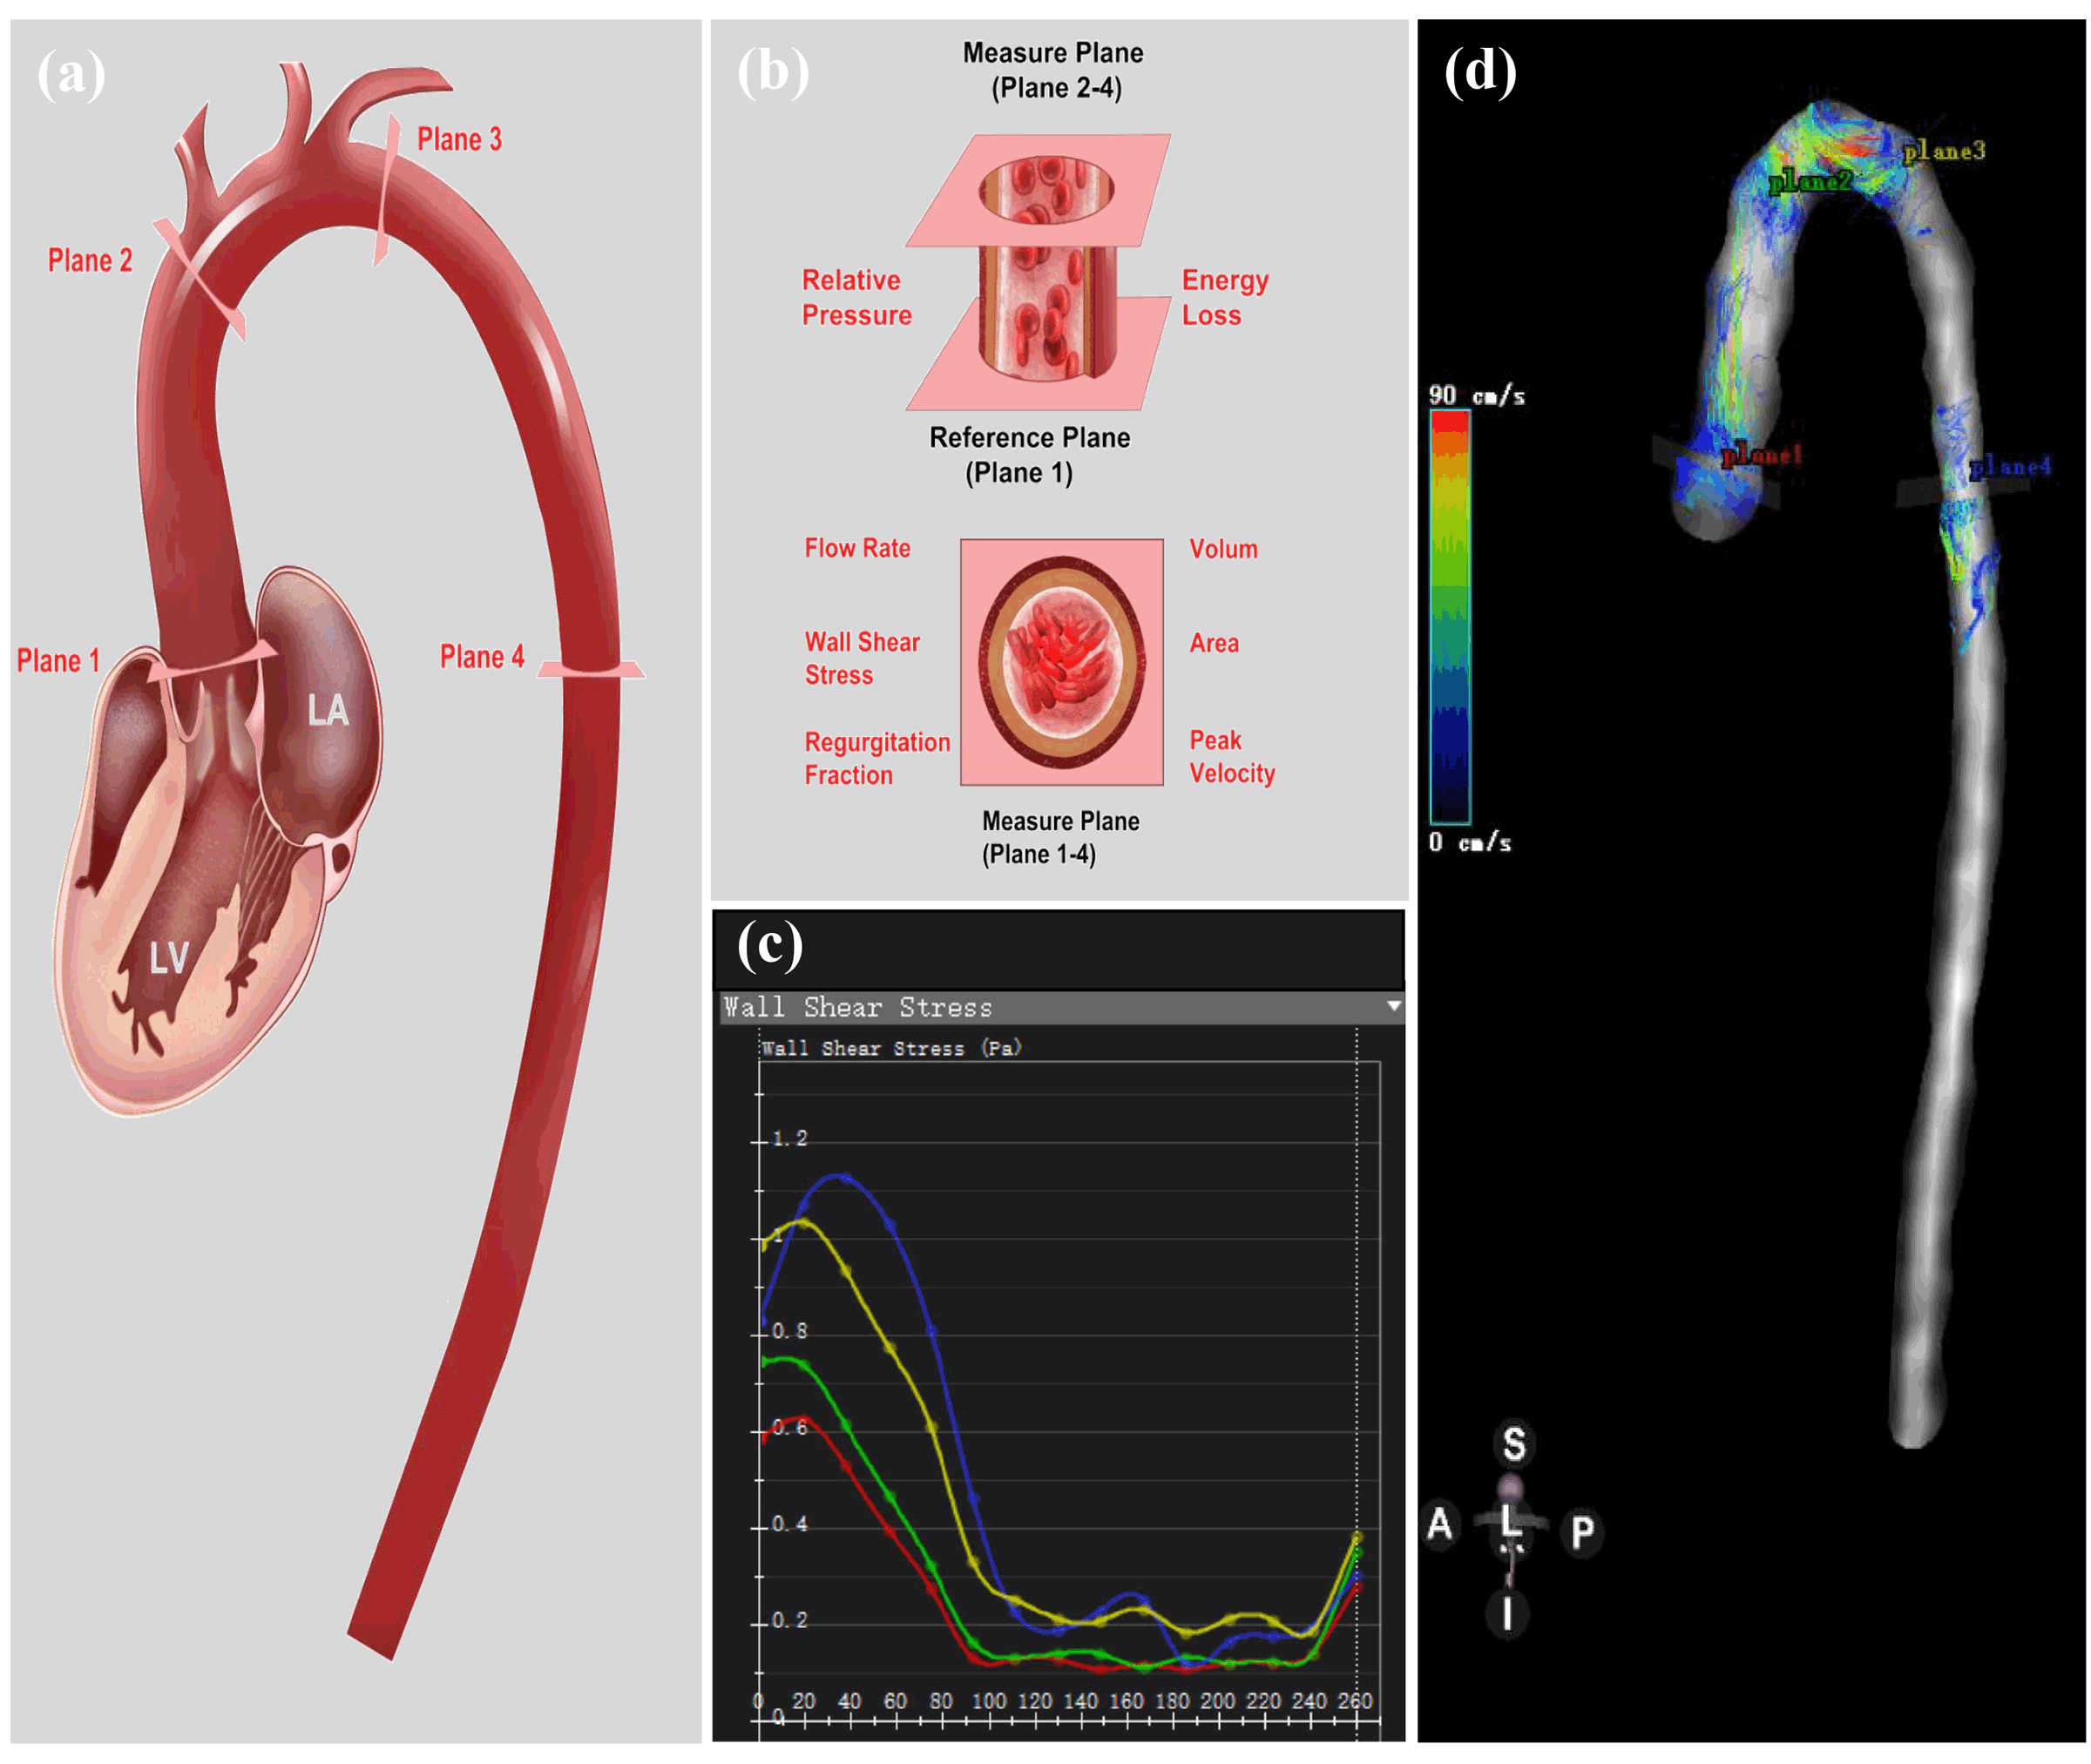
This study was approved by the institutional ethics committee. Thirty rabbits underwent biweekly 4D cardiac magnetic resonance (CMR) scans for 14 weeks post-bile duct ligation (BDL). CMR examinations were performed on a 3.0 T Tesla scanner (MAGNETOM Prisma, Siemens Healthineers, Erlangen, Germany) with an 18-channel abdominal coil. Four-dimensional flow was performed with the scan parameters listed as follows: echo time = 3.3 ms; echo spacing = 6.3 ms; repeat time = 25.3 ms; field of view size = 88 mm × 36 mm × 134 mm; spatial resolution = 1.3 × 1.3 × 3.0 mm3; segments = 1; velocity encoding = 80 cm/s in all three velocity encoding directions. Histopathological exams for random 2 to 5 rabbits of liver and aorta tissues followed each CMR scan. The study recorded 4D flow parameters at four aorta sections as shown in Figure 1 (aortic sinus, before and after bifurcation of aortic arch, and descending aorta). The linear mixed model method was used to estimate the differences of 4D flow parameters among different weeks and the relationship between the variation law of each parameter and the number of weeks. This study identified early CMR markers, sensitive biomarkers, and threshold values for 4D flow parameters indicating hemodynamic changes due to liver fibrosis and correlated them with fibrosis progression.Results
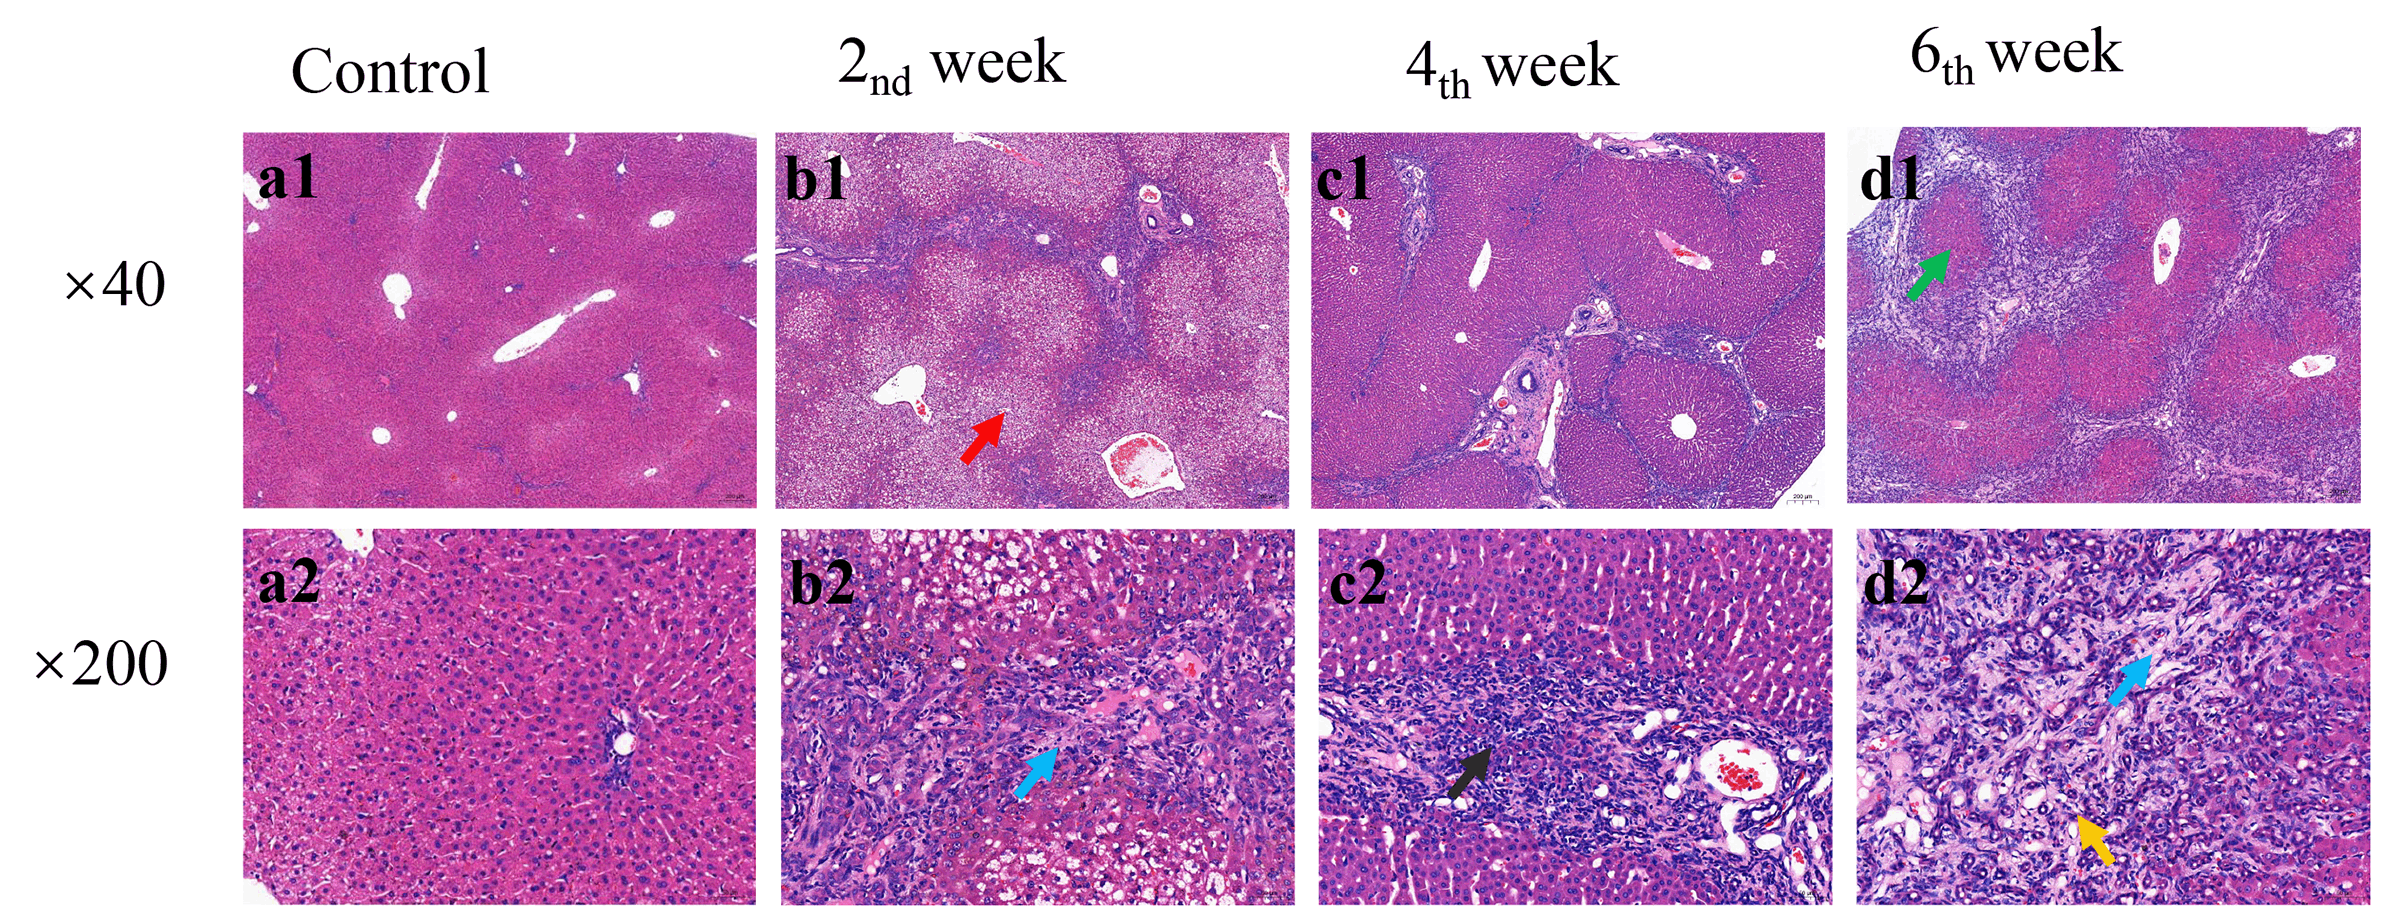
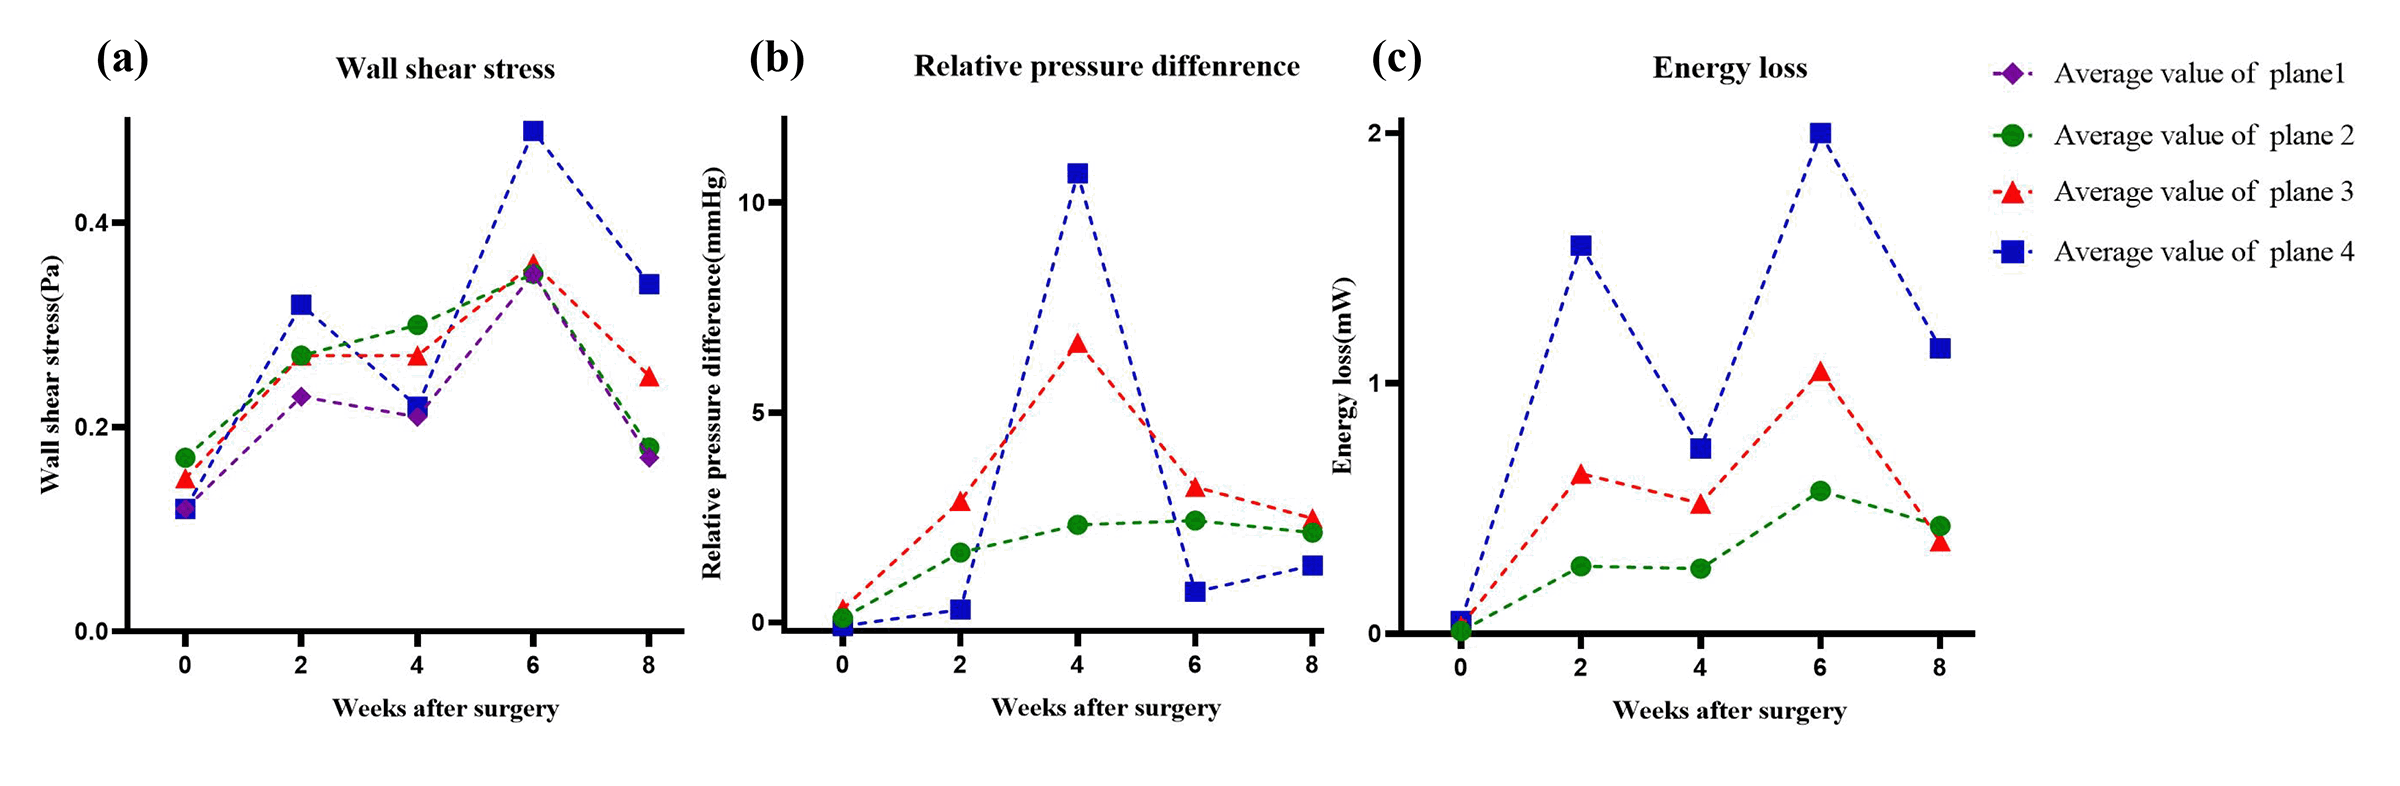
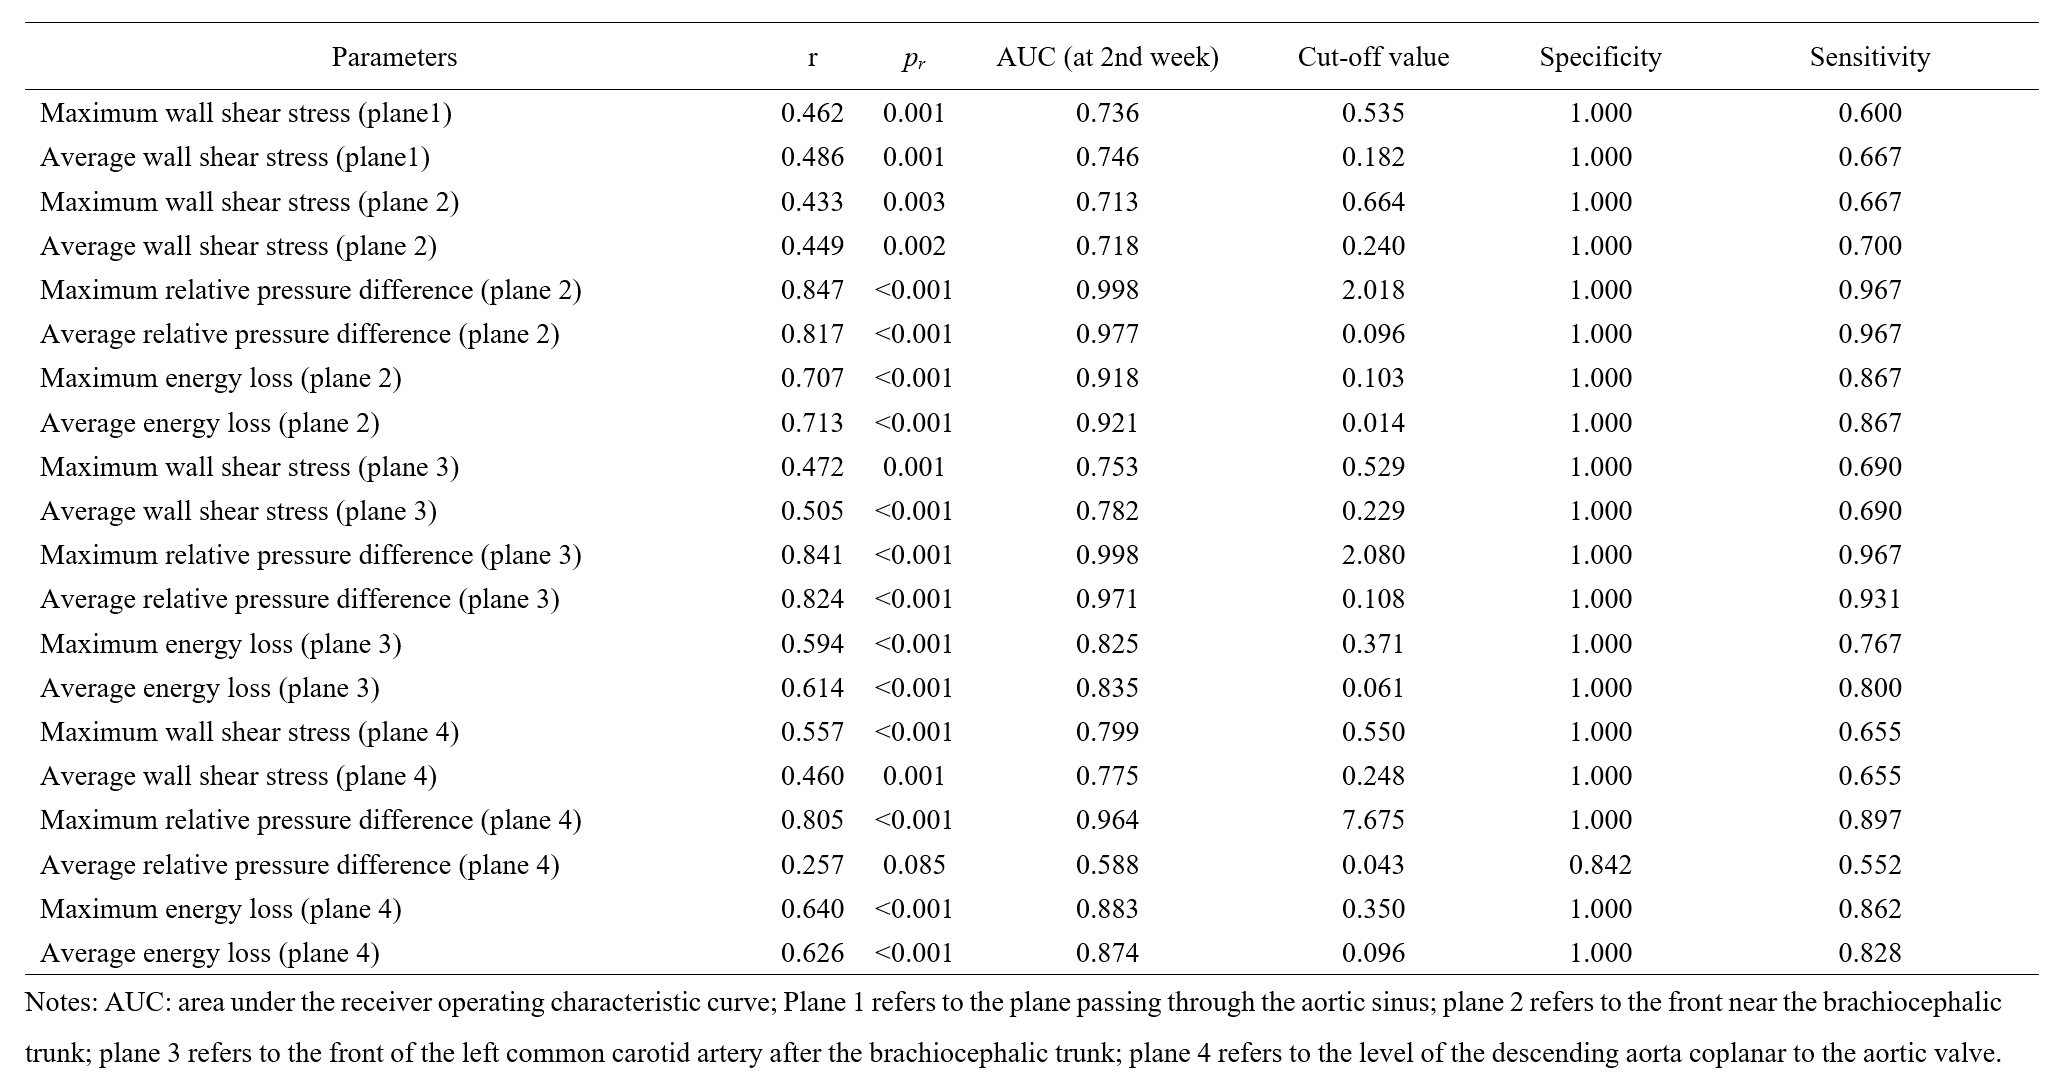
The rabbit counts at various post-surgery time points were: 0 weeks (25), 2 weeks (19), 4 weeks (8), 6 weeks (4), 8 weeks (3), 10 weeks (2), 12 weeks (2), and 14 weeks (1). Liver fibrosis was found at the 2nd, 4th, and 6th week after BDL, with grade F2, F3, and F4, respectively (Figure 2). Following BDL, the wall shear stress (WSS), energy loss (EL) and most general parameters of aorta significantly increased at the 2nd week for each plane (p < 0.05), and reached peak at the 6th week. So did the relative pressure difference (RPD) in plane 2 (Figure 3). The area under the ROC curve values for the advanced parameters from the 2nd week after surgery ranged from 0.71 to 0.99. Notably, the RPD of aorta plane 2 had the highest AUC value of 0.99, with a cutoff of 0.096 mmHg, a sensitivity of 0.976, and a specificity of 1.0 (Table 1). Additionally, the RPD in planes 2-4 displayed correlation coefficients ranging from 0.81 to 0.85 (p < 0.05), with plane 2 featuring the highest correlation coefficient. These findings underscore the significance of measuring plane 2 in aortic assessment and the outstanding capability of RPD in plane 2 for detecting aortic injury.Conclusion
In this study, aortic hemodynamic changes caused by LF were earlier than the pathological aortic atherosclerotic changes, which could be detected by a non-invasive 4D flow CMR scan. To facilitate and simplify follow-up and monitoring, RPD at aortic plane 2 (anterior plane of aortic arch bifurcation) can be focused, and the heavier the fibrosis, the greater this parameter.Acknowledgements
None.References
1. Nascimento M, Piran R, Da Costa RM, et al.: Hepatic injury induced by thioacetamide causes aortic endothelial dysfunction by a cyclooxygenase-dependent mechanism. Life Sciences 2018; 212:168–175.
2. Bataller R, Brenner DA: Liver fibrosis. J Clin Invest 2005; 115:209–218.
3. Park J, Kim G, Kim H, et al.: The association of hepatic steatosis and fibrosis with heart failure and mortality. Cardiovasc Diabetol 2021; 20:197.
Figures