0088
Fluid-Physics Informed Deep-Learning Enabled 2-point Velocity Encoded 4D flow MRI1Northwestern University, Chicago, IL, United States
Synopsis
Keywords: Flow, Velocity & Flow, Deep-Learning
Motivation: 4D Flow MRI enables comprehensive hemodynamic assessments, but its clinical usage is hindered by long scan times.
Goal(s): To enable a 2-point velocity encoded 4D flow MRI by using deep-learning to estimate the missing two velocity vector-components, reducing scan time by 50%.
Approach: Convolutional neural networks (CNNs) were trained with a single velocity vector-component as input data to generate a 3D velocity vector field (complete 4D flow dataset). CNN performance was evaluated in peak velocity, net and peak flow, and Qp/Qs compared to standard 4D flow MRI.
Results: AI-derived 4D flow MRI showed strong-to-excellent agreement to standard 4D flow MRI across all comparisons.
Impact: This technique enables reduction of 4D flow MRI scan time and data acquired by 50%. Future work will focus on coupling our method with conventional imaging acceleration techniques to achieve greater scan time reductions and/or improvements in temporal resolution.
Introduction
4D flow MRI measures 3D+time blood flow dynamics, enabling comprehensive hemodynamic evaluation. Conventional 4D flow MRI uses a 4-point velocity encoding (1 reference + 3 velocity sensitive scans: Vx, Vy, Vz), resulting in long scan times and limiting its clinical usage. Recently, a 25% scan time reduction was achieved by 3-point velocity encoding, using a deep-learning approach to derive the reference scan from the acquired velocity sensitive data[1]. Our goal is to build on this concept to derive 4D flow MRI from a 2-point encoding (reference + one encoding direction Vi, i = x,y, or z), using a fluid-physics informed convolutional neural network (CNN) to reproduce the two missing velocity components, reducing scan time by 50%.Methods
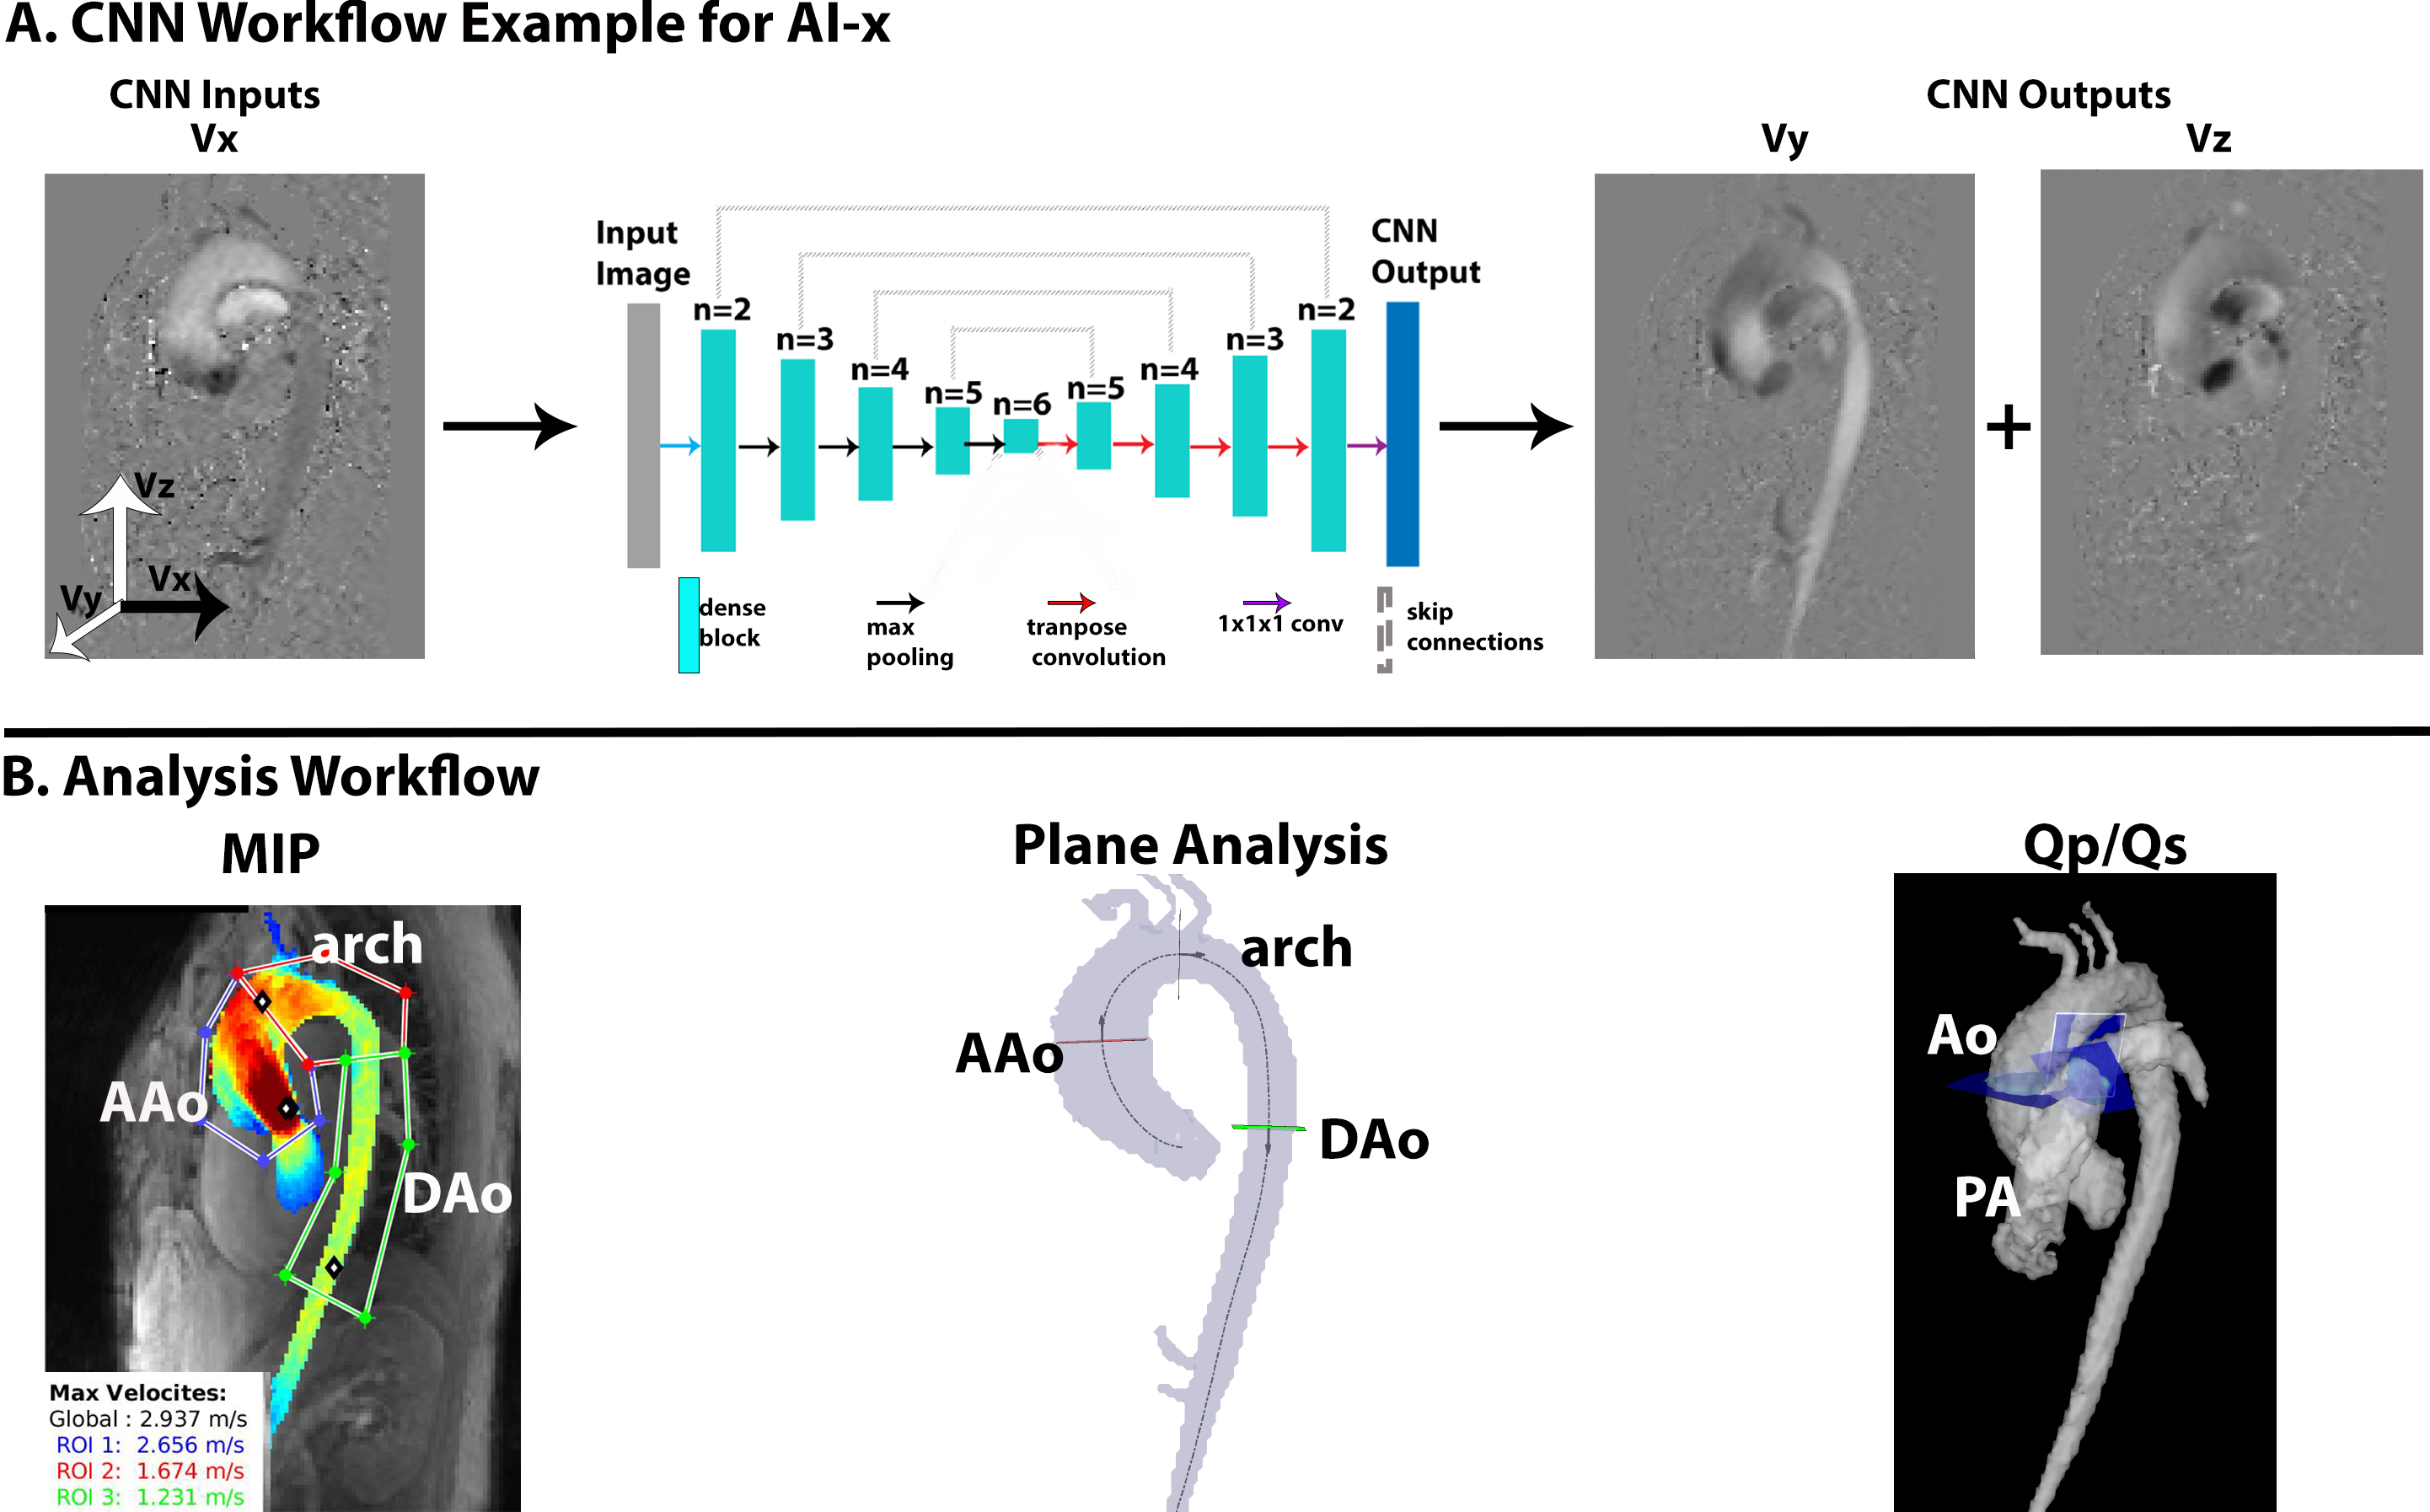
This retrospective study used N=420 bicuspid aortic valve patients (49[39-61] years; 302M) with conventional 4-point encoding 4D flow MRI acquired on either 1.5T or 3T systems (Siemens, Erlangen, Germany). The sequence parameters were: spatial resolution=1.78-2.75x1.78-2.75x2.4–5.00mm3, temporal resolution=32.8-40.8ms, TE=2.06–2.58, venc=150-500cm/s. All 4D flow data underwent eddy current corrections, noise masking, anti-aliasing, and 3D aortic segmentation[2]. Each vector-component (Vx, Vy, Vz) was used independently to simulate a 2-point 4D flow acquisition and used as input data to the CNN, which derives the other two velocity vector-components (Figure-1A). Three separate CNNs were trained for each vector-component to determine which acquisition would most accurately reproduce a 4-point encoding 4D flow dataset (ground-truth data). 360 datasets were used for training and 60 for testing.A conditional Generative-Adversarial Network was implemented with a 3D Dense-UNet as the generator[2-4]. To account for the principles of fluid physics, we incorporated elements of the Navier-Stokes equations into the loss function, aiming to reproduce the conservation of momentum and mass (divergence-free criteria) found in the 4D flow ground-truth. For the conservation of mass, a velocity divergence loss was implemented as:
$$DivergenceLoss=\frac{1}{X*Y*Z}\sum_{x=1}^{X}\sum_{y=1}^{Y}\sum_{z=1}^{Z}((\frac{dV_{x}^{gt}}{dx}-\frac{dV_{x}^{ai}}{dx})^{2} +(\frac{dV_{y}^{gt}}{dy}-\frac{dV_{y}^{ai}}{dy})^{2}+(\frac{dV_{z}^{gt}}{dz}-\frac{dV_{z}^{ai}}{dz})^{2})\;\;\;\;\;(1)$$
V: velocity vector field, X: height, Y: width, Z: depth, gt: ground-truth, ai: AI-derived.
For the conservation of momentum, the material derivative was calculated using equation-2 and incorporated in the loss function (3):
$$\frac{DV}{Dt}=\frac{\partial V}{\partial t}+(\nabla*V)V \;\;\;\;\;(2)$$
$$MaterialDerivativeLoss=MSE(\frac{DV_{gt}}{Dt},\frac{DV_{ai}}{Dt}) \;\;\;\;\;(3)$$
For the outputs, AI-x refers to the 4D flow-acquired Vx (input) and AI-derived Vy and Vz (output) [Figure-1A]; AI-y as the 4D flow-acquired Vy (input) and AI-derived Vx and Vz (output); and AI-z as the 4D flow-acquired Vz (input) and AI-derived Vx and Vy (output).
Figure-1B illustrates the analysis workflow. Peak velocities in ascending (AAo), arch, and descending aorta (DAo) were derived using region of interests on systolic maximum intensity projections (MIPs). Peak and net flow were derived using 2D plane analysis in the same regions. Qp/Qs were calculated from the net flow of the AAo and main pulmonary arteries (PA) in a subset of 21 testing datasets. Voxel-wise and hemodynamics comparisons between the AI-derived velocities and 4D flow ground-truth were performed using Bland-Altman analysis, reported as the bias±limits of agreement (LOA). A paired t-test or Wilcoxon signed-rank test (for non-parametric data) was performed to determine statistical significance (p<0.05).
Results
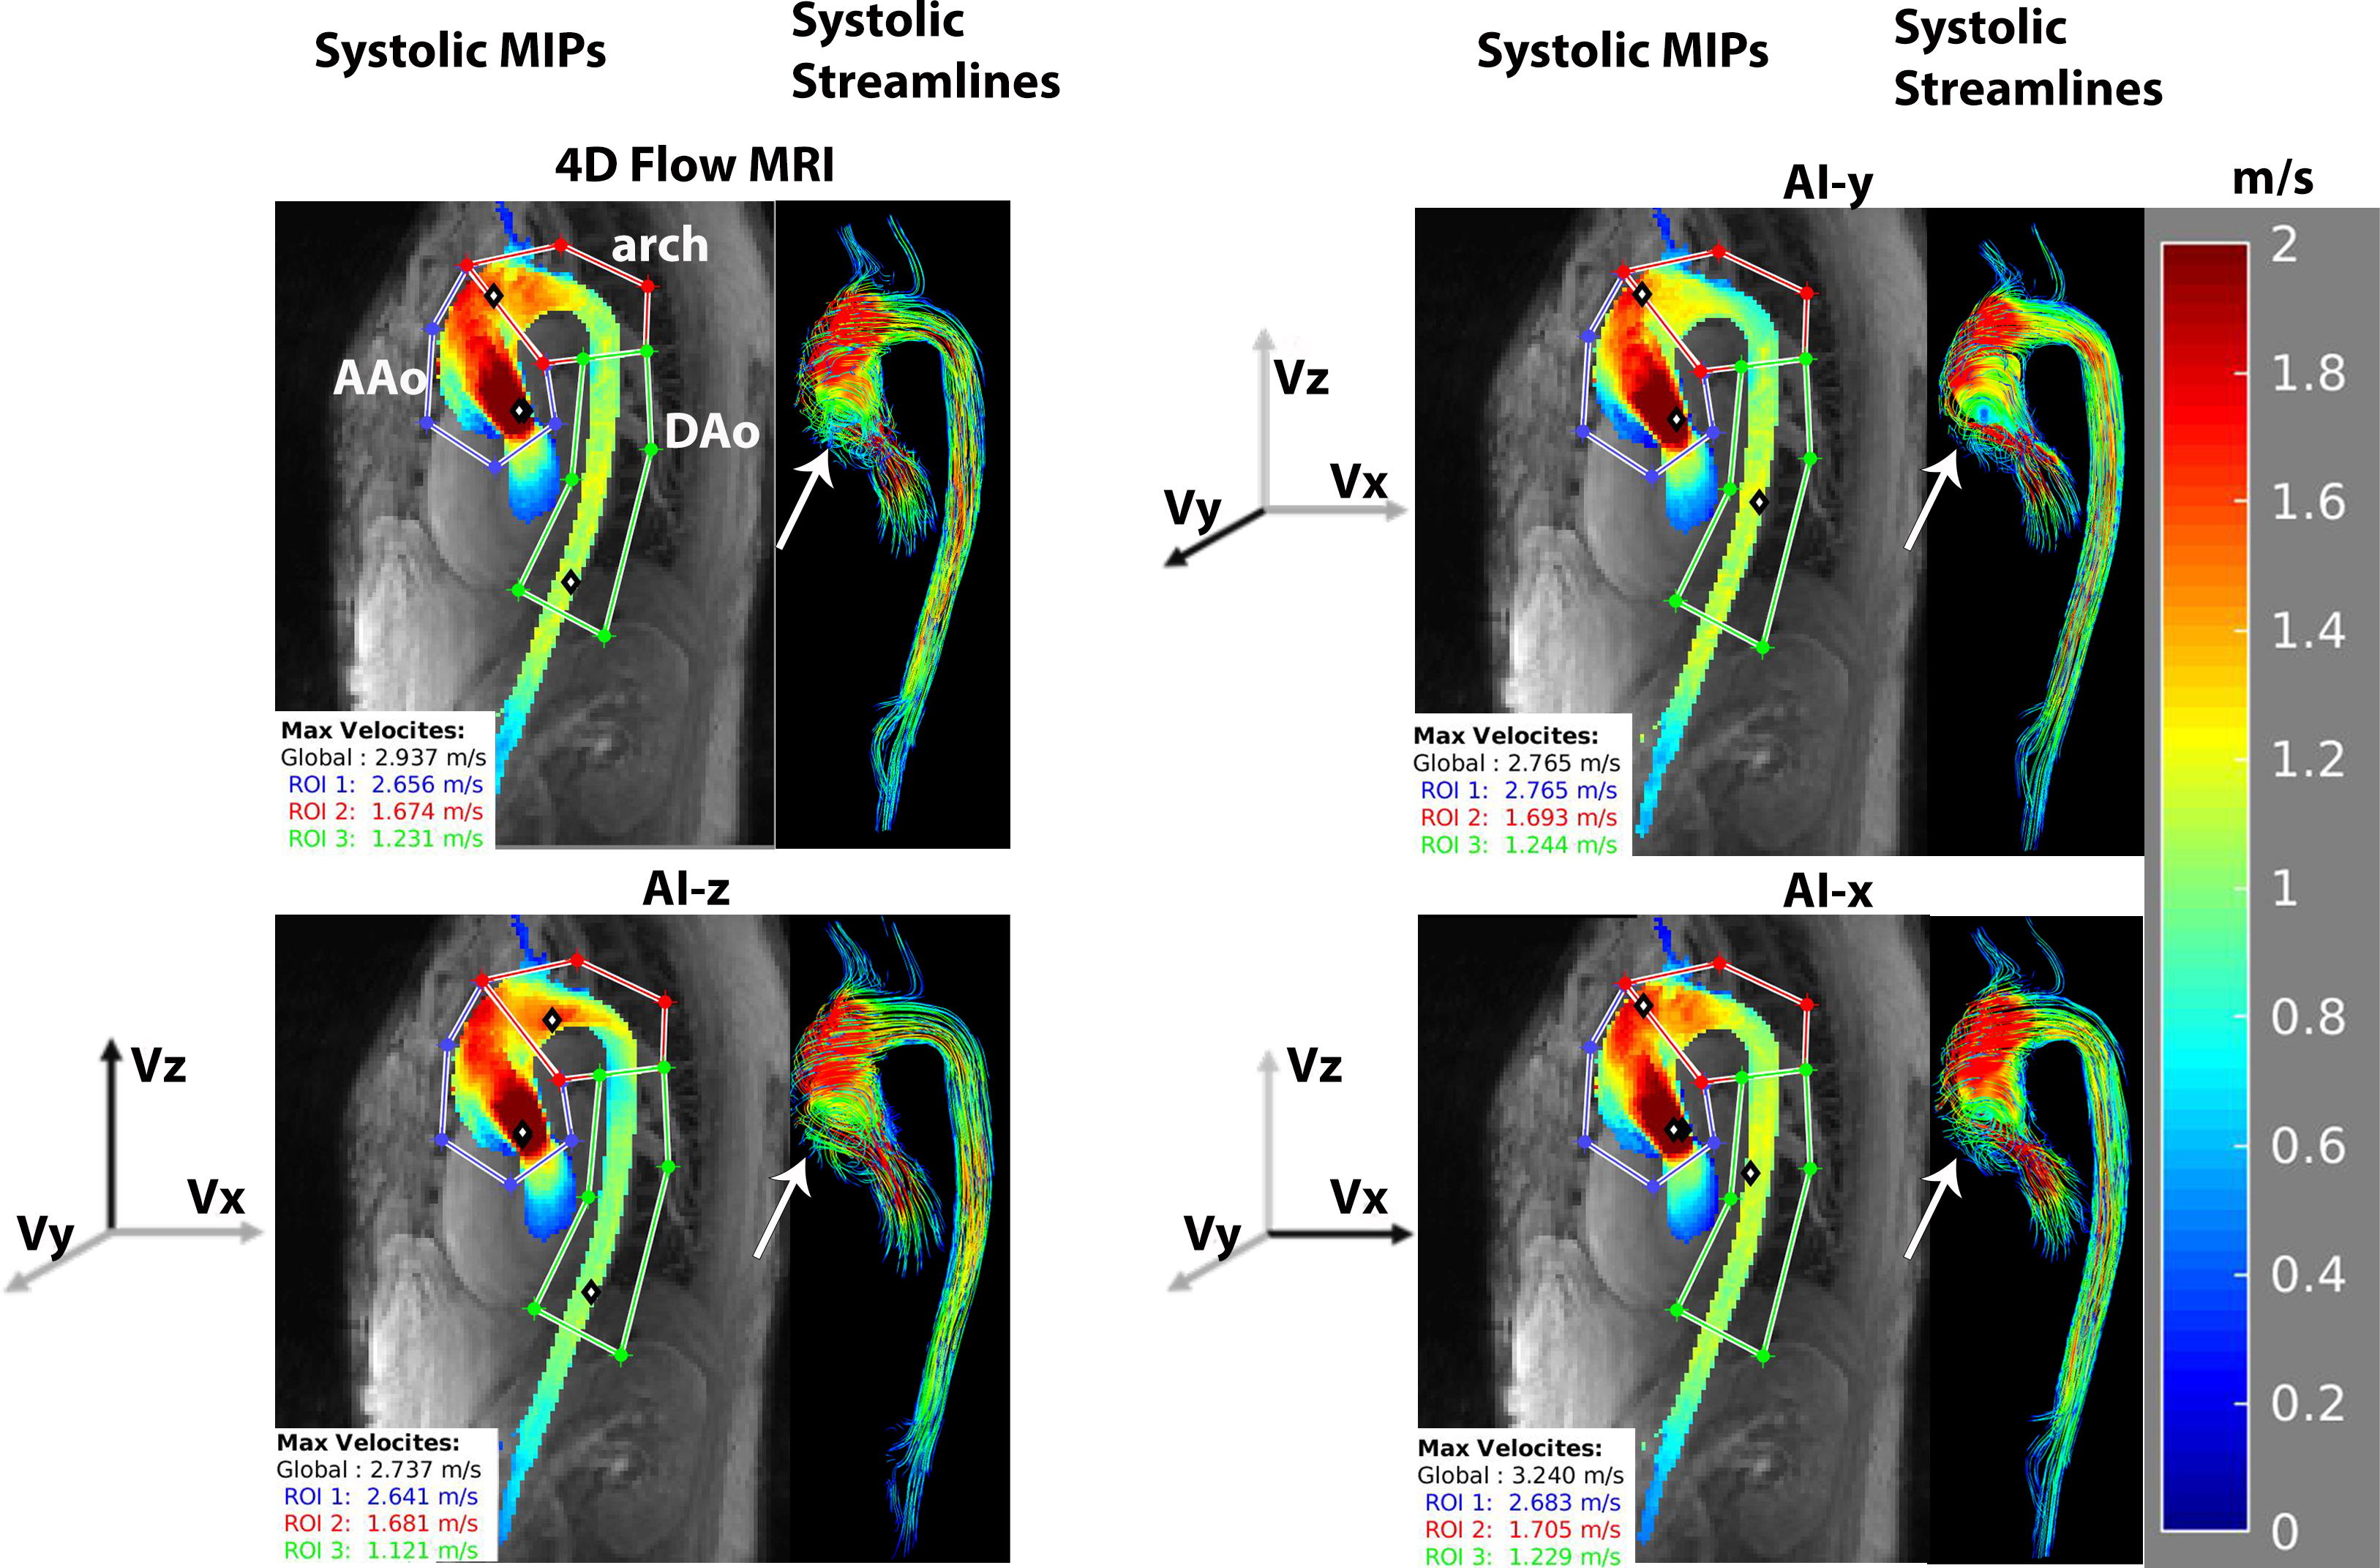
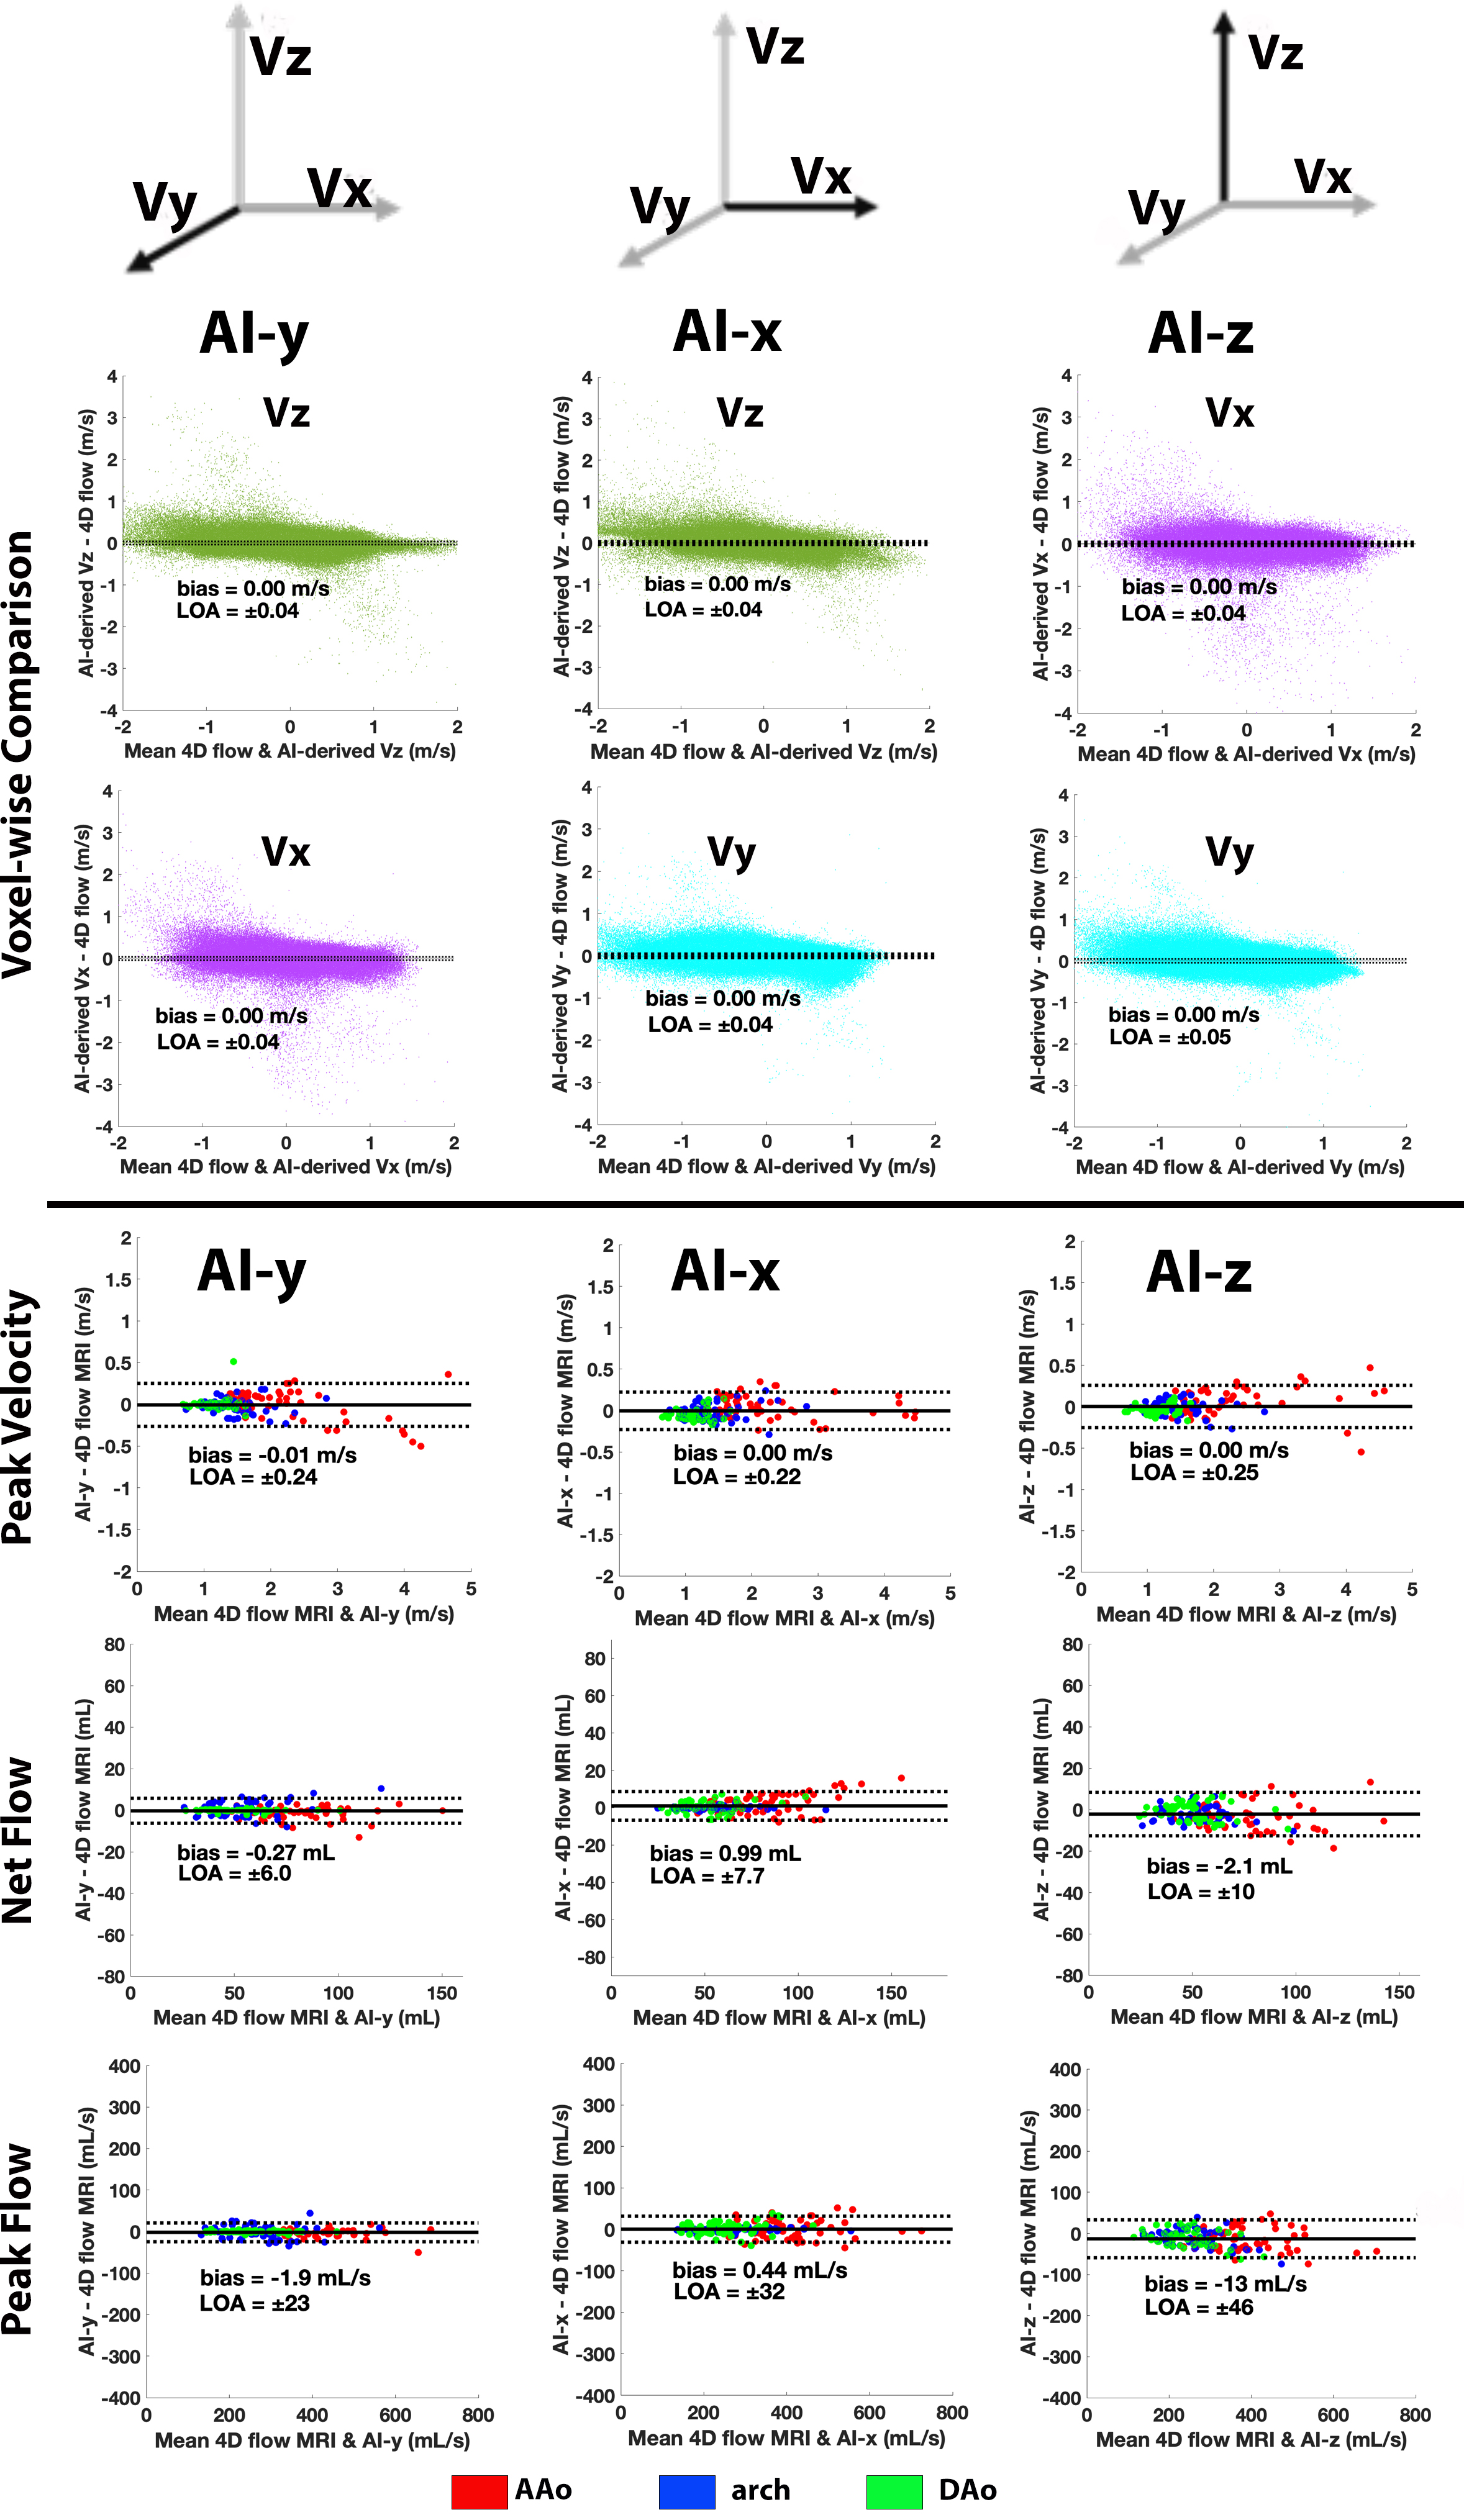
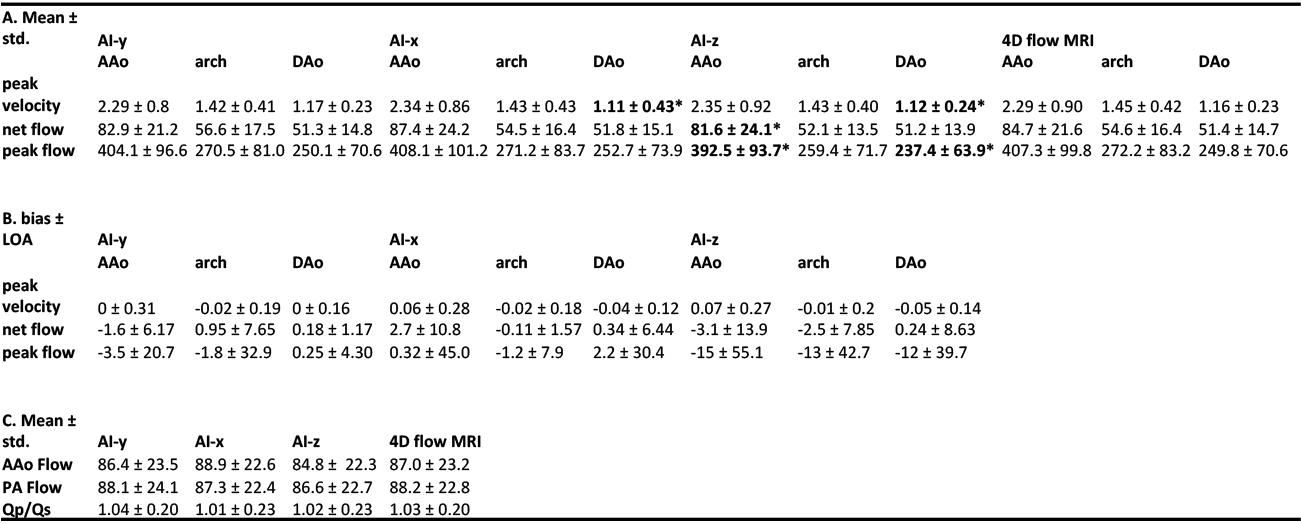
Figure-2 provides examples of the systolic MIPs and 3D streamlines for the 4D flow ground-truth and AI-derived velocities (AI-x, AI-y, AI-z). Generally, we observed excellent agreement in velocity patterns, including the helical flow pattern in the AAo. This is further seen in Figure-3 which shows the Bland-Altman results for voxel-wise comparisons and hemodynamic quantifications. The voxel-wise comparison showed excellent agreement with LOA ±0.04-0.05 m/s for all AI-derived velocities. This trend continues for peak velocity (Table-1). While AI-x and AI-z showed significant differences in the DAo, LOA were strong-excellent showing a 10-14% difference.Greater discrepancies between the AI-derived velocities were found in peak and net flow (Table-1). AAo and DAo showed strongest agreement in AI-y while the arch agreed most in AI-x. This is likely because regional flow is primarily driven by a single velocity vector-component (AAo, DAo by Vy, arch by Vx) which are shared in the CNN-outputs and 4D flow ground-truth. Generally, all AI-derived velocities showed strong-excellent agreement compared to 4D flow MRI, with LOA showing 2-16% difference.
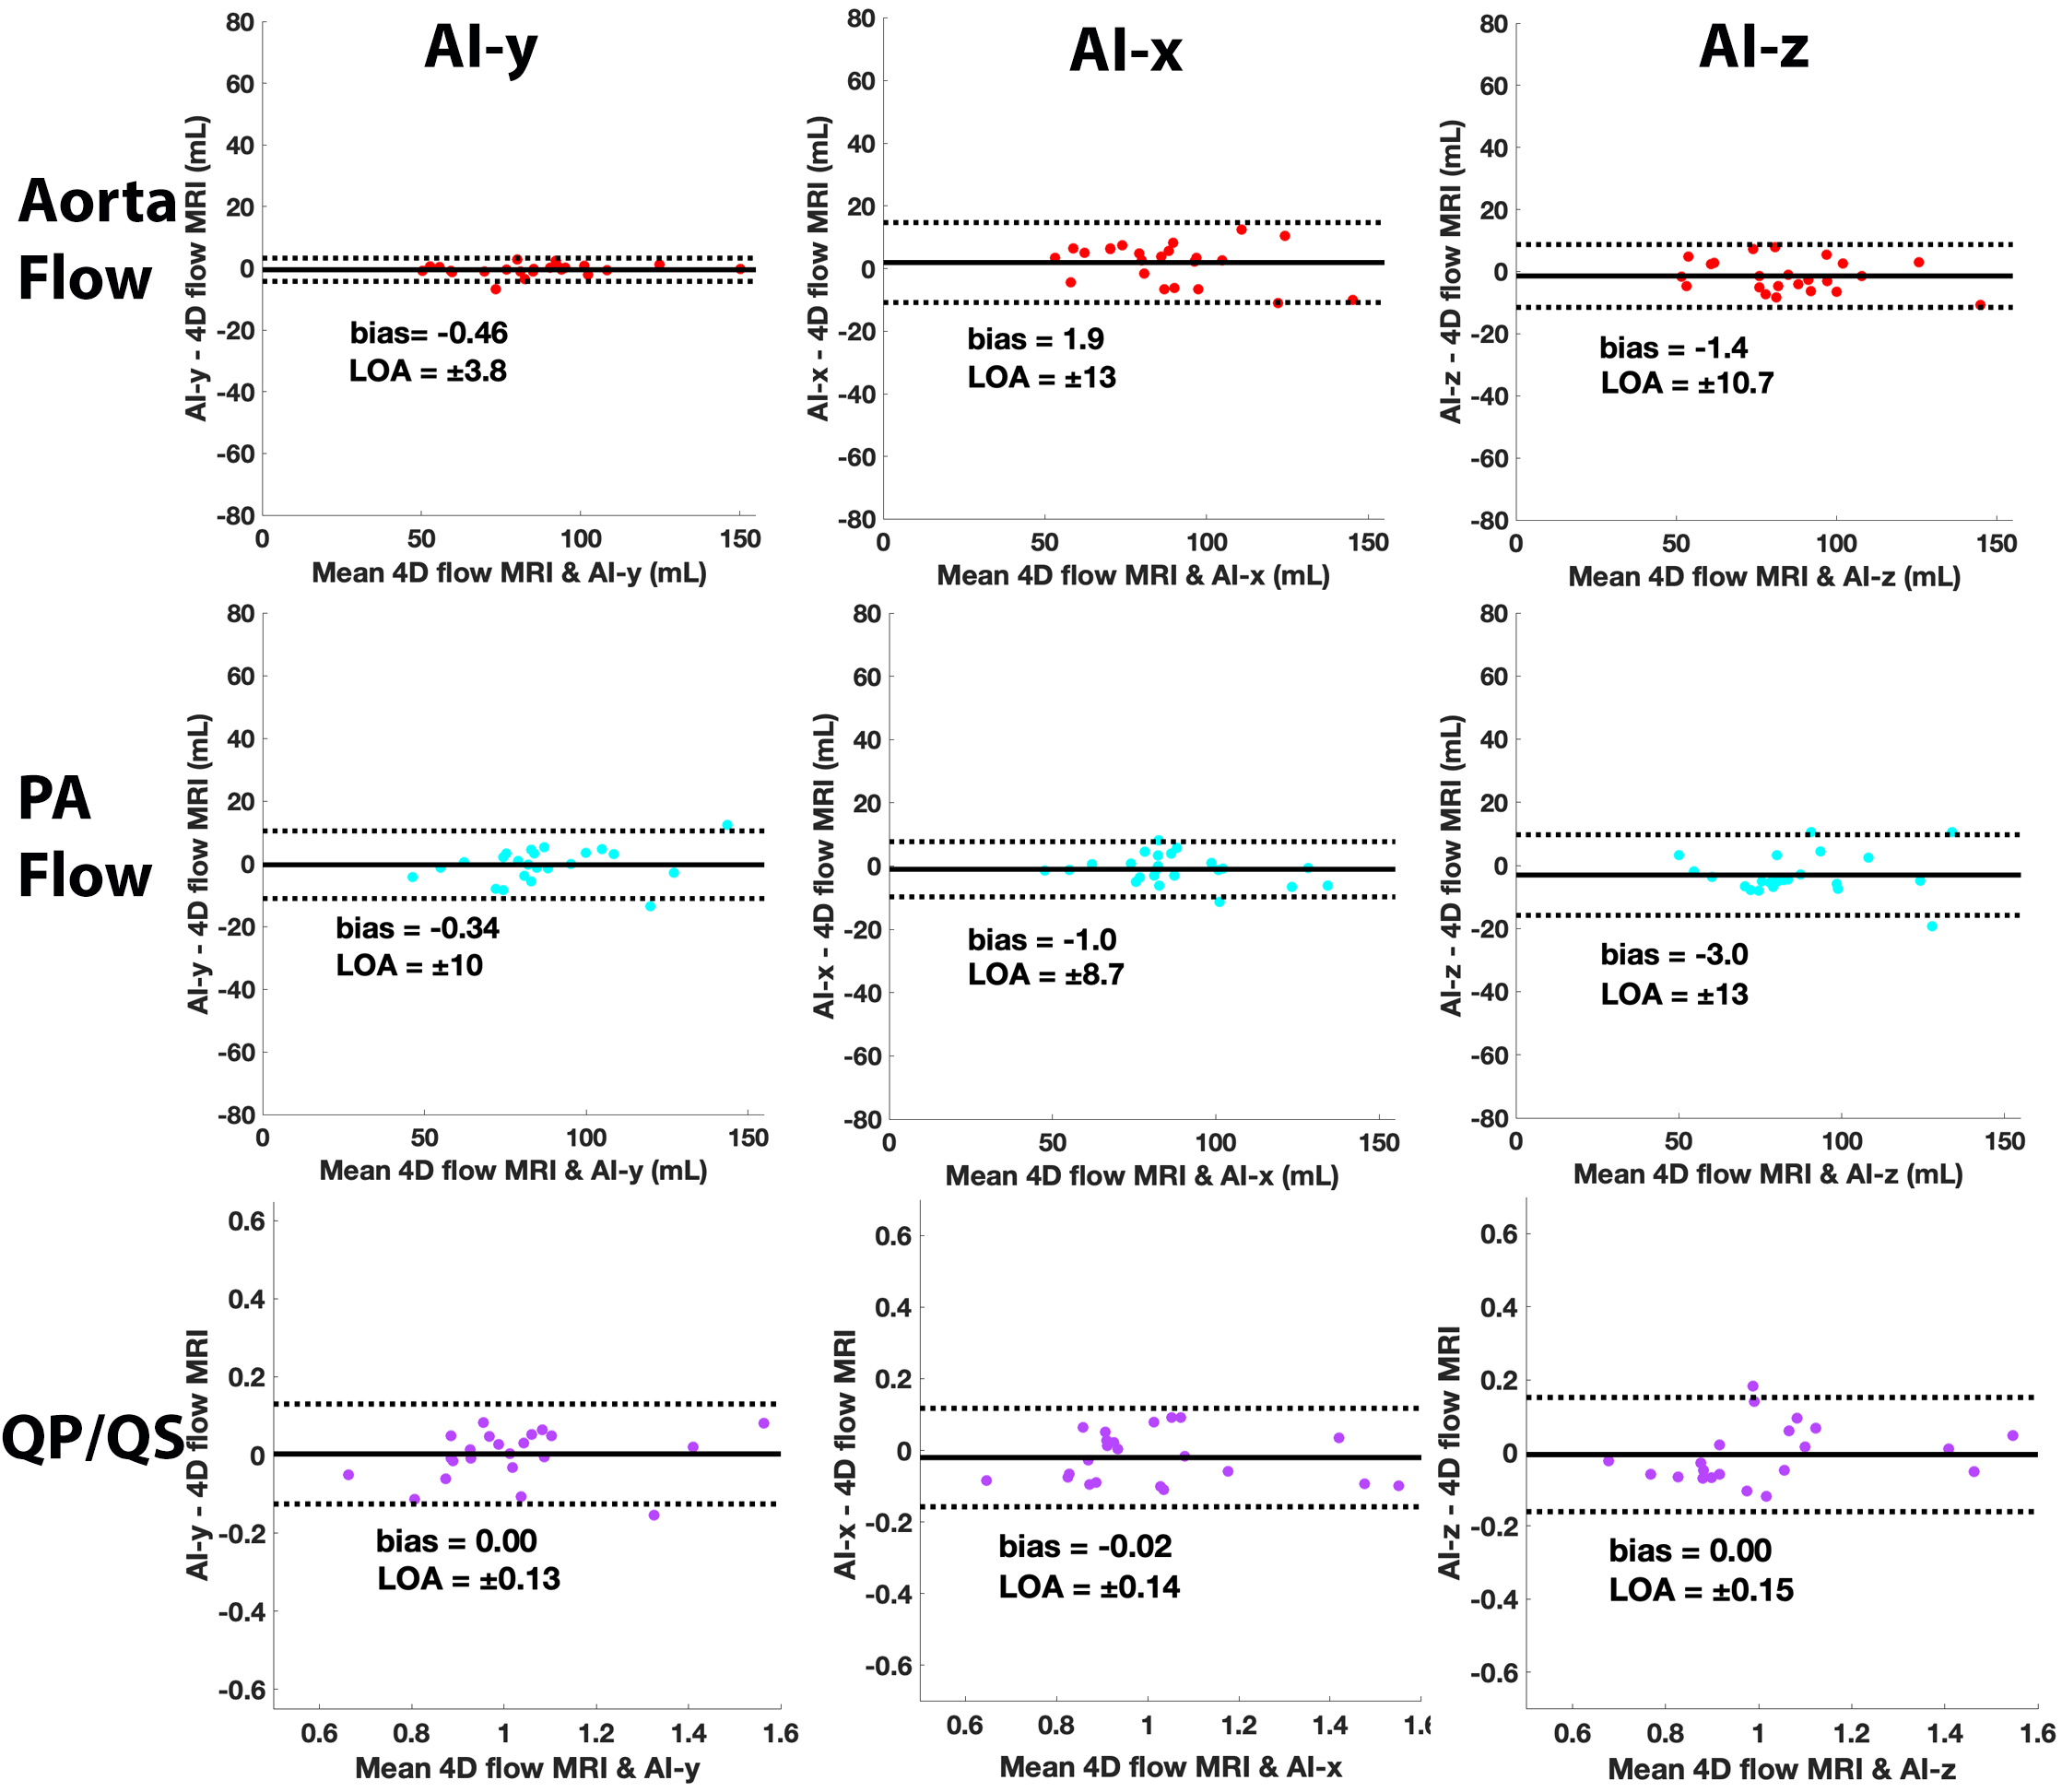
For Qp/Qs comparisons, Bland-Altman plots for aortic flow, PA flow, and Qp/Qs are provided in Figure-4. Qp/Qs comparisons show strong agreement across all datasets with LOA showing 13-15% difference and low bias.
AI-y showed the best agreement across all aortic and Qp/Qs comparisons. AI-z showed the worst agreement with significant differences found in the AAo and DAo.
Discussion
Deep-learning enabled a 2-point encoded 4D flow MRI with strong-to-excellent agreement to conventional 4D flow, while reducing scan time by 50%. A limitation was the lack of prospectively-acquired data, which will be explored in the future.Acknowledgements
No acknowledgement found.References
1. Kim, D., et al., Accelerated 4D-flow MRI with 3-point encoding enabled by machine learning. Magn Reson Med, 2023. 89(2): p. 800-811.
2. Berhane, H., et al., Fully automated 3D aortic segmentation of 4D flow MRI for hemodynamic analysis using deep learning. Magn Reson Med, 2020. 84(4): p. 2204-2218.
3. Mirza, M.O., S., Conditional Generative Adversarial Nets. Arxiv, 2014.
4. Berhane, H., et al., Deep learning-based velocity antialiasing of 4D-flow MRI. MagnReson Med, 2022. 88(1): p. 449-463.
Figures