0085
PERFUSION MAPS QUANTIFICATION USING A NOVELTY SPATIOTEMPORAL CONVOLUTIONAL NEURAL NETWORK1College of Health Science and Environmental Engineering, Shenzhen Technology University, Shenzhen, China, guangdong, China, 2Department of Biomedical Engineering, Columbia University, New York, NY, United States, 3Department of Psychiatry, Columbia University, New York, NY, USA, New York, NY, United States
Synopsis
Keywords: Stroke, Stroke
Motivation: Traditional methods employing deconvolution techniques to estimate perfusion parameters, like singular value decomposition, are known to be vulnerable to noise, potentially distorting the derived perfusion parameters.
Goal(s): We try to use deep learning methods to achieve accurate perfusion parameter estimation and we also identified the clinical utility of these parameters.
Approach: Data and preprocessing: The gold standard perfusion parameter maps and hypo-perfused masks were generated using commercial software RAPID. 52/86 for the training and validation/testing.
Network architecture: Spatio network and Temporal network.
Loss function: the supervised and unsupervised loss function.
Results: All metrics showed a high degree of consistency with the ground truth.
Impact: Based on this study, we can achieve AI-based automation of imaging, quantification, and analysis in the future, which will significantly change the current landscape of clinical treatment, reducing costs while minimizing harm to the human body.
Introduction
Acute Ischemic Stroke (AIS) is the most common type of stroke. "Time is brain" is a widely accepted concept in AIS clinical treatment, emphasizing the critical importance of promptly restoring blocked blood vessels to improve patients' recovery prospects. Dynamic susceptibility contrast magnetic resonance imaging (DSC-MRI) is widely used to evaluate acute ischemic stroke to distinguish salvageable tissue and infarct core. For this purpose, traditional methods employ deconvolution techniques, like singular value decomposition, which are known to be vulnerable to noise, potentially distorting the derived perfusion parameters[1-4]. Many studies have confirmed Convolutional Neural Networks (CNNs) ability to predict quantitative MRI parameters accurately[5-7]. Moreover, CNNs can learn noise characteristics [8]. Therefore, this study presents a perfusion parameters estimation network that considers spatial and temporal information (the Spatial-Temporal Network, ST-Net) for the first time. The proposed network comprises a designed physical loss function to enhance model performance further.MATERIALS AND METHODS
Data and preprocessing.The gold standard perfusion parameter maps were generated using the commercial software RAPID [9]. Two experienced clinical physicians delineated the regions of the Arterial Input Function (AIF) and Venous Output Function (VOF), totaling 138 patient data. Seventy had hypo-perfused area labels. 52 were randomly chosen for the training and validation, while the remaining 86 were for testing.
Network architecture.
1. Spatial network
All voxels within the brain tissue region are cropped into patches of size 7x7x50 and fed into a 3D CNN encoder to extract and preserve spatial feature information.
2. Temporal network
The input (66x50) is based on the output of the spatial network, (64x50) and two additional channels. The first channel represents the baseline signal intensity of voxel points before the contrast agent arrives. The second channel denotes MR signal intensity changes in the arterial vessels. The input is divided into two parallel CNN pathways: The global pathway for extracting long-term temporal features and the local pathway for extracting short-term temporal features. Finally, using two 1D CNN layers and two fully connected layers, the features extracted from global and local pathways are integrated to predict the three parameter values (CBV, CBF, Tmax) corresponding to each voxel. We added dropout layers after the fully connected layers to prevent overfitting. The ST-Net architecture is illustrated in Fig 1.
Loss function.
The loss function consists of supervised and unsupervised loss function loss function. During the training process, we adjusted the weights of these two loss functions to obtain the best model.
Evaluation and statistical analysis.
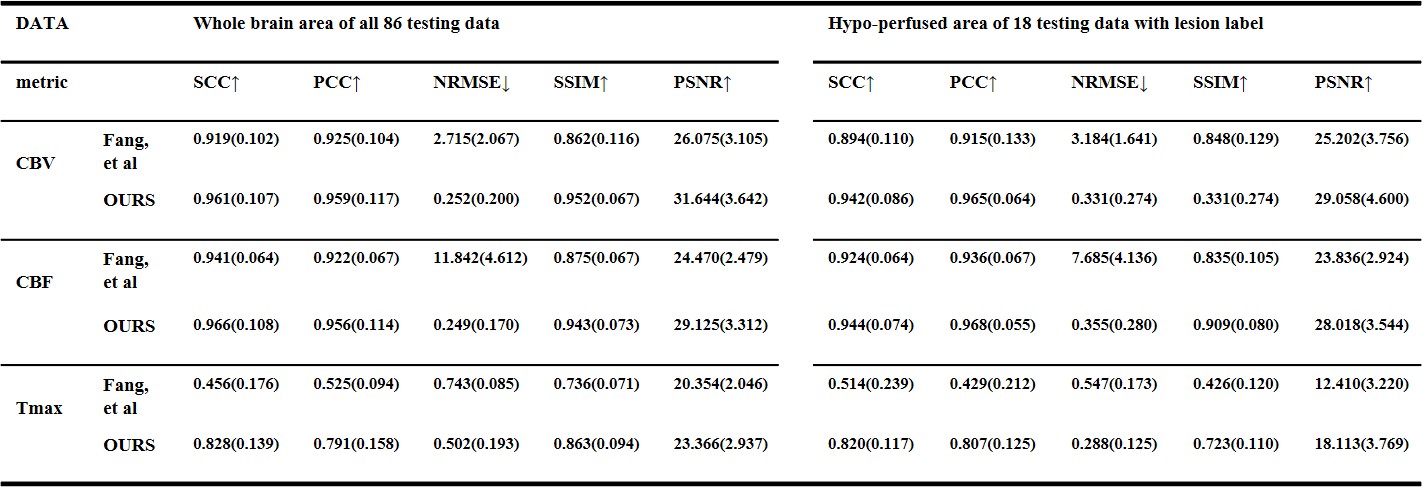
Several metrics were used, including the Spearman's Rank Correlation Coefficient (SCC) [10], Pearson Correlation Coefficient (PCC) [11], Normalized Root Mean Squared Error (NRMSE) [12], Peak Signal-to-Noise Ratio (PSNR) [13], and Structural Similarity Index (SSIM) [13]. Besides the voxel level comparison, we utilized the AUC(Area under the Curve), DICE (Dice Coefficient) score, HD95 (Hausdorff Distance at the 95th percentile), and Intersection over Union (IoU) to compare the performance of ST-Net and the Tmax ground truth in hypo-perfused region segmentation.
Results
Agreement of ST-Net in estimating perfusion parameters.The parameter maps obtained by ST-Net and the ground truth on one testing dataset are shown in Figure 2. The quantitative evaluation results of the test data are summarized in Table 1. Additionally, Figure 4 shows the box plots of each evaluation metric on the test data. The results show a high degree of consistency and stability.
Segmentation of hypo-perfused area.
We attempted three threshold values for segmentation by analyzing the relationship between TPR and FPR in the ROC curve. We found that the best segmentation performance occurs when the difference between TPR and (1 - FPR) is minimized. Figure 3 illustrates the segmentation results, demonstrating high consistency with the ground truth. Computation time When considering the time required to process 10,000 voxels as a unit, Fang[14] took 6.9 seconds. The ST-Net model required 0.77 seconds (with a batch size of 512). ST-Net is nearly on par with commercial software like RAPID.
Conclusion
This study has proposed a convolutional neural network that comprehensively considers spatial and temporal information in the imaging for estimating cerebral perfusion parameters. The perfusion maps estimated by the ST-Net, including the generated mask representing hypo-perfused areas, demonstrate high consistency with clinical gold standards, and it does not rely on traditional deconvolution methods like singular value decomposition. In the future, by utilizing larger datasets and data parallelism techniques, there is the potential to enhance the model's accuracy and computational speed, positioning it as an alternative to traditional deconvolution methods in the practical quantification of clinical perfusion parameters. This achievement is expected to have a positive impact on clinical practice.Acknowledgements
No acknowledgement found.References
[1] Y. Li et al., "Hemodynamic parameter estimation from magnetic resonance perfusion imaging with the Tikhonov regularization method," IEEE Transactions on Magnetics, vol. 51, no. 11, pp. 1-4, 2015.
[2] D. Peruzzo, A. Bertoldo, F. Zanderigo, and C. Cobelli, "Automatic selection of arterial input function on dynamic contrast-enhanced MR images," Computer methods and programs in biomedicine, vol. 104, no. 3, pp. e148-e157, 2011.
[3] A. Chakwizira, A. Ahlgren, L. Knutsson, and R. Wirestam, "Non-parametric deconvolution using Bézier curves for quantification of cerebral perfusion in dynamic susceptibility contrast MRI," Magnetic Resonance Materials in Physics, Biology and Medicine, vol. 35, no. 5, pp. 791-804, 2022.
[4] D. Peruzzo, M. Castellaro, G. Pillonetto, and A. Bertoldo, "Stable spline deconvolution for dynamic susceptibility contrast MRI," Magnetic Resonance in Medicine, vol. 78, no. 5, pp. 1801-1811, 2017.
[5] E. Hoppe et al., "Deep Learning for Magnetic Resonance Fingerprinting: A New Approach for Predicting Quantitative Parameter Values from Time Series," GMDS, vol. 243, pp. 202-206, 2017.[6] F. Balsiger et al., "Magnetic resonance fingerprinting reconstruction via spatiotemporal convolutional neural networks," in Machine Learning for Medical Image Reconstruction: First International Workshop, MLMIR 2018, Held in Conjunction with MICCAI 2018, Granada, Spain, September 16, 2018, Proceedings 1, 2018: Springer, pp. 39-46.
[7] P. Virtue, X. Y. Stella, and M. Lustig, "Better than real: Complex-valued neural nets for MRI fingerprinting," in 2017 IEEE international conference on image processing (ICIP), 2017: IEEE, pp. 3953-3957.
[8] J. Chen, J. Chen, H. Chao, and M. Yang, "Image blind denoising with generative adversarial network based noise modeling," in Proceedings of the IEEE conference on computer vision and pattern recognition, 2018, pp. 3155-3164.
[9] M. Straka, G. W. Albers, and R. Bammer, "Real‐time diffusion‐perfusion mismatch analysis in acute stroke," Journal of Magnetic Resonance Imaging, vol. 32, no. 5, pp. 1024-1037, 2010.
[10] P. Saeedi, S. A. Skeaff, J. E. Wong, and P. M. Skidmore, "Reproducibility and relative validity of a short food frequency questionnaire in 9–10 year-old children," Nutrients, vol. 8, no. 5, p. 271, 2016.[11] J. Adler and I. Parmryd, "Quantifying colocalization by correlation: the Pearson correlation coefficient is superior to the Mander's overlap coefficient," Cytometry Part A, vol. 77, no. 8, pp. 733-742, 2010.
[12] O. Bazgir, R. Zhang, S. R. Dhruba, R. Rahman, S. Ghosh, and R. Pal, "Representation of features as images with neighborhood dependencies for compatibility with convolutional neural networks," Nature communications, vol. 11, no. 1, p. 4391, 2020.
[13] A. Hore and D. Ziou, "Image quality metrics: PSNR vs. SSIM," in 2010 20th international conference on pattern recognition, 2010: IEEE, pp. 2366-2369.
[14] R. Fang, S. Zhang, T. Chen, and P. C. Sanelli, "Robust low-dose CT perfusion deconvolution via tensor total-variation regularization," IEEE transactions on medical imaging, vol. 34, no. 7, pp. 1533-1548, 2015.
Figures
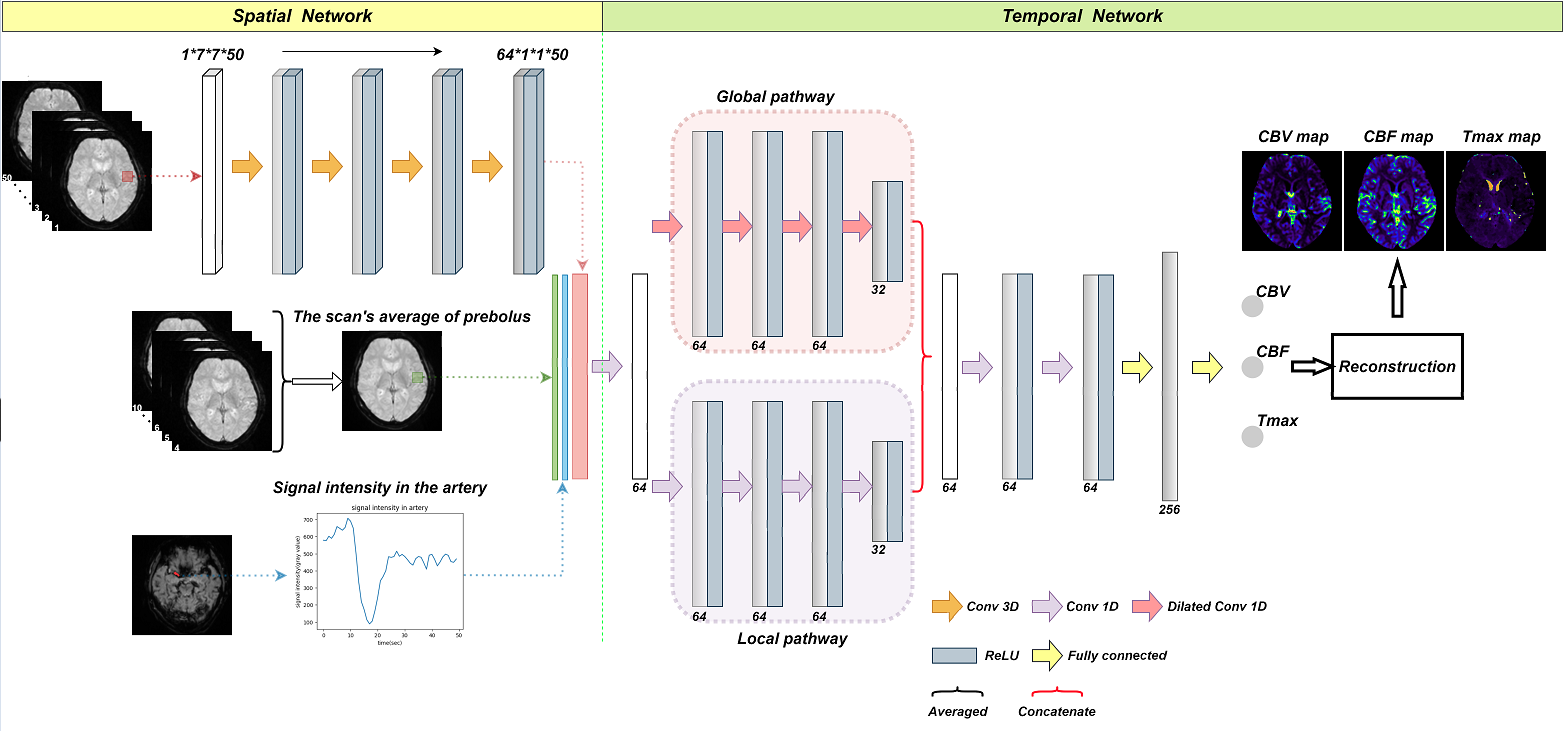
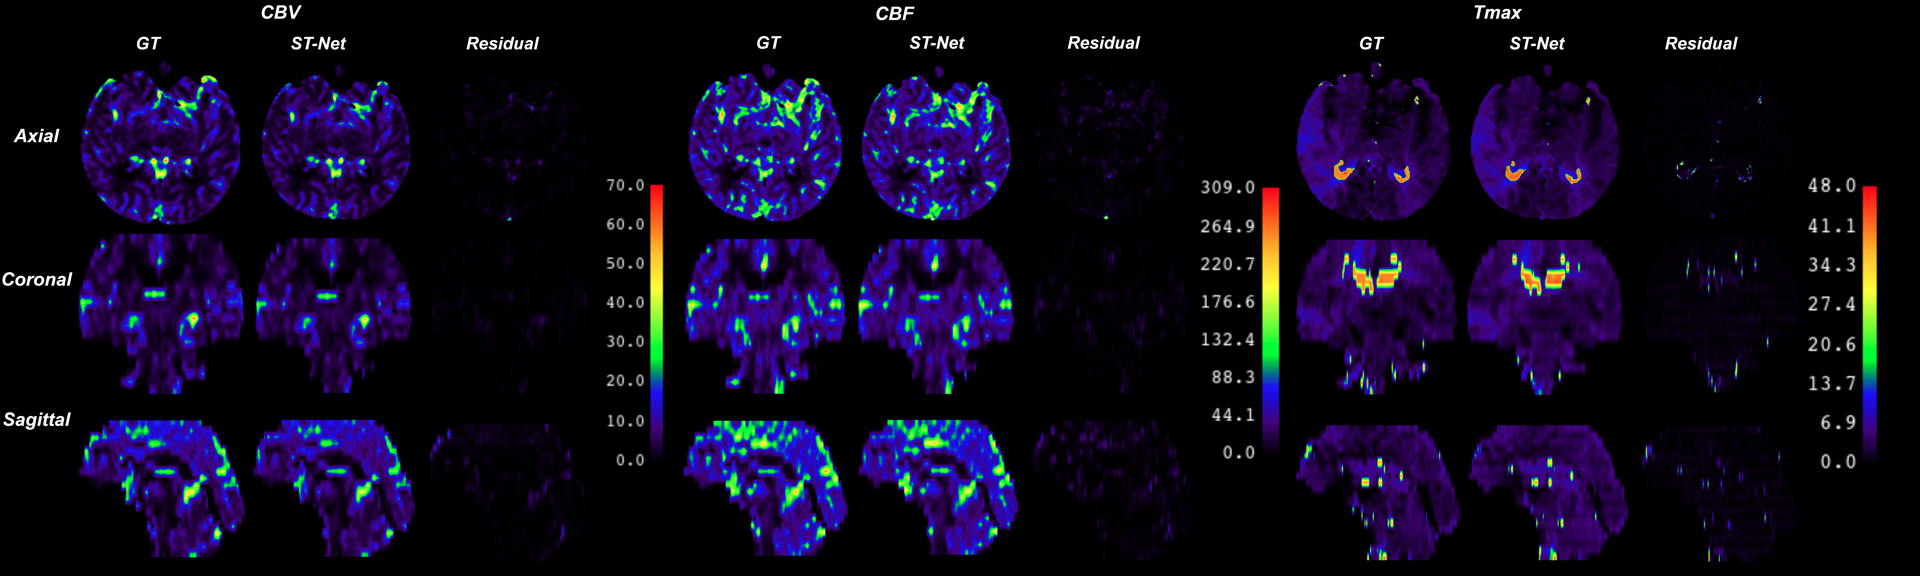
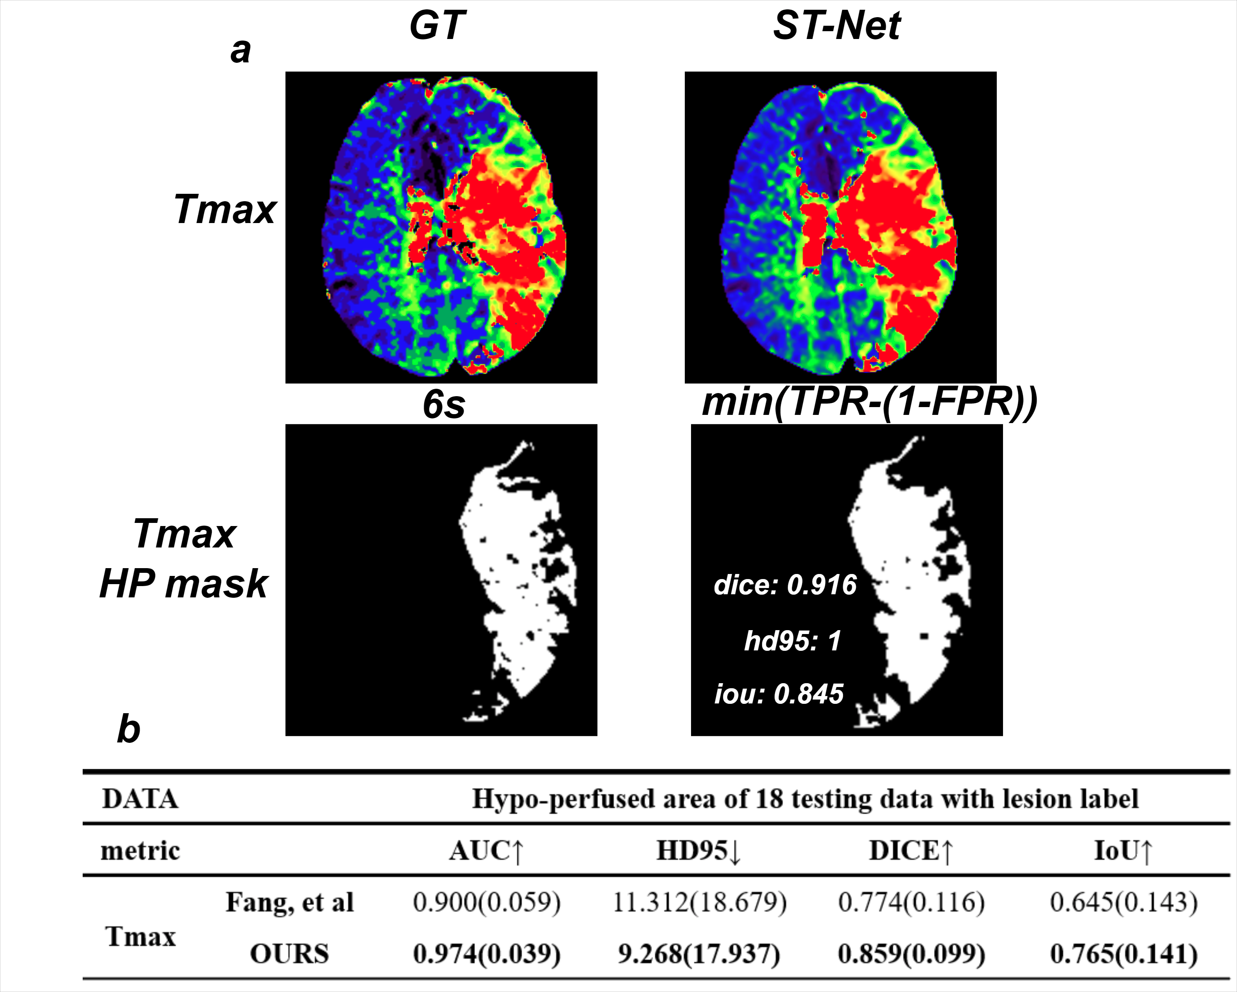
Fig 3: a. GT and ST-Net represent the ground truth Tmax and derived maps, respectively. HP mask represents hypo-perfused area masks. min(TPR-(1-FPR)): the threshold of ROC under this operating point. b. The segmentation performance of the 18 testing data with hypo-perfused label. Fang, et al represents the method in [14]. OURS is the ST-Net.
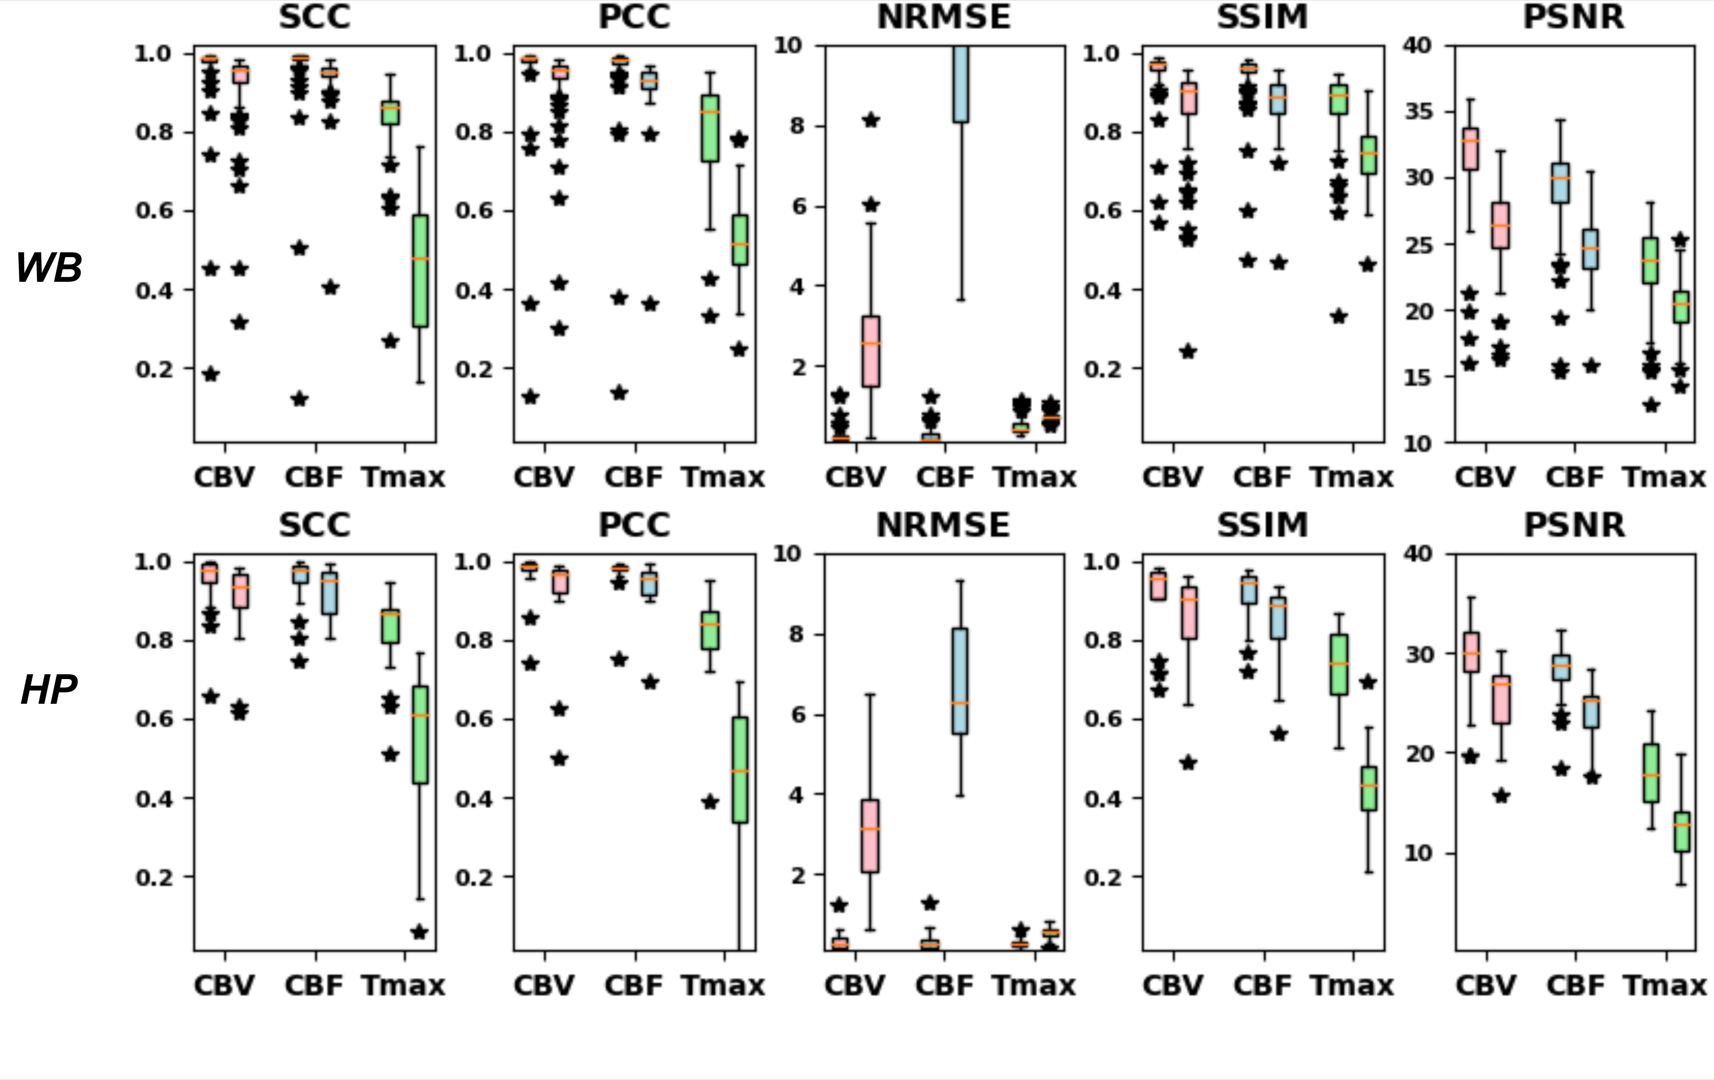
Fig 4: Box plots visualizing model performance across testing data. WB: whole brain area, HP: hypo-perfused area. For every parameter per metric, there are two bars with the same color. One is the result of ST-Net, and the other is the method(Fang, et al)[14]. The results show our method is much better than the traditional method.