0084
Cerebrovascular reactivity response delays from time regression analysis are uniquely correlated to recent stroke symptomatology in moyamoya1Neurology, Vanderbilt University Medical Center, Nashville, TN, United States, 2Radiology and Radiological Sciences, Vanderbilt University Medical Center, Nashville, TN, United States, 3Neurosurgery, Vanderbilt University Medical Center, Nashville, TN, United States, 4Pediatrics, Vanderbilt University Medical Center, Nashville, TN, United States, 5Psychiatry and Behavioral Sciences, Vanderbilt University Medical Center, Nashville, TN, United States, 6Electrical and Computer Engineering, Vanderbilt University, Nashville, TN, United States
Synopsis
Keywords: Stroke, Stroke, Cerebrovascular Reactivity, Moyamoya
Motivation: Moyamoya impairment is commonly assessed by anatomical MRI and angiography, yet these methods lack information on compensatory parenchymal behaviors.
Goal(s): To evaluate whether cerebrovascular compliance measures reflect recent ischemic symptomology and may have relevance as biomarkers of stroke risk or as endpoints in interventional trials.
Approach: We applied logistic regression analysis in 73 moyamoya participants to evaluate whether BOLD hypercapnia-induced reactivity or reactivity delays related to recent ischemic symptoms.
Results: Reactivity delays in the flow territory of ischemic symptoms were found to be significantly lengthened compared to the asymptomatic territories. Maximum vasodilatory responses were less closely associated with symptoms.
Impact: The sensitivity of the cerebrovascular reactivity timing profiles to recent ischemic symptomology suggests that the dynamics of vascular compliance may have clinical relevance as a diagnostic measurement of impairment or treatment response in moyamoya.
Introduction
Moyamoya disease (MMD) is an idiopathic cerebrovascular condition characterized by the pathognomonic, non-atherosclerotic steno-occlusion of the intracranial carotid artery (ICA) and its proximal branches, the corresponding development of lenticulostriate or leptomeningeal collaterals, and high risk of new or recurrent stroke.1 The extent of impairment is commonly assessed through anatomical MRI and catheter angiography.2 However, these methods are invasive or lack information on autoregulatory or collateral features, which may partially or fully compensate for macrovascular disease. There has been a growing use of cerebrovascular reactivity (CVR) metrics to assay neurovascular impairment;2-4 specifically, prior work has shown CVR as a promising biomarker of stroke risk.5 However, for these metrics to be accepted as a biomarker of stroke risk, the relationship between these measures and ischemic symptomology must be established. Here, we test the hypothesis that hypercapnia-induced CVR and CVR response times assessed from novel time-regression analyses6,7 correlate with recent ischemic neurological symptoms derived from the same flow territory.Material and Methods
Demographics: Participants (n=73) with a diagnosis of moyamoya vasculopathy from catheter angiography and neurological assessment provided informed consent and enrolled for this prospective study.Experiment: All participants underwent non-contrasted anatomical MRI (T1-weighted, T2-weighted FLAIR, and DWI), in sequence with hypercapnic blood oxygenation level-dependent (BOLD; TE=35 ms; spatial resolution=3.5x3.5x3.5 mm, TR=2000 ms).8 A paradigm comprising two blocks of 180s hypercapnic hyperoxic gas (5% CO2 / 95% O2) interleaved with 180s normocapnic normoxic gas (21% O2/79% N2) was administered. EtCO2, blood pressure, heart rate, and arterial oxygen saturation were monitored.
Analysis: Time regression exploited the hyperoxic balance as a diffusible tracer to quantify timing-uncorrected cerebrovascular reactivity (CVRRAW), lag-corrected maximum cerebrovascular reactivity (CVRMAX), and reactivity delay time (CVRDELAY).7 CVRRAW and CVRMAX were normalized by the mean end-tidal CO2 change over the two stimulus blocks. Cortical masks were derived from middle cerebral artery (MCA) flow territory map and dichotomized along the midline to calculate each hemisphere’s reactivity metrics separately. To ensure that the masks only covered viable tissue, infarcts were identified on FLAIR and manually removed from cortical masks. A board-certified neurologist organized symptomatology information for each hemisphere into symptomatic (overt stroke or transient ischemic attack within six-months) or asymptomatic (no history of ischemic symptoms).
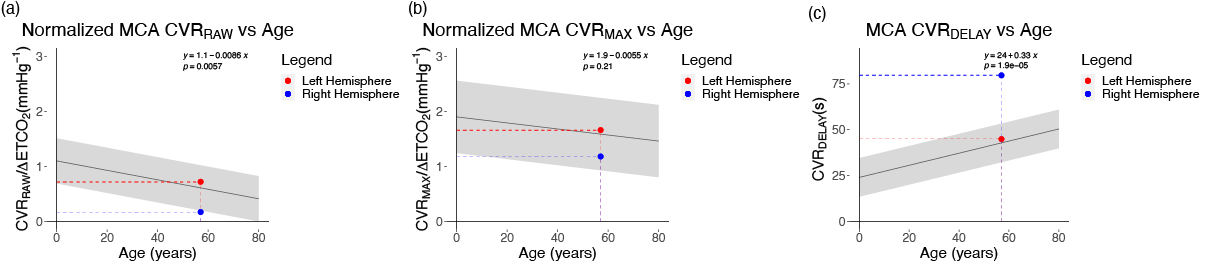
Statistics: This analysis aimed to understand if the CVR metrics are correlated with moyamoya symptomatology. To achieve this, a logistic regression analysis with robust standard errors based on Huber-White sandwich estimator compared the CVR metrics between asymptomatic and symptomatic cohorts. Exemplar summary statistics in symptomatic and asymptomatic hemispheres as a function of age were also recorded. Significance criterion: Bonferroni-corrected two-sided p<0.05.
Results
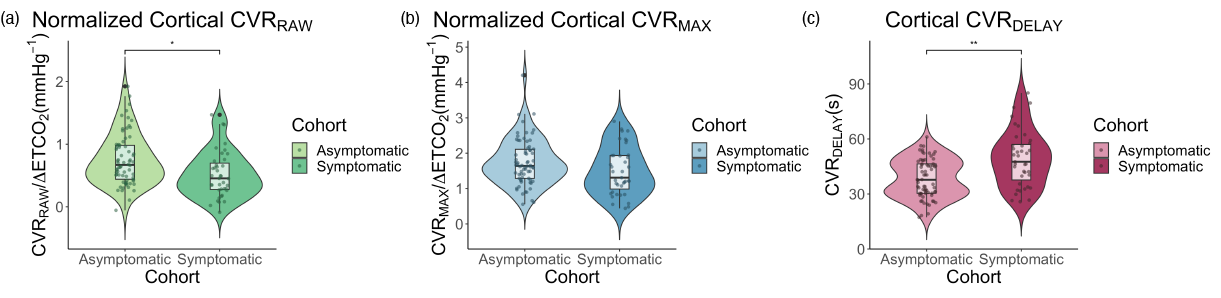
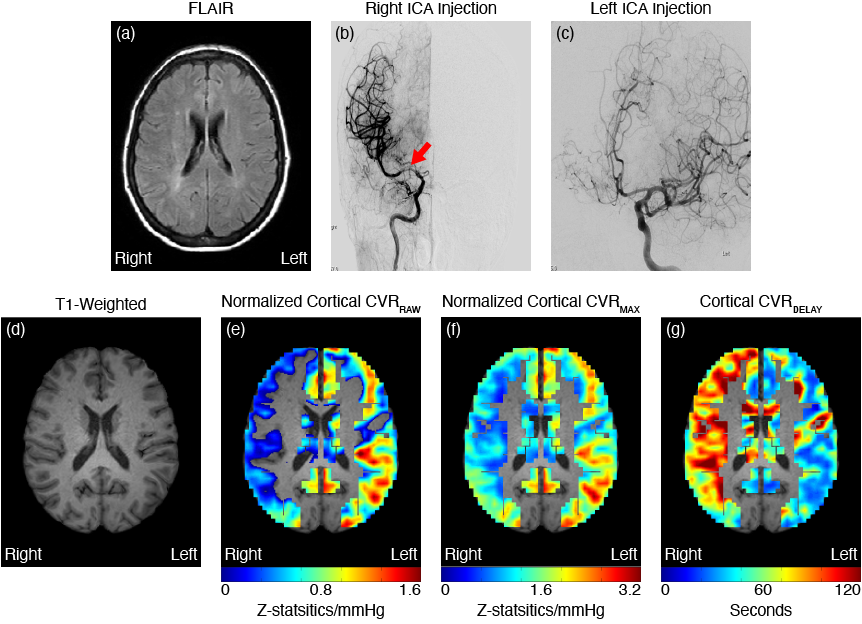
Table 1 summarizes participant demographics, including the asymptomatic (n=59; age=44.4±15.4 years) and the symptomatic (n=32; age=42.8±11.3 years) hemispheric flow territories as well as the logistic regression analysis that compares the CVR metrics between the two groups. Figure 1 shows violin plots comparing each of the reactivity statistics between cohorts. The symptomatic hemispheres display significantly reduced cortical CVRRAW (p=0.007) and lengthened CVRDELAY (p<0.001); no differences were observed in the CVRMAX after controlling for multiple comparisons (corrected p>0.05). Figure 2 shows a case example of how a unilateral stroke has lateral effects on cortical CVR along with the participant’s angiogram. Figure 3 shows the age-dependent regression information for asymptomatic hemispheres with the average reactivity metrics of the case example in Figure 2 plotted.Discussion
Prior literature has provided evidence that CVR-weighted MRI can assay hemodynamic patterns in cerebrovascular diseases like moyamoya.9,10 Our findings support this and provide additional information on which CVR metrics are the most sensitive to recent ischemic symptoms. Maximum CVR was observed to be less closely related to symptoms than timing parameters, suggesting that the time of vascular compliance, rather than the magnitude, may be most sensitively related to ischemic symptoms in many patients. The relevance of timing, including mean transit time and time-to-peak, is well-known to have clinical relevance in acute stroke imaging and these results suggest that similar relevance may be present in hypercapnia protocols and chronic ischemia.11 Finally, the age-dependent ranges reported in patients complement recent reports of normative ranges in healthy control volunteers12 to provide an exemplar for quantitative interpretation of reactivity.Conclusion
We investigated if the reactivity metrics of anterior flow territories that are supplied directly by arteries affected by moyamoya are related to ischemic symptomology in moyamoya patients. Findings suggest that cortical CVR is more impaired in hemispheres with recent ischemic symptoms. The CVR response delay was more closely related to symptomatology than maximum CVR response. This finding along with our exemplar statistics suggests the prospective clinical relevance of CVR and its use as a diagnostic measurement.Acknowledgements
No acknowledgement found.References
- Scott RM, Smith ER. Moyamoya disease and moyamoya syndrome. N Engl J Med. 2009;360:1226-1237. doi: 10.1056/NEJMra08046222.
- Juttukonda MR, Donahue MJ. Neuroimaging of vascular reserve in patients with cerebrovascular diseases. Neuroimage. 2019;187:192-208. doi: 10.1016/j.neuroimage.2017.10.0153.
- Liu P, Welch BG, Li Y, Gu H, King D, Yang Y, Pinho M, Lu H. Multiparametric imaging of brain hemodynamics and function using gas-inhalation MRI. Neuroimage. 2017;146:715-723. doi: 10.1016/j.neuroimage.2016.09.0634.
- Heyn C, Poublanc J, Crawley A, Mandell D, Han JS, Tymianski M, terBrugge K, Fisher JA, Mikulis DJ. Quantification of cerebrovascular reactivity by blood oxygen level-dependent MR imaging and correlation with conventional angiography in patients with Moyamoya disease. AJNR Am J Neuroradiol. 2010;31:862-867. doi: 10.3174/ajnr.A19225.
- Juttukonda MR, Davis LT, Lants SK, Waddle SL, Lee CA, Patel NJ, Jordan LC, Donahue MJ. A Prospective, Longitudinal Magnetic Resonance Imaging Evaluation of Cerebrovascular Reactivity and Infarct Development in Patients With Intracranial Stenosis. J Magn Reson Imaging. 2021;54:912-922. doi: 10.1002/jmri.276056.
- Bhogal AA, Sayin ES, Poublanc J, Duffin J, Fisher JA, Sobcyzk O, Mikulis DJ. Quantifying cerebral blood arrival times using hypoxia-mediated arterial BOLD contrast. Neuroimage. 2022;261:119523. doi: 10.1016/j.neuroimage.2022.1195237.
- Donahue MJ, Strother MK, Lindsey KP, Hocke LM, Tong Y, Frederick BD. Time delay processing of hypercapnic fMRI allows quantitative parameterization of cerebrovascular reactivity and blood flow delays. J Cereb Blood Flow Metab. 2016;36:1767-1779. doi: 10.1177/0271678X156086438.
- Donahue MJ, Ayad M, Moore R, van Osch M, Singer R, Clemmons P, Strother M. Relationships between hypercarbic reactivity, cerebral blood flow, and arterial circulation times in patients with moyamoya disease. J Magn Reson Imaging. 2013;38:1129-1139. doi: 10.1002/jmri.240709.
- De Vis JB, Bhogal AA, Hendrikse J, Petersen ET, Siero JCW. Effect sizes of BOLD CVR, resting-state signal fluctuations and time delay measures for the assessment of hemodynamic impairment in carotid occlusion patients. Neuroimage. 2018;179:530-539. doi: 10.1016/j.neuroimage.2018.06.01710.
- Liu P, Liu G, Pinho MC, Lin Z, Thomas BP, Rundle M, Park DC, Huang J, Welch BG, Lu H. Cerebrovascular Reactivity Mapping Using Resting-State BOLD Functional MRI in Healthy Adults and Patients with Moyamoya Disease. Radiology. 2021;299:419-425. doi: 10.1148/radiol.202120356811.
- Powers WJ. Acute Ischemic Stroke. N Engl J Med. 2020;383:252-260. doi: 10.1056/NEJMcp191703012.
- Sobczyk O, Battisti-Charbonney A, Poublanc J, Crawley AP, Sam K, Fierstra J, Mandell DM, Mikulis DJ, Duffin J, Fisher JA. Assessing cerebrovascular reactivity abnormality by comparison to a reference atlas. J Cereb Blood Flow Metab. 2015;35:213-220. doi: 10.1038/jcbfm.2014.184
Figures