0083
Amido-proton transfer imaging combines DWI to evaluate ischemic penumbra in wake-up stroke patients: A Feasibility study1Clinical Medical College of Jining Medical University, Jining, Shandong, China, 2Philips Healthcare (Beijing), Beijing, China, 3Affiliated Hospital of Jining Medical University, Jining, Shandong, China
Synopsis
Keywords: Stroke, Stroke, ischemic penumbra,wake-up stroke,Amido-proton transfer,Arterial spin labeling,Diffusion weighted imaging
Motivation: Ischemic Penumbra (IP) is an Ischemic tissue that is "basically reversible” during effective treatment. amide proton transfer-weighted (APT) imaging based on the PH value of biological tissues may have certain application value in evaluating the range of ischemic penumbra
Goal(s): This study aimed to explore if APTw imaging has the clinical potential to predict Ischemic Penumbra
Approach: This study intends to apply APTw imaging technology to wake-up stroke patients to explore whether this technology can more accurately evaluate the range of IP compared with ASL technology
Results: The APTw-DWI mismatch model has the potential to evaluate the ischemic penumbra in wake-up stroke patients
Impact: APTw combined with DWI provides a new method to distinguish ischemic penumbra in patients with wake-up stroke accurately.
Materials and Methods
Local Ethics Committee approved this Prospective study, and informed consent was obtained from all patients. Ninety-six wake-up stroke patients who underwent routine MRI scans, ASL, and APTw imaging were assessed.
Before the clinical intervention, all patients had undergone conventional and two-dimensional (2D) APTW sequences on a 3.0 T MRI scanner (Ingenia 3.0T; Philips Medical Systems, Best, The Netherlands). A body coil for radiofrequency (RF) transmission and a 16-channel head coil were used for signal reception. The APTw scan parameters were of sensitivity-encoding factor =2, TR=3s, TE=11ms, FOV=240×240 mm2, section thickness was 6 mm. Scan time was approximately 3 mins; Conventional MRI sequence include T1-weighted (TR=400ms, TE=20ms), T2-weighted (TR=2800ms, TE=105ms), fluid-attenuated inversion recovery (FLAIR) (TR=8000ms, TE=204ms, TI=2200ms), FOV=240×240 mm2, slice thickness=5mm, slice spacing=2 mm, and matrix=512×512.
The APTw raw data were analyzed using interactive data language written in the program (IDL; Research Systems, Inc., Boulder, CO, USA). All cases were divided into the ASL-DWI mismatch group and APTw-DWI mismatch group based on whether the CBF, APTw, and DWI fusion images were matched before treatment. Three regions were delineated on the fusion images of all patients with ischemic penumbra and respectively defined as Infarct core (IC), mismatchmetabolism , and mismatchflow-metabolic. Five ROIs were randomly delineated for each region to measure APTw values, including the maximum APTw value (APTwmax), minimum APTw value (APTwmin), average APTw value (APTwave), and max-min APTw value( APTmax-min).
MRI reexamination after 3 months was used as the standard, and Fisher's exact test was used to compare the sensitivity, specificity, and accuracy of the two mismatch models in detecting IP. Paired t-tests were used to compare APTw parameters between IC, mismatchmetabolic, and mismatchflow-metabolic regions and contralateral ordinary white matter. Kruskal-Wallis test was used to compare the differences in APTwmin, APTwave and APTwmax parameters among IC, mismatchmetabolism , mismatchflow-metabolic parts. P<0.05 was considered statistically significant.
Results and discussion
According to the follow-up results, 50 patients had ischemic penumbra, 56 cases were detected in the ASL-DWI mismatch group, and 46 cases were detected in the APTw-DWI mismatch group. The specificity and accuracy of the APTw-DWI mismatch group for IP detection were higher than those of the ASL-DWI mismatch group (100% vs.57%,93.7% vs.90.6%, P<0.001), but the sensitivity was lower than that of ASL-DWI mismatch group(92%vs.100%). In the APTw images of 46 patients, APTwmax、APTwmin、APTwave in IC region(-0.36(-0.59,-0.17)、-0.89±0.09、-0.59(-1.03,-0.24))and mismatchmetabolic region(0.22(-0.05,0.49)、-0.11±0.10、0.02(-0.25,0.25))were lower than APTwCNAWM(0.66(0.45,0.82)), and the values in IC region were significantly lower than those in mismatch region(P<0.001). APTmax-min in mismatchmetabolic region were significantly higher in mismatchflow-metabolic region ( P < 0.001), However, there was no significant difference in IC region(P>0.05).
It was found that the APTw-DWI mismatch model had a good consistency with ASL-DWI in IP detection. However, its scope was often smaller than that of the ASL-DWI mismatch model. Moreover, 46 patients also showed a mismatch between perfusion and APTw, and it was found that the APTw value in this region was higher than that in the mismatchmetabolic region and IC region. Compared with DWI-ASL mismatch, APTw can predict and define the ischemic penumbra more accurately. In addition, quantitative studies showed that tissue acidosis in the mismatchmetabolism area was more severe than that in the contralateral normal white matter but less severe than that in the infarct core. The APTwmax-min value of the mismatchmetabolism region was higher than that of the IC region and the mismatchflow metabolism region, indicating that the pH difference was the largest in this area and that the inhomogeneity of APTw signal can be used to discriminate ischemic severity in stroke.
Conclusion
In summary, The APTw-DWI mismatch model is promising for evaluating the ischemic penumbra in patients with wake-up stroke, and its specificity and accuracy are higher than the ASL-DWI mismatch model.
Acknowledgements
Not applicableReferences
[1] Sun PZ, Zhou J, Sun W, et al. Detection of the Ischemic Penumbra Using pH-Weighted MRI[J].Journal of Cerebral Blood Flow & Metabolism. 2006, 27(6): 1129-36. DOI:10.1038/sj.jcbfm.9600424.
[2] Guo C, Bai Q, Zhao Z, et al. Recombinant Tissue-Type Plasminogen Activator Study of Wake-Up Ischemic Strokes Guided by Rapid MRI[J].Cerebrovascular Diseases. 2019, 48(1-2): 85-90. DOI:10.1159/000503379.
[3] Huang D, Li S, Dai Z, et al. Novel gradient echo sequence-based amide proton transfer magnetic resonance imaging in hyperacute cerebral infarction[J].Molecular Medicine Reports. 2015, 11(5): 3279-84. DOI:10.3892/mmr.2015.3165.
[4] Heo HY, Tee YK, Harston G, et al. Amide proton transfer imaging in stroke[J].NMR in Biomedicine. 2022, 36(6). DOI:10.1002/nbm.4734.
[5] Yu L, Chen Y, Chen M, et al. Amide Proton Transfer MRI Signal as a Surrogate Biomarker of Ischemic Stroke Recovery in Patients With Supportive Treatment[J].Frontiers in Neurology. 2019, 10. DOI:10.3389/fneur.2019.00104.
Figures
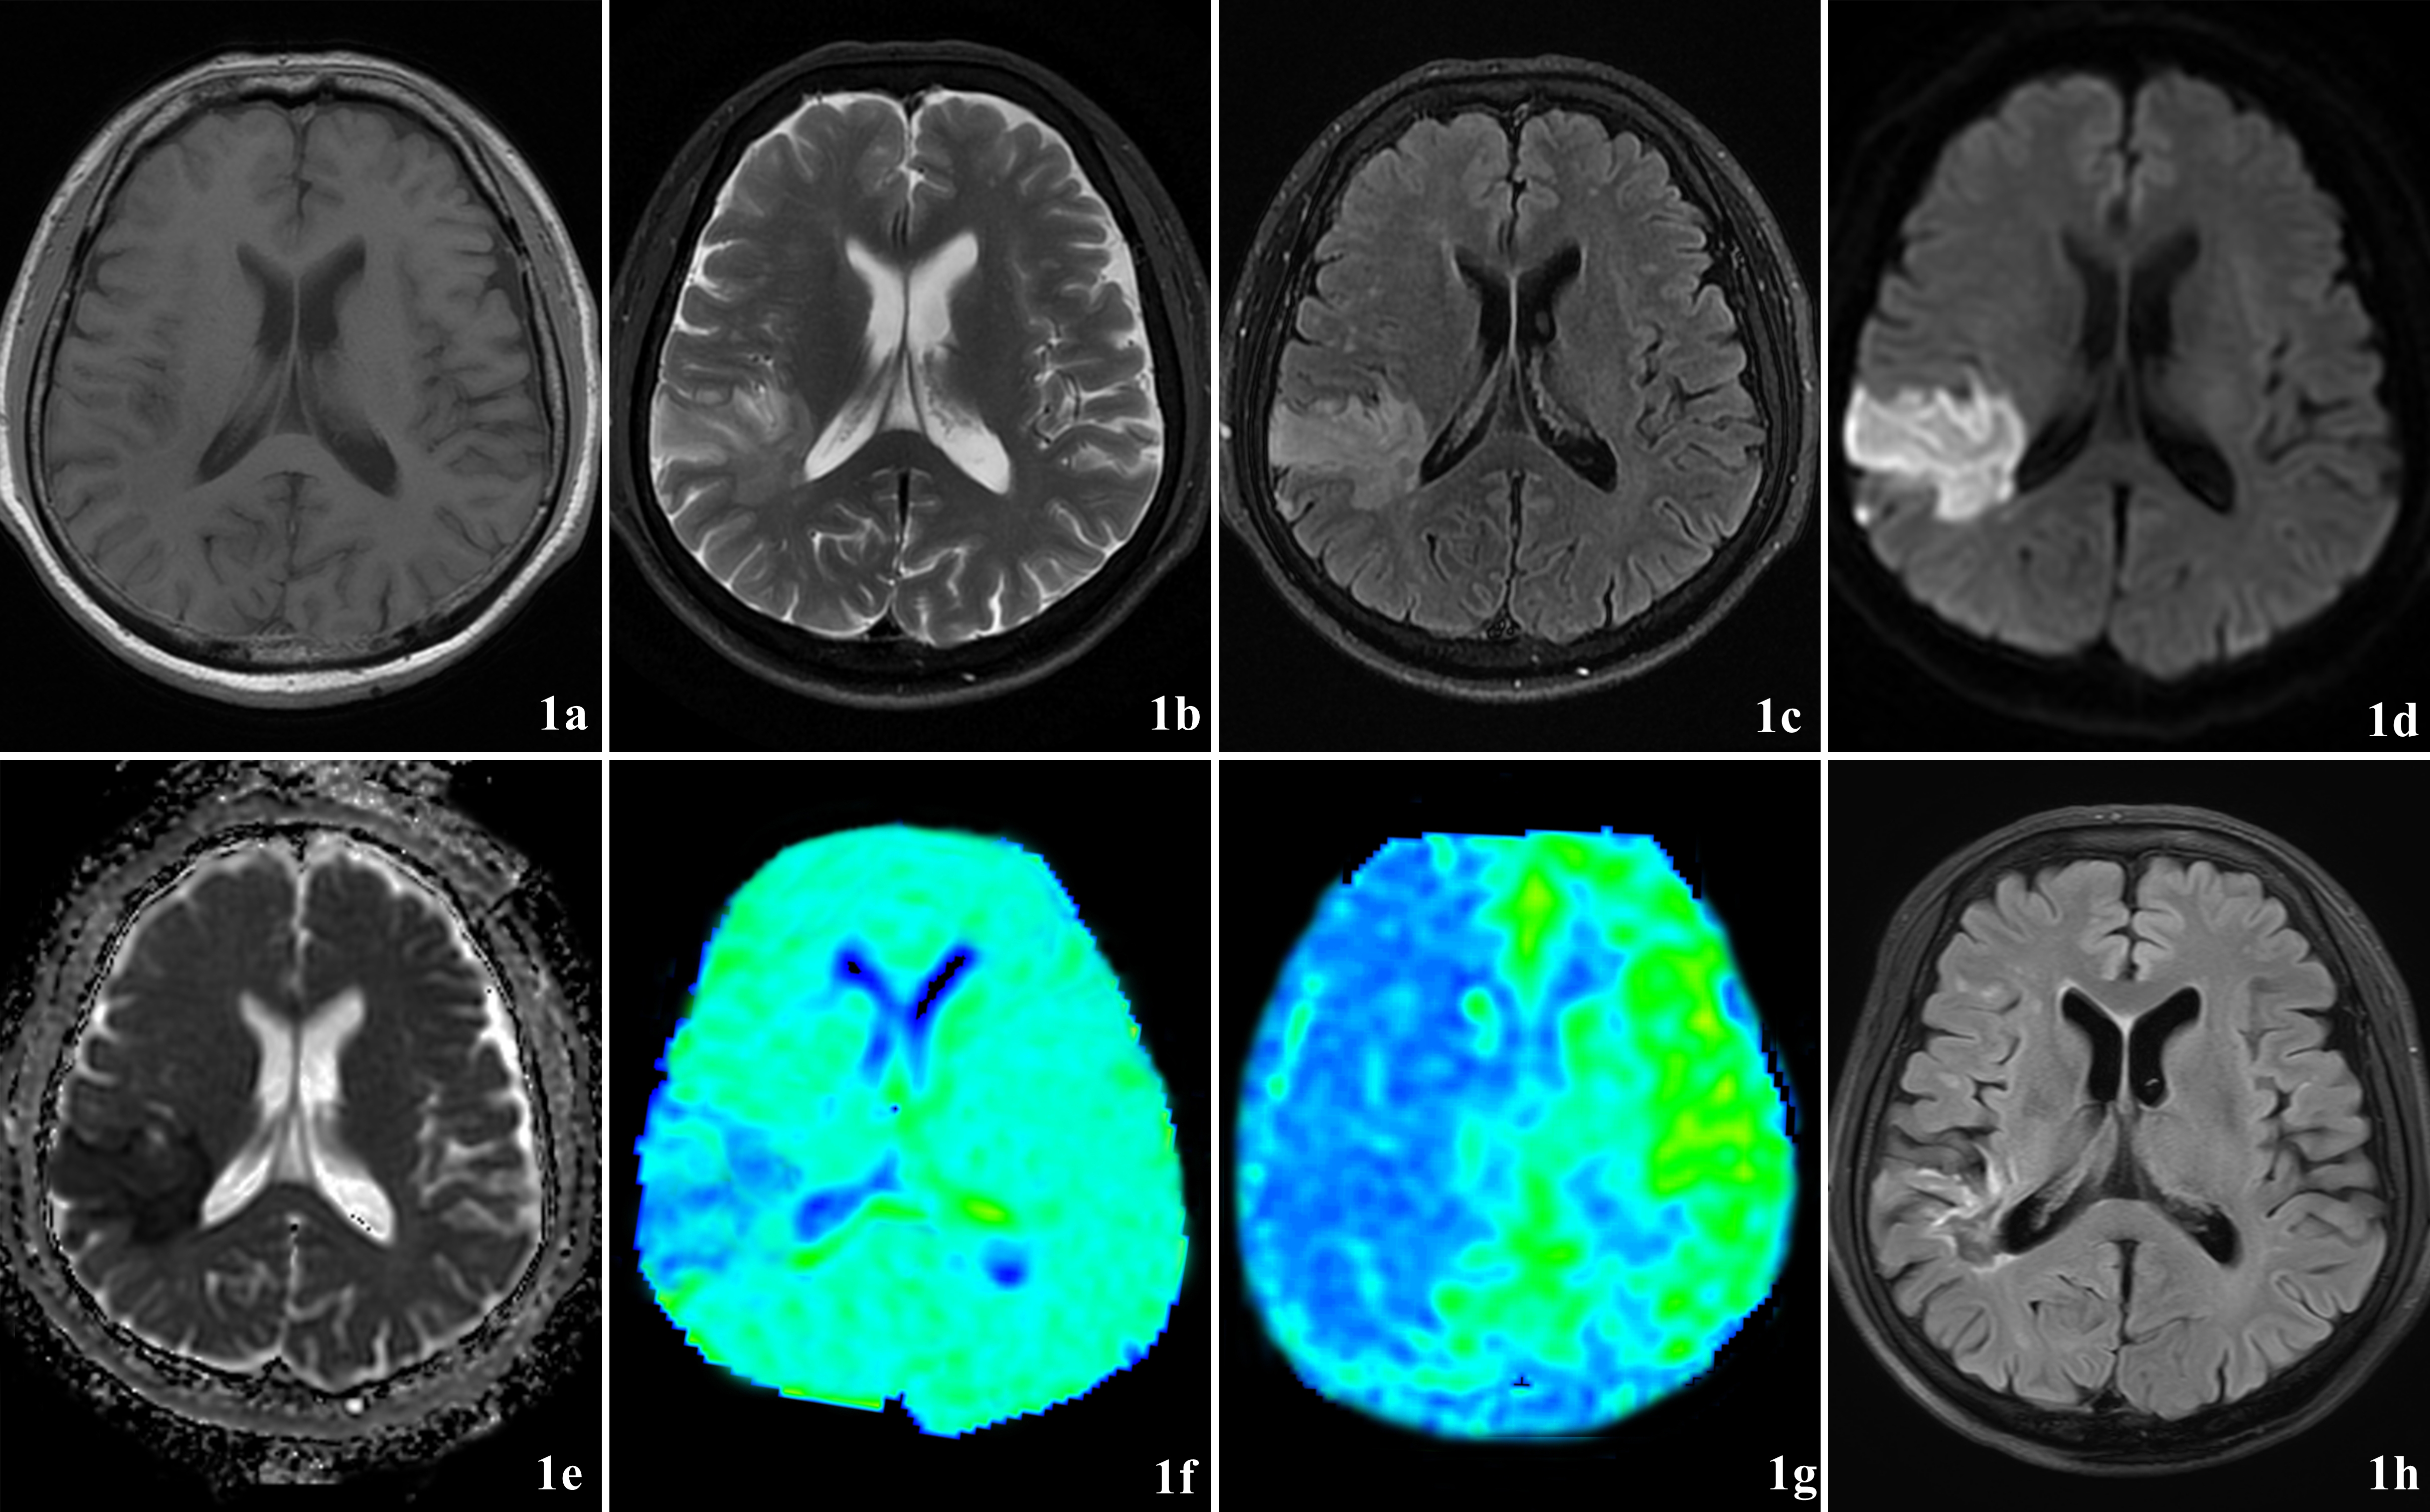
The patient was a 57-year-old male with dizziness and left limb movement weakness for about 1 day. 1a-1c: Brain tissue swelling in the right temporal lobe with slight hyperintensity on T1WI, T2WI and marked hyperintensity on T2-FLAIR; 1d-1c: DWI image showed the acute infarction lesion; 1f: APTw showed an area of APT decrease and the APTw lesion was almost the same as the DWI lesion; 1g: ASL showed a large area of low blood supply with an apparent DWI/ASL mismatch; 1h: The size of the follow-up FLAIR image 3 months later was almost the same as the DWI, which shows there was no ischemic penumbra.
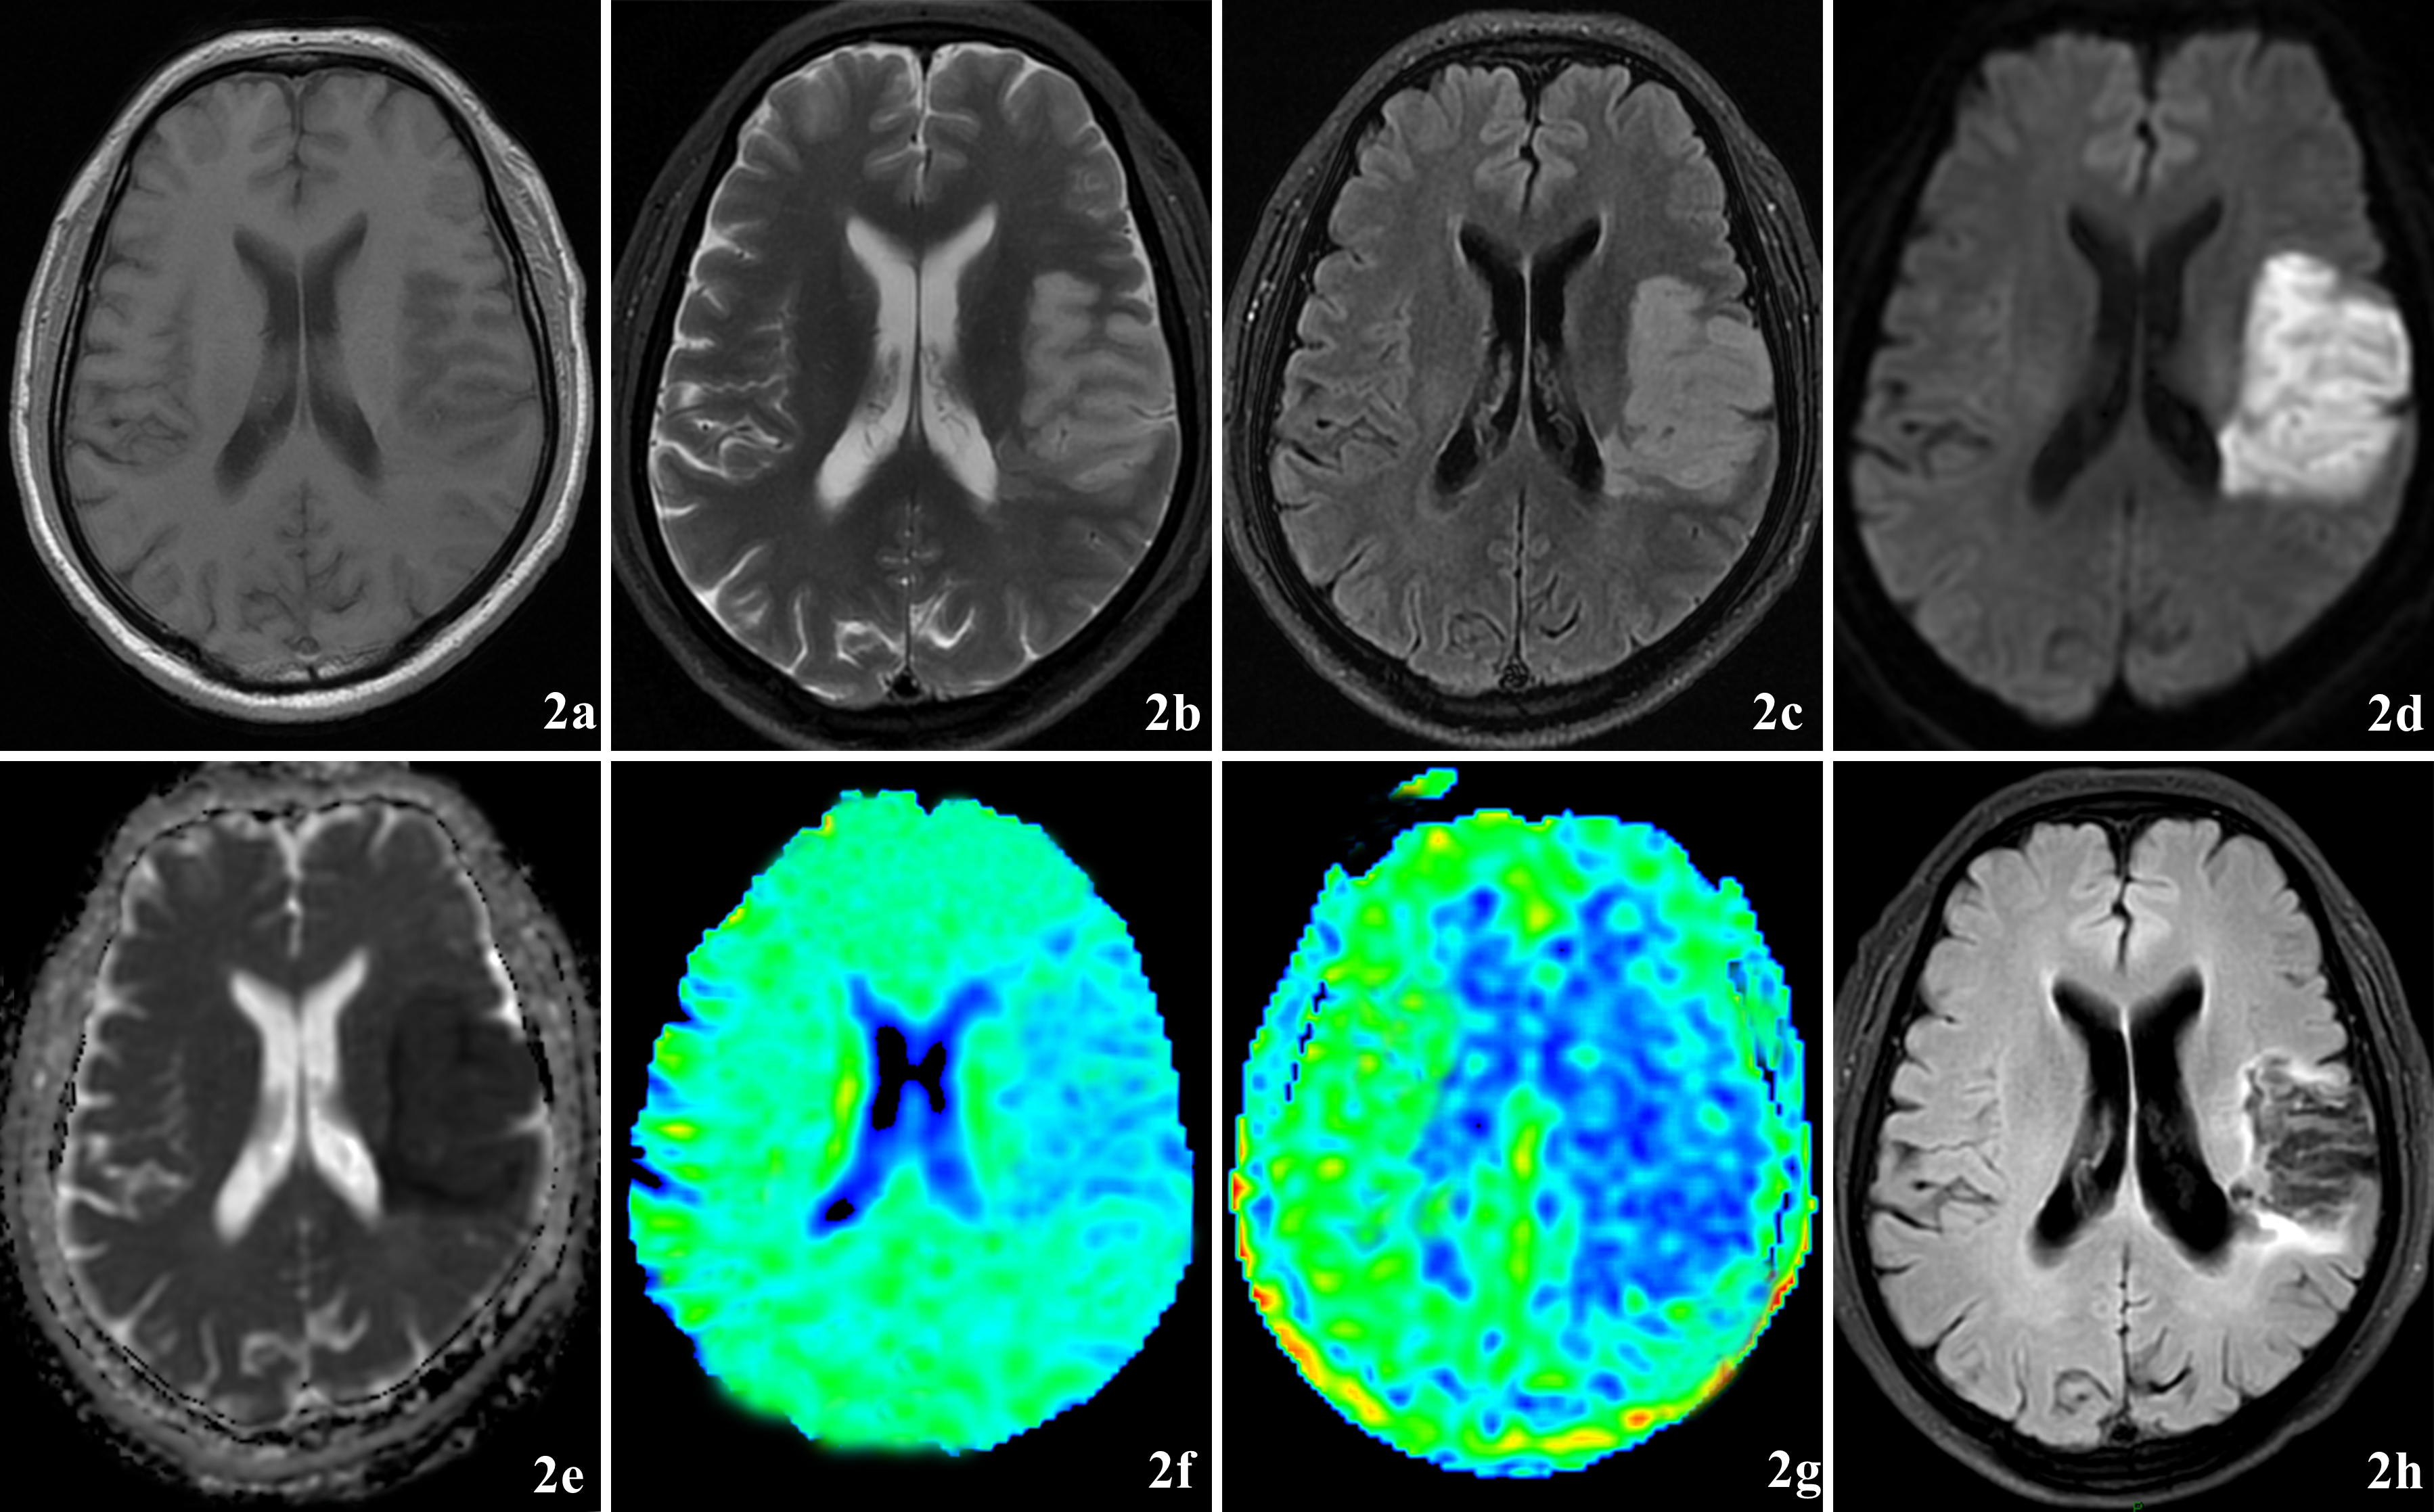
The patient was a 67-year-old male with alalia and right limb movement weakness for about 20 h. 2a-2c: Brain tissue swelling in the left temporal lobe with slightly hyperintensity on T1WI, T2WI, and marked hyperintensity on T2-FLAIR; 2d-2c:The DWI image showed the acute infarction lesion; 2f: APTw showed a larger signal decrease area which was larger than DWI lesion;2g:ASL showed a large area of low blood supply with an obvious DWI/ASL mismatch;2h: The size of the follow-up FLAIR image 3 months later was almost the same as the DWI, which shows t ischemic penumbra was present.
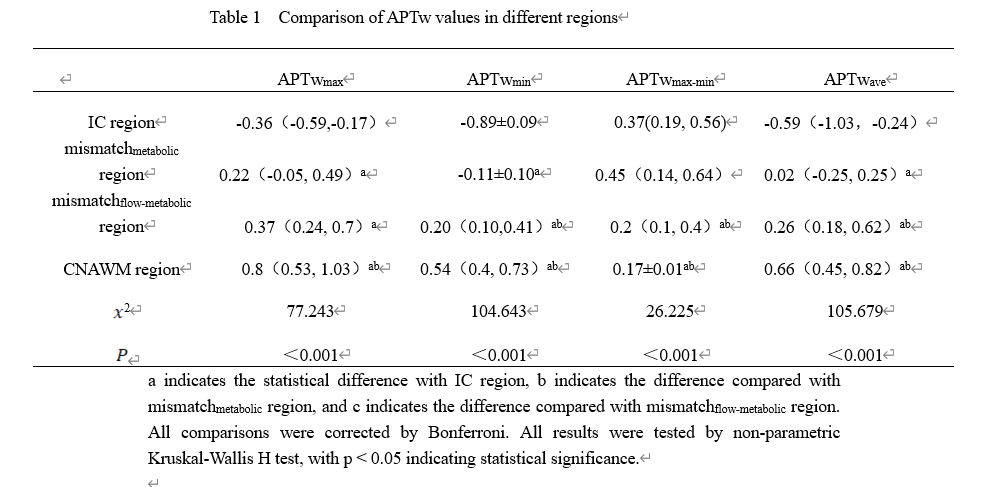
a indicates the statistical difference with IC region, b indicates the difference compared with mismatchmetabolic region, and c indicates the difference compared with mismatchflow-metabolic region. All comparisons were corrected by Bonferroni. All results were tested by non-parametric Kruskal-Wallis H test, with p < 0.05 indicating statistical significance.