0080
Predicting the onset of ischemic stroke with multi-parametric mapping based on multiple overlapping-echo detachment (MQMOLED) technique1Xiamen University, Xiamen, China, 2Department of Magnetic Resonance Imaging, the First Affiliated Hospital of Zhengzhou University, Zhengzhou, China, 3Department of Imaging Sciences, University of Rochester, Rochester, NY, United States, 4Clinical & Technical Support, Philips Healthcare, Shenzhen, China
Synopsis
Keywords: Stroke, Stroke, T2 mapping, ADC mapping
Motivation: Multi-parametric quantitative magnetic resonance imaging can characterize tissue properties of ischemic stroke patients noninvasively, but it is generally time consuming and susceptible to motions.
Goal(s): Investigate the value of single-shot multi-parametric mapping based on multiple overlapping-echo detachment (MQMOLED) method in distinguishing acute (≤7 days) and non-acute (>7 days) ischemic stroke patients.
Approach: MQMOLED was applied on ischemic stroke patients (N = 94) to obtain their T2 and ADC maps, based on which histogram analysis was performed.
Results: The combination of histogram parameters of T2 and ADC maps effectively discriminated between acute and non-acute ischemic stroke patients (AUC = 0.928).
Impact: The MQMOLED approach shows improvement in predicting acute and non-acute stroke patients. Ultrafast and motion-robust MQMOLED can be included in routine clinical MRI protocols to help patient stratification management for a timely beneficial therapy.
Introduction
Penumbra evolves rapidly in stroke patients within the first few hours,1,2 and 24-hour may be the threshold time window beyond which ischemic lesion becomes irreversible.3 Quantitative magnetic resonance imaging (qMRI) can provide specific diagnostic imaging features. The use of ultrafast qMRI to assess tissue viability in ischemic lesions and differentiate stroke stages could be crucial for ischemic stroke management.4 In this study, by using motion-robust multi-parametric mapping based on multiple overlapping-echo detachment (MQMOLED) method,5,6 we investigated the temporal changes of T2 and ADC maps in ischemic lesions within both 14-day and 40-day stroke patients. Moreover, we estimated the combined histogram parameters of T2 and ADC maps in predicting acute (≤7 days) and non-acute (>7 days) stroke patients.7Methods
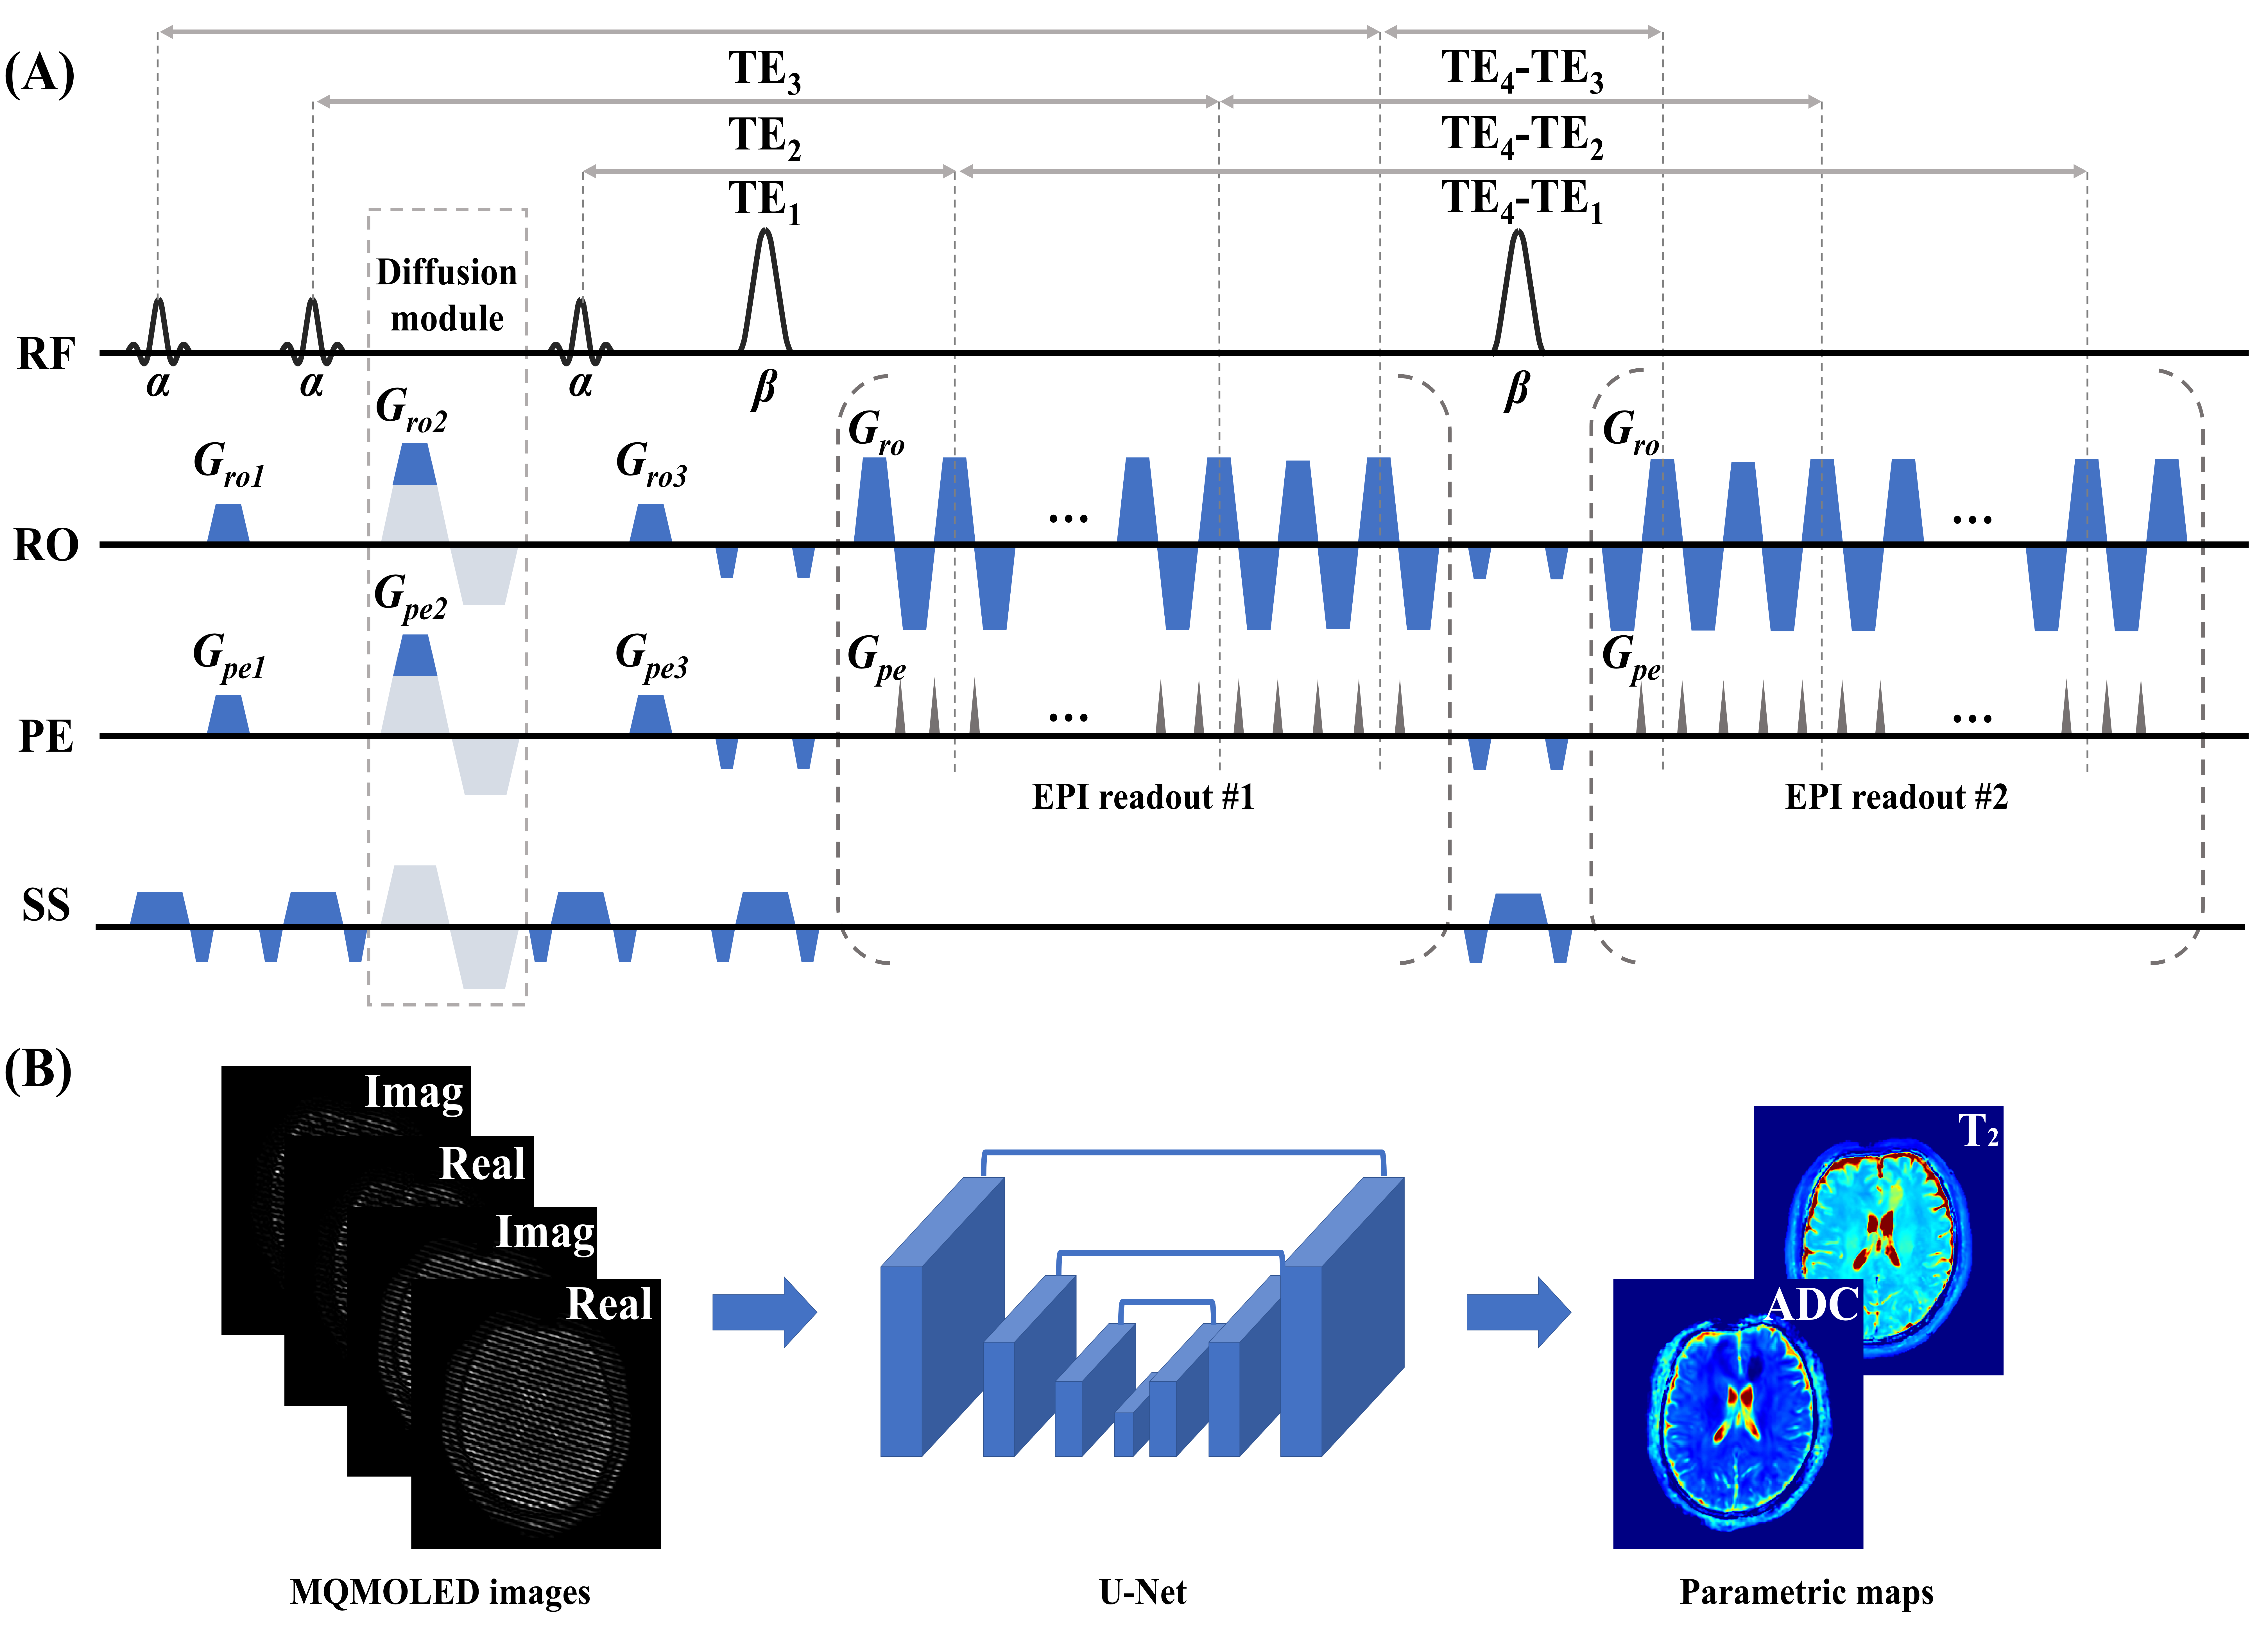
Data acquisition and reconstruction: 94 stroke patients (29/65 female/male, 57±13 years) of known onset were recruited and scanned in a 3.0 T scanner (MAGNETOM Prisma, Siemens Healthcare, Germany). The study was approved by the local Institutional Review Board. Written informed consent was obtained from every participant.The acquisition protocol included MQMOLED (TR/TE1/TE2/TE3/TE4 = 10000/23.76/88.76/112.56/131.74 ms, resolution = 1.7×1.7×1.7 mm³, FOV = 220×220 mm², b-value = 0 and 1000 s/mm², four diffusion directions, 20 slices, total scan time = 70 s), DWI (TR/TE = 4600/80 ms, FOV = 240×240 mm², b-value = 0 and 1000 s/mm², four diffusion directions, 20 slices). T2-FLAIR (TI/TR/TE= 2130/6500/85 ms, FOV = 225×240 mm², 21 slices). The DW images were used to estimated reference ADC maps. Ischemic cores were defined as the overlapping hyperintense regions on the DWI and T2-FLAIR maps. All images were registered to T2-FLAIR images using FSL,8 on which ROIs for calculating ischemic cores and contralateral areas were manually segmented. Patients were divided into acute (1-7 days, N = 16), subacute (7-14 days, N = 19), chronic (14-60 days, N = 37) and prolong (>60 days, N = 21) groups and also divided into acute (≤7 days, N = 17) and non-acute (>7 days, N = 77) groups7 for logistic regression. The reconstruction was the same as previous studies,6,9 except that five different noise levels were added to 10,000 synthetic training samples produced by Bloch simulation. Figure 1 shows the pulse sequence and the corresponding deep learning reconstruction network.
Data analysis: Histogram analysis of ischemic cores was performed on both parametric maps and normalized T2-FLAIR image. Kruskal-Wallis test was performed to compare histogram parameters across groups. Spearman’s correlation analysis was done to assess the relationship between histogram parameters and onset time. Logistic regression was conducted to compare classification performance between acute and non-acute groups. p < 0.05 was considered statistically significant.
Results
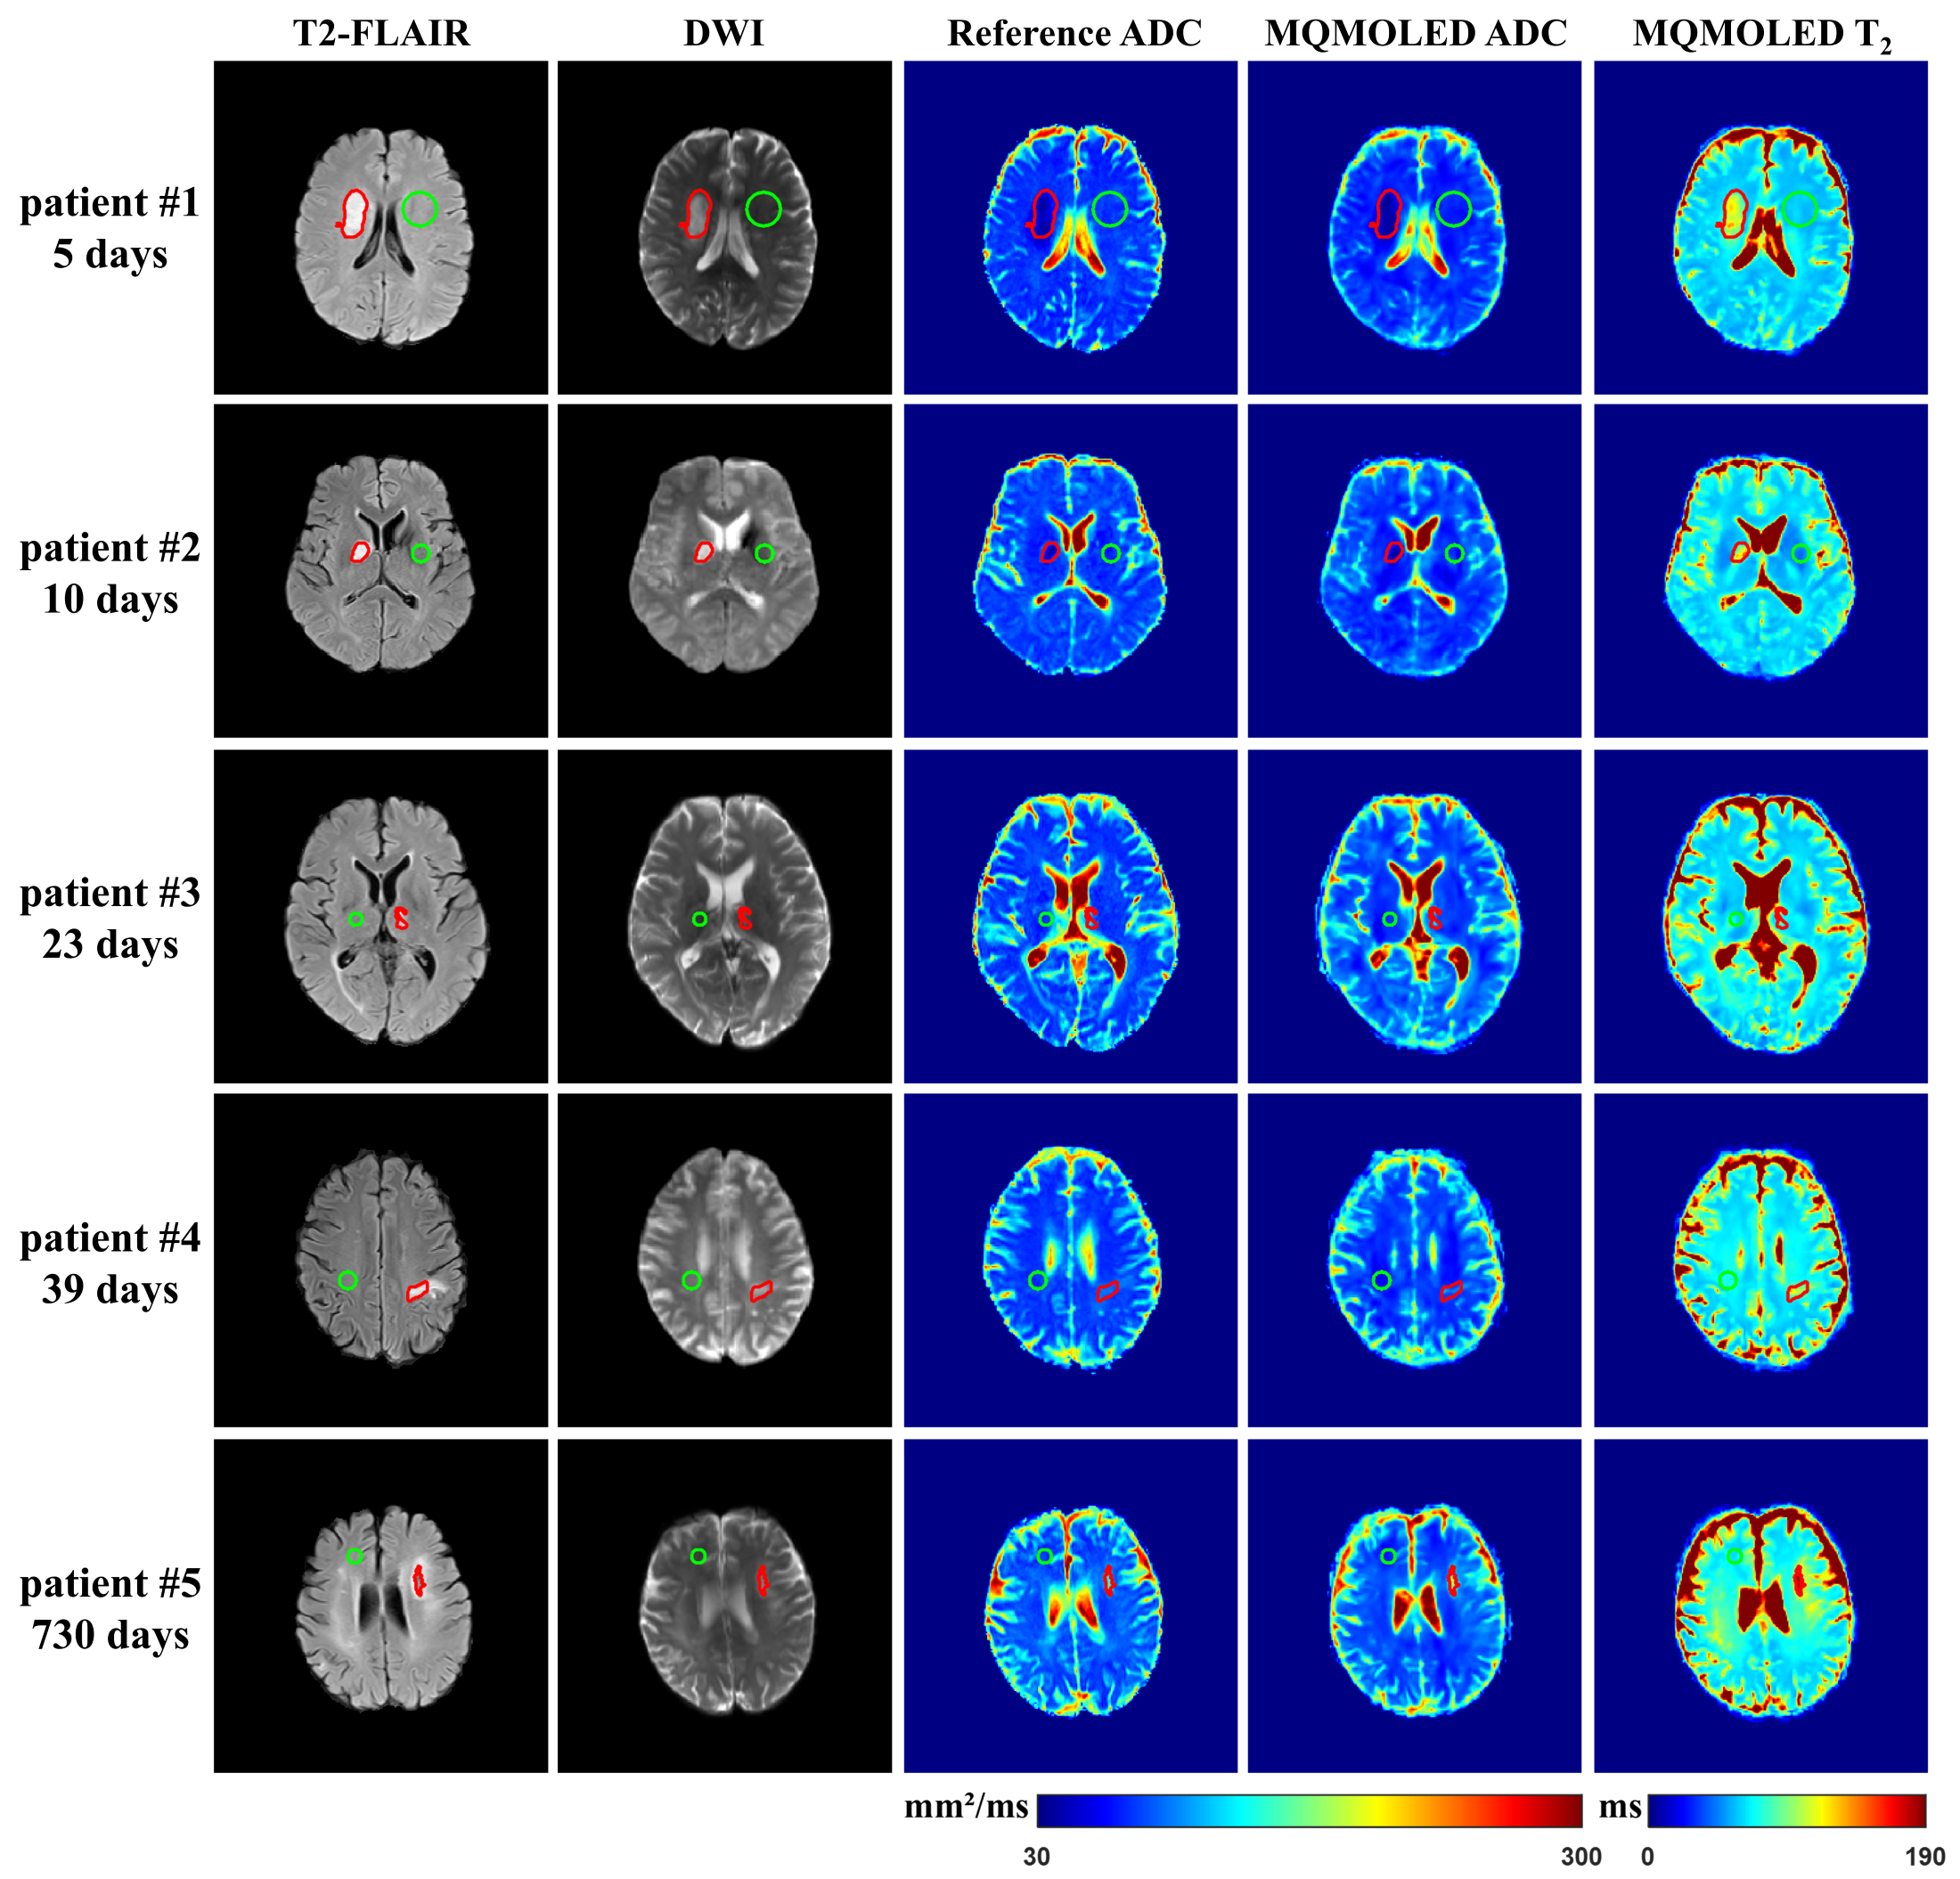
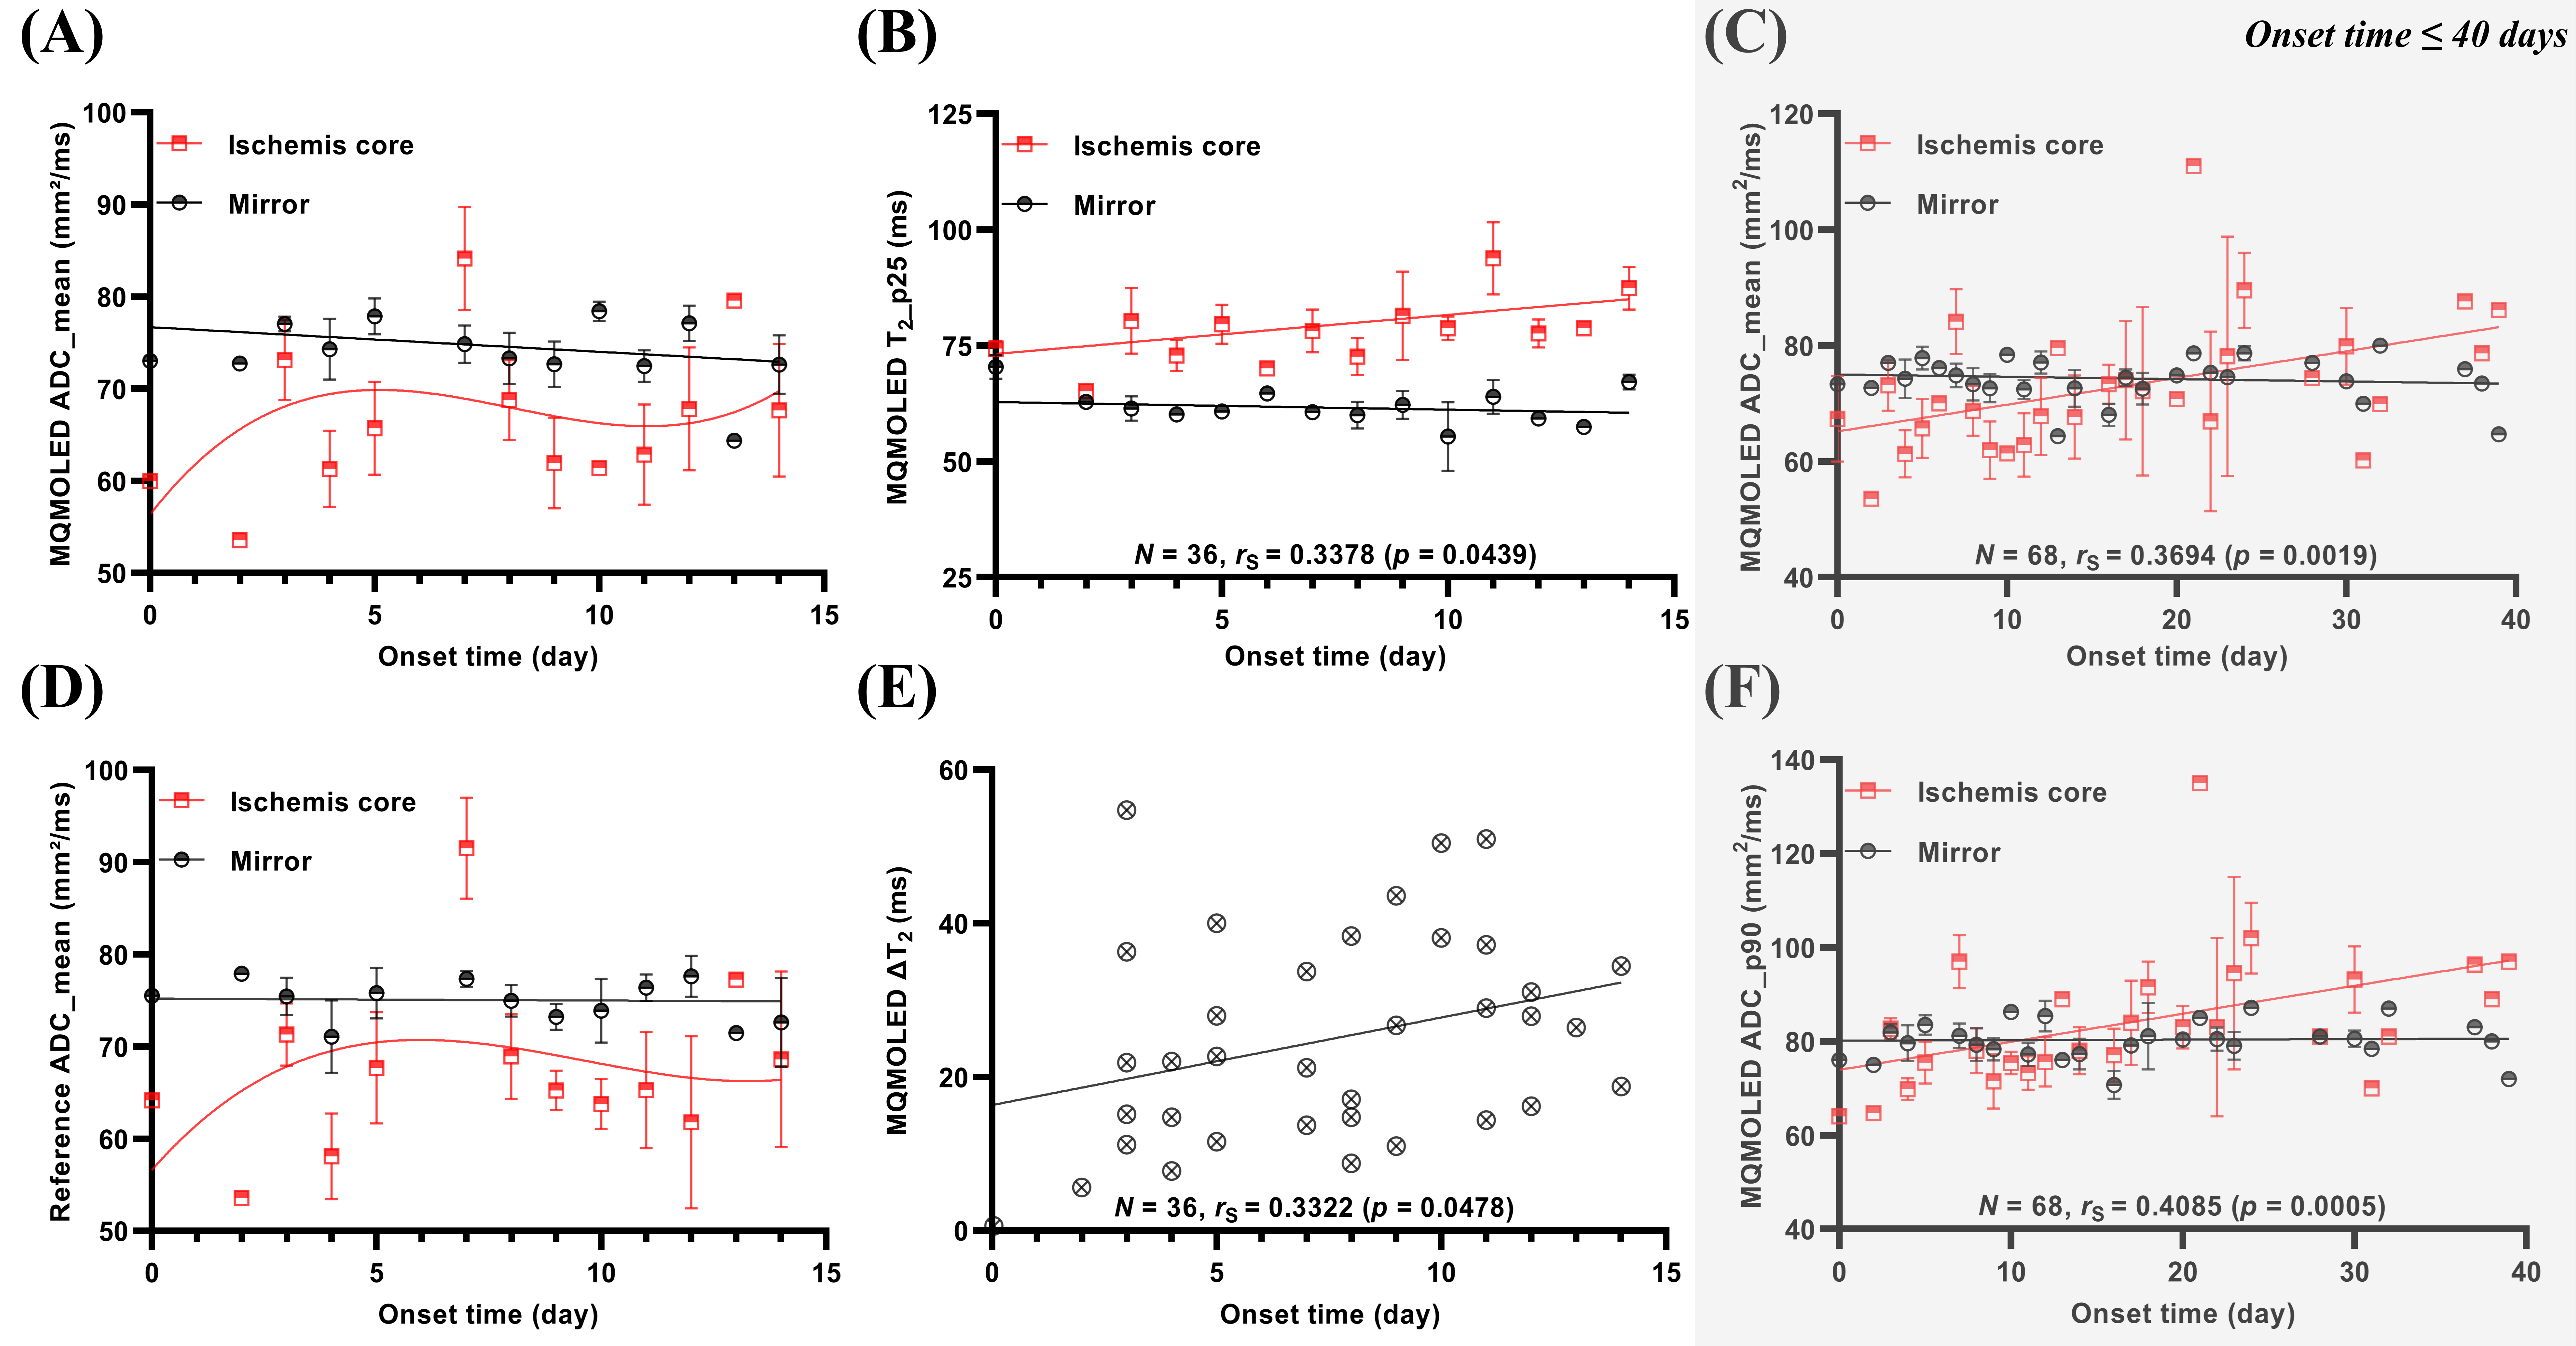
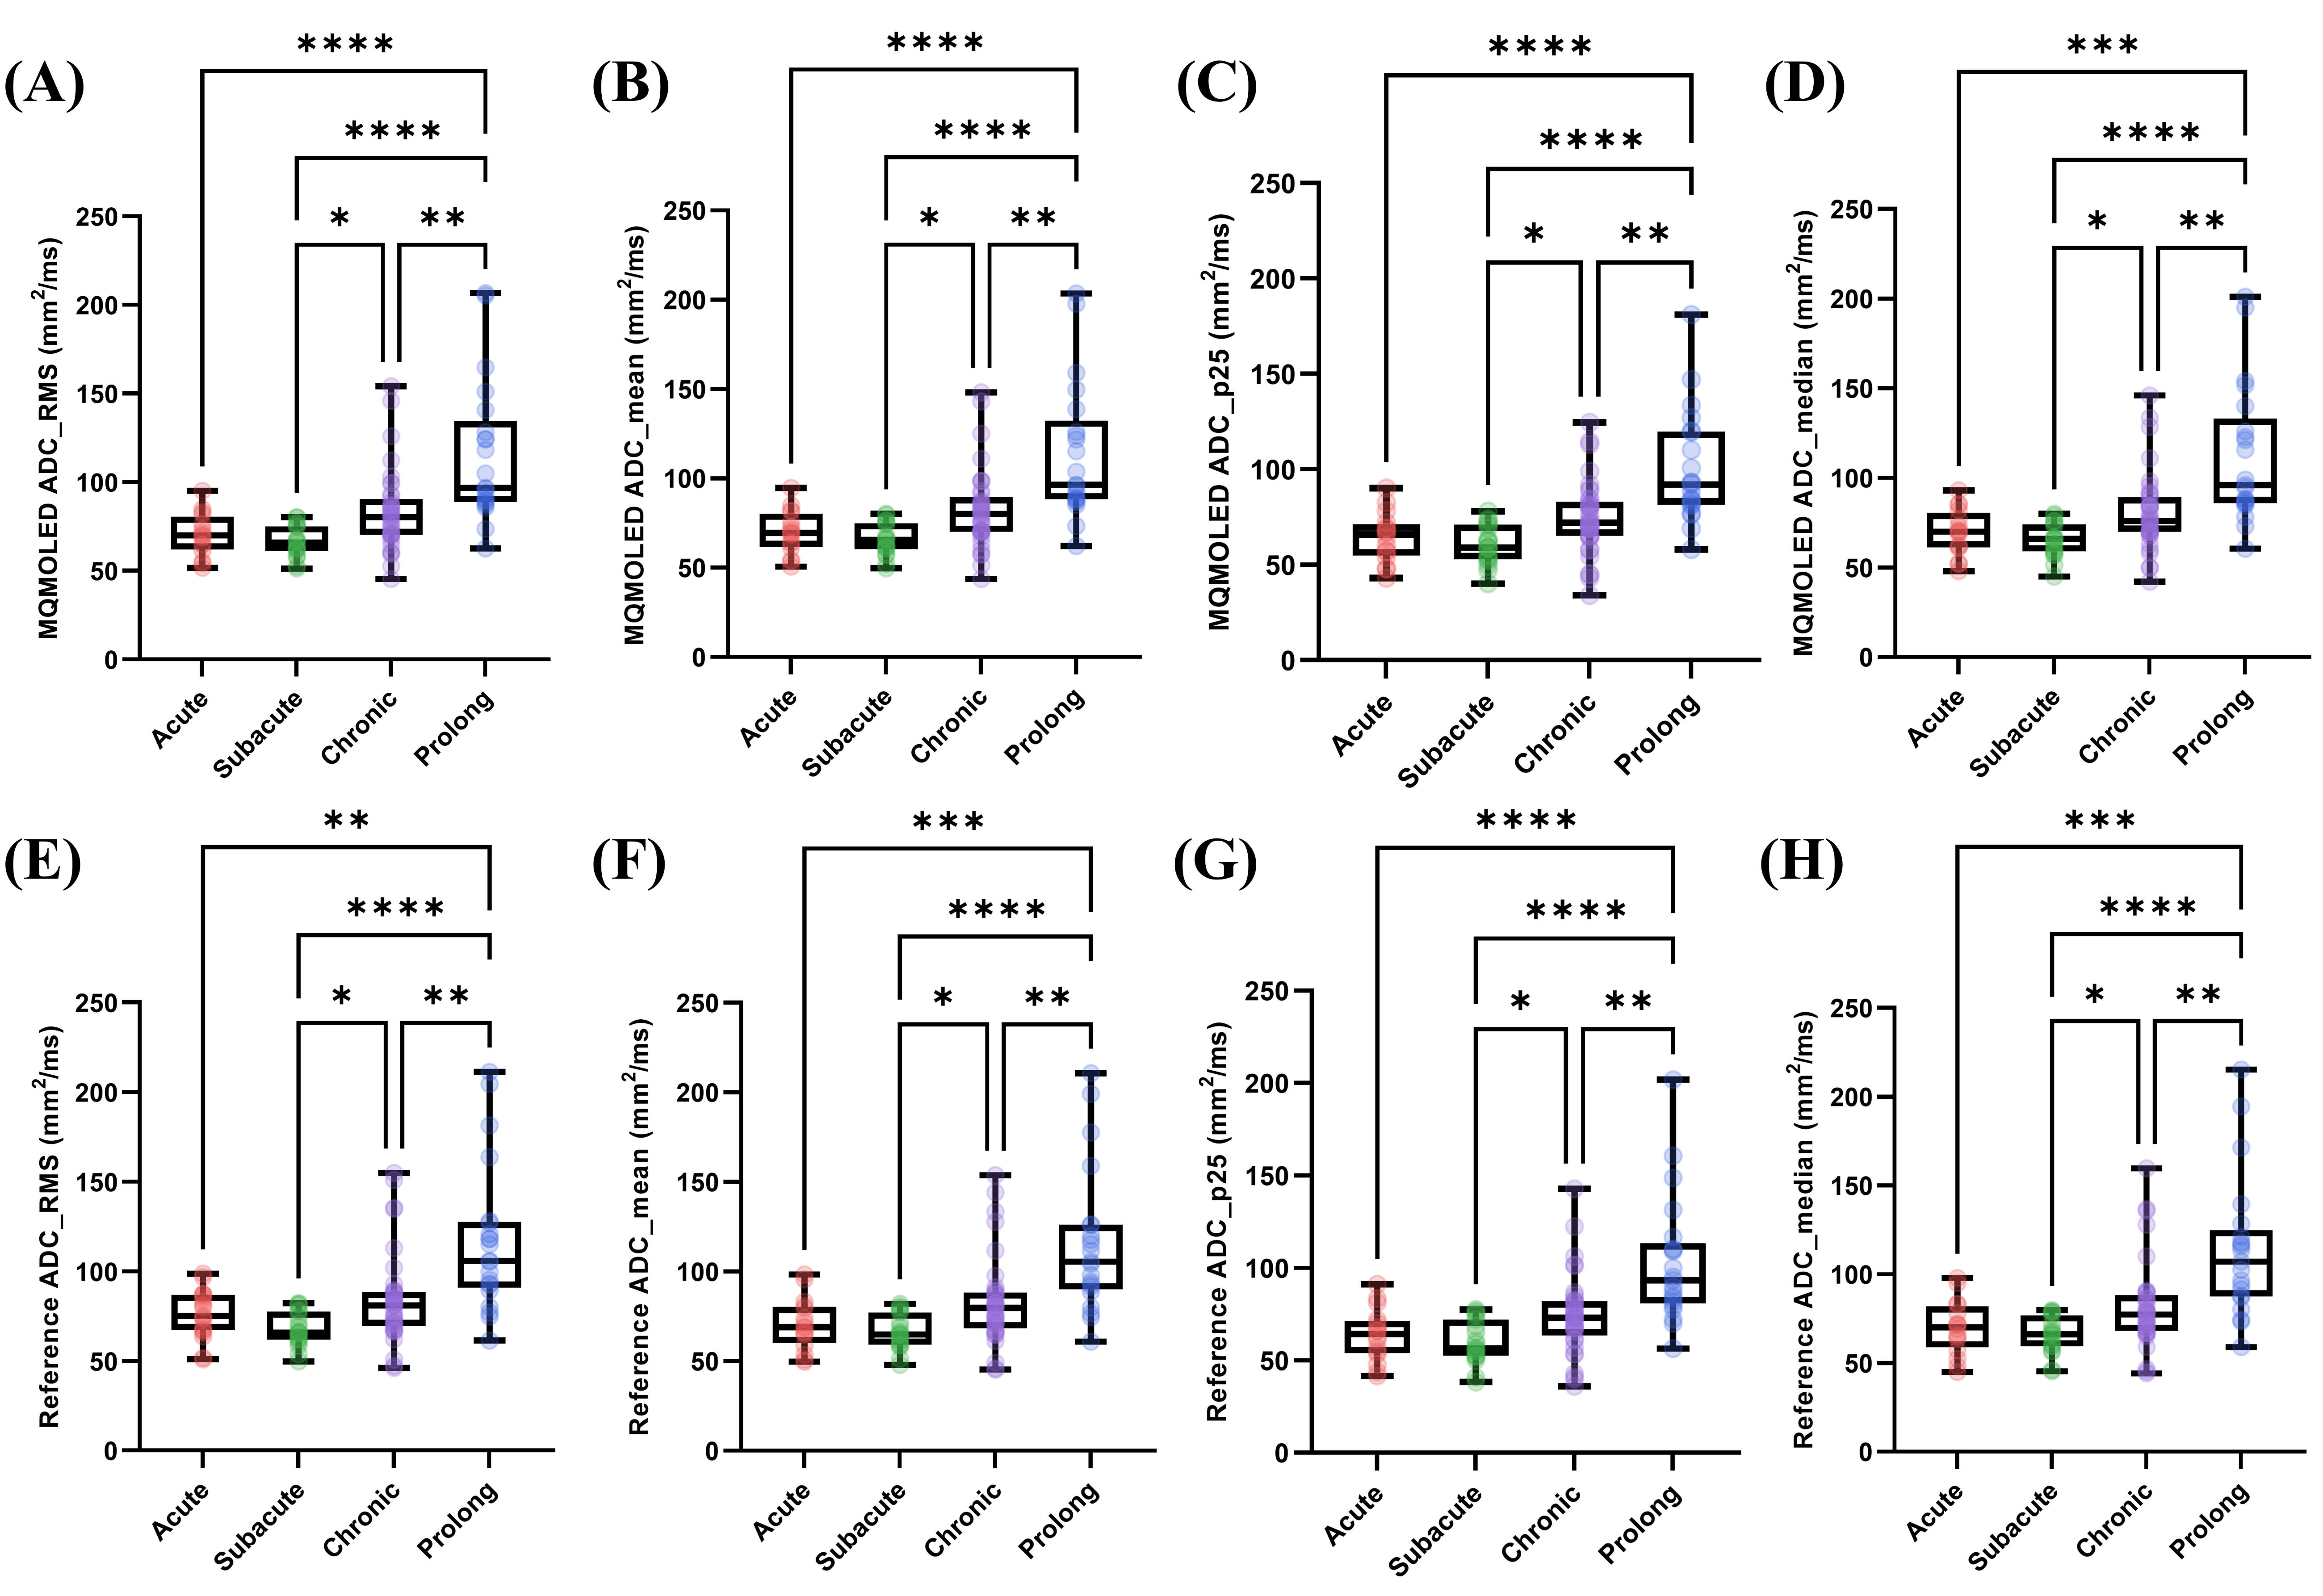
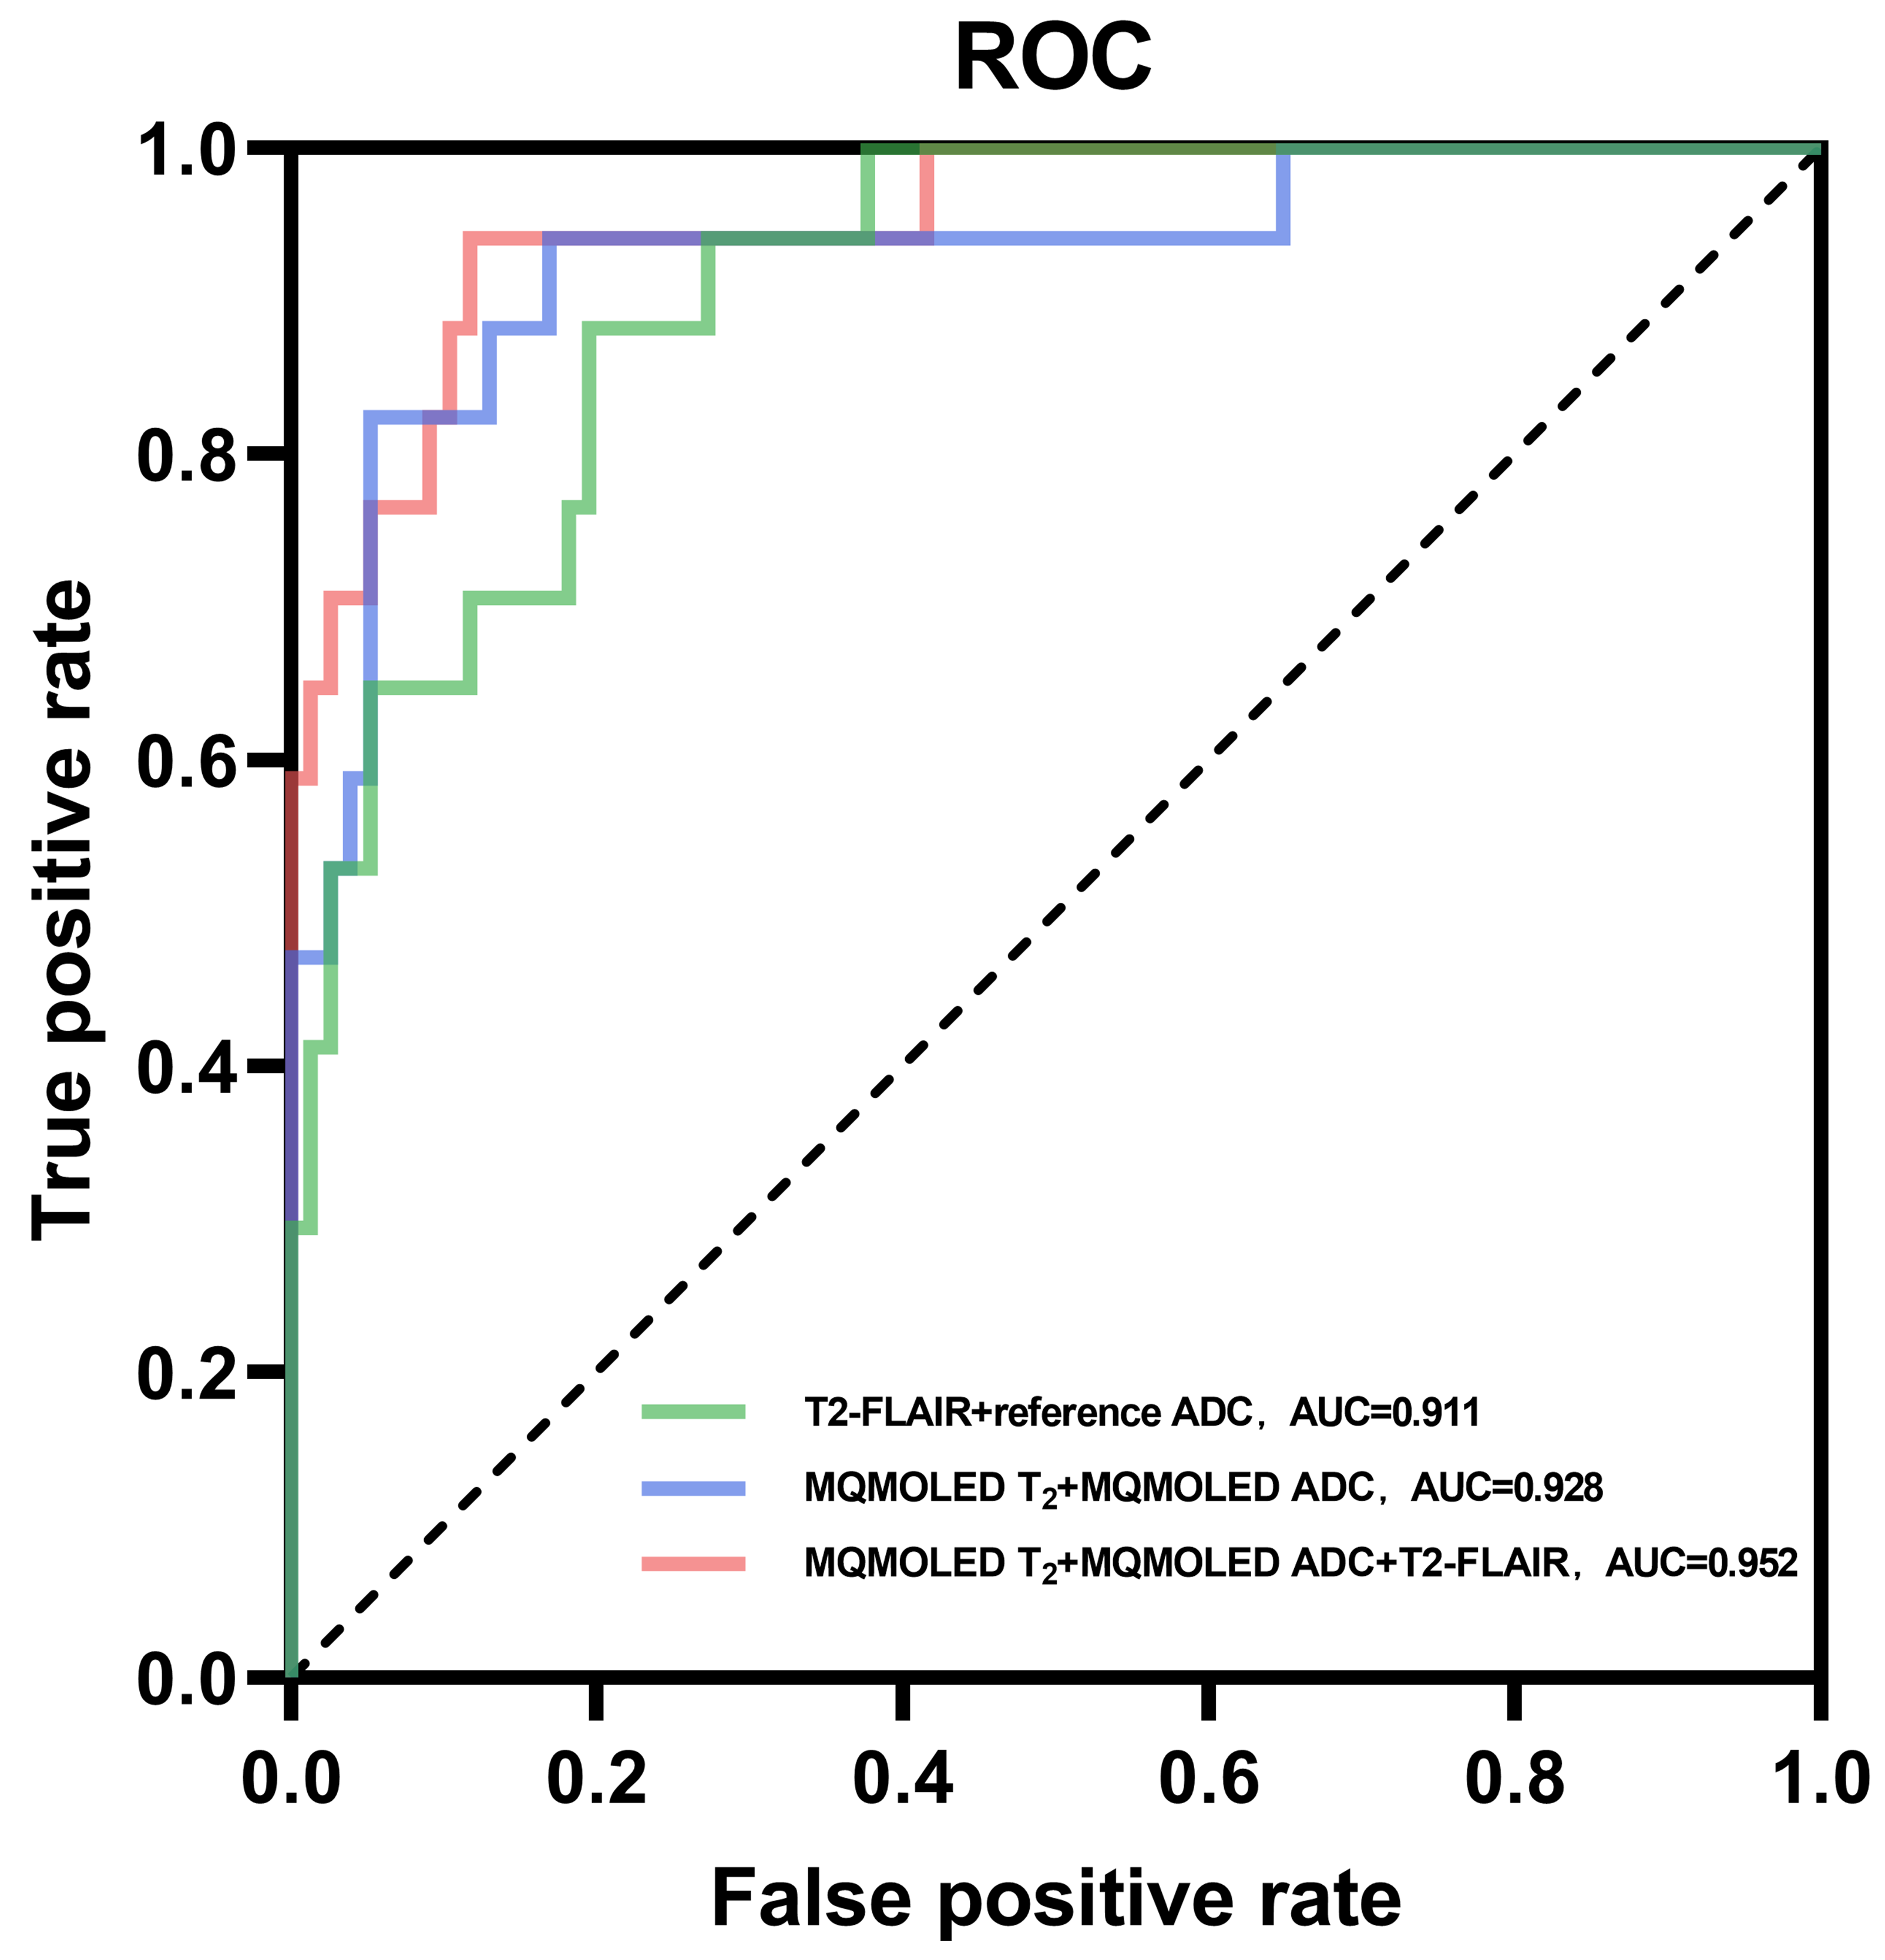
Five representative multimodal images are shown in Figure 2, where continuously increased MQMOLED T2 values within ischemic core compared to the contralateral side can be observed. The MQMOLED ADC values within ischemic core initially showed an upward trend, then a downward trend on the 5th day, and then an upward trend on the 11th day as the onset time increased within 14 days (Figure 3), while the 25th percentile of MQMOLED T2 was positively correlated to the onset time (Spearman's rank correlation coefficient rS = 0.3378). The mean (rS= 0.3694) and the 90th percentile of MQMOLED ADC (rS = 0.4085) were positively correlated to the onset time within 40 days, while the contralateral values of both were relatively stable. Significant differences were observed between all stages, except for non-significant distinction between the acute and subacute stages, the acute and chronic stages (Figure 4). The performances of MQMOLED ADC and reference ADC are basically consistent. The combination of multiple histogram parameters of MQMOLED T2 and MQMOLED ADC (AUC = 0.928) has better discriminative ability compared with the reference ADC and T2-FLAIR (AUC = 0.911) (Figure 5), and the combination with T2-FLAIR (AUC=0.952) further improves its performance.Discussion
The present study is the first clinical application of MQMOLED in ischemic stroke. The results indicate that multi-parametric quantitative analysis can more effectively distinguish between acute and non-acute ischemic stroke patients than traditional ADC and T2-FLAIR combination, and can reveal temporal changes of T2 and ADC in ischemic stroke at multiple time scales for comprehensive stratification of stroke therapy. Due to the small number of patients, particularly those in the acute phase, only a limited demonstration of the potential stroke manifestations is given.Conclusion
Using ultrafast and motion robust MQMOLED technique, we accessed the temporal changes of T2 and ADC maps in ischemic lesions and demonstrated their good performance in predicting acute and non-acute ischemic stroke patients.Acknowledgements
This work was supported in part by the National Natural Science Foundation of China under grant numbers 12375291 and 22161142024, and in part by the National Key R&D Program of China under Grant 2022YFC2402102.References
1. Thirugnanachandran T, Ma H, Singhal S, et al. Refining the ischemic penumbra with topography. Int J Stroke. 2018;13:277-284.
2. Dirnagl U, Iadecola C, Moskowitz MA. Pathobiology of ischaemic stroke: an integrated view. Trends Neurosci. 1999;22:391-397.
3. Bonova P, Burda J, Danielisova V, Nemethova M, Gottlieb M. Development of a pattern in biochemical parameters in the core and penumbra during infarct evolution after transient MCAO in rats. Neurochem Int. 2013;62:8-14.
4. Allen LM, Hasso AN, Handwerker J, Farid H. Sequence-specific MR imaging findings that are useful in dating ischemic stroke. Radiographics. 2012;32:1285-1297.
5. Yang QQ, Lin YH, Wang JC, et al. Model-based synthetic data-driven learning (MOST-DL): application in single-shot T2 mapping with severe head motion using overlapping-echo acquisition. IEEE Trans Med Imaging. 2022;41:3167-3181.
6. Ma LC, Wu J, Yang QQ, et al. Single-shot multi-parametric mapping based on multiple overlapping-echo detachment (MOLED) imaging. Neuroimage. 2022;263:119645.
7. Bernhardt J, Hayward KS, Kwakkel G, et al. Agreed definitions and a shared vision for new standards in stroke recovery research: The stroke recovery and rehabilitation roundtable taskforce. Int J Stroke. 2017;12:444-450.
8. Woolrich MW, Jbabdi S, Patenaude B, et al. Bayesian analysis of neuroimaging data in FSL. Neuroimage. 2009;45:173-186.
9. Zhang J, Wu J, Chen SJ, et al. Robust single-shot T2 mapping via multiple overlapping-echo acquisition and deep neural network. IEEE Trans Med Imaging. 2019;38:1801-1811.
Figures