0077
PET and MRI identification of metabolically injured brain and associated resting state networks to predict outcome of DBS chronic stroke therapy1Cleveland Clinic, Cleveland, OH, United States
Synopsis
Keywords: Stroke, Stroke
Motivation: Determine which chronic post-stroke patients with hand motor deficits will benefit from cerebellar deep brain stimulation (DBS).
Goal(s): Test the hypothesis that patients with metabolic injury to fewer rsfMRI networks experienced greater motor improvement after DBS.
Approach: Analysis of baseline 18F-fluorodeoxyglucose PET identified the most metabolically injured brain region (“PET-max-imbalance-region”) for 12 patients. The total number of rsfMRI networks and volume of functionally connected brain associated with the “PET-max-imbalance-region” were calculated.
Results: : Lower numbers of rsfMRI networks intersecting the “PET-max-imbalance-region” and total volumes of brain contained within networks and functionally connected to the “PET-max-imbalance-region” were associated with greater arm function improvement after DBS.
Impact: Metrics quantifying the extent of resting-state functional MRI networks associated with the most metabolically injured brain region could be considered as inclusion/exclusion criteria when evaluating candidates for cerebellar deep brain stimulation treatment for chronic post-stroke hand motor deficits.
Introduction
In a phase I clinical trial, deep brain stimulation (DBS) of the cerebellar dentate enhanced rehabilitation of hand motor deficits in the majority of chronic post-stroke participants1. There is a need for a method to identify which patients will benefit from this invasive therapy. We hypothesized that patients with metabolic injury to fewer resting-state functional MRI (rsfMRI) networks would benefit the most from this DBS-based therapy.Methods
Subjects: All 12 chronic post-stroke patients who participated in the clinical trial were analyzed.Clinical metrics: Upper-extremity impairment was quantified using the Fugl-Meyer Assessment (FM-UE), and arm function was quantified using the Arm Motor Ability Test (AMAT). The change in arm metrics ΔAMAT and ΔFM-UE were calculated as the difference in score immediately after stimulation was stopped relative to prior to the start of stimulation.
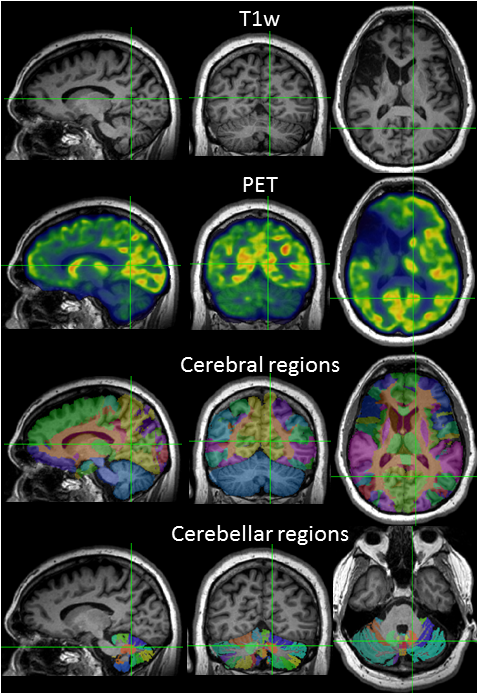
MRI acquisition:T1-weighted (T1w) MRI was acquired at 3 tesla (T), using magnetization prepared rapid gradient echo imaging with 192 1mm-thick slices, in-plane resolution=1x1mm2. Positron emission tomography (PET) acquisition: After a 4-hour fast, 18F-fluorodeoxyglucose was injected. Forty minutes later, PET data were acquired for 15 minutes. Metabolic imbalance analysis: Metabolic imbalance was assessed on baseline PET, in the cortical, subcortical and cerebellar regions defined by the USCBrain2 and SUIT3 atlases. Metabolic imbalance was calculated for each region (Fig. 1), as the ipsilesional mean PET signal (µPET-ipsi) divided by the contralesional (µPET-contra) in the cerebrum, and µPET-contra/µPET-ipsi in the cerebellum. The “PET-max-imbalance-region” was defined as the brain region with the largest metabolic imbalance.
RsfMRI network analysis: We identified the rsfMRI networks directly impacted by the “PET-max-imbalance-region” from the Yeo6 7 cortical networks and the Shirer7 14 networks of cortical and subcortical regions, by multiplying the “PET-max-imbalance-region” binary mask by the binary masks of each of the networks. We identified the rsfMRI networks functionally connected to the “PET-max-imbalance-region”, using the grey-matter masked “PET-max-imbalance-region” as a seed for z-map calculation from a normative set of 7T rsfMRI from 18 healthy subjects8. Significant functionally connected clusters from the z-map were calculated using fsl-cluster9.
Statistics: Parametric and non-parametric methods were used to test hypotheses. The total number of networks and volume of significant functionally connected clusters were used as predictors, outcomes were ΔFM-UE, ΔAMAT, clinically improved/unimproved AMAT (ΔAMAT≥0.32)10 and FM-UE (ΔFM-UE≥4.25)11.
Results
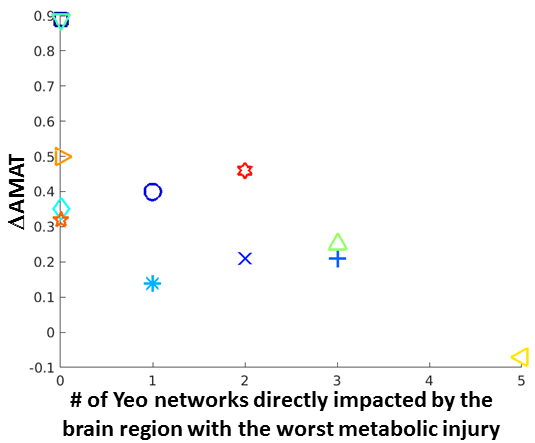
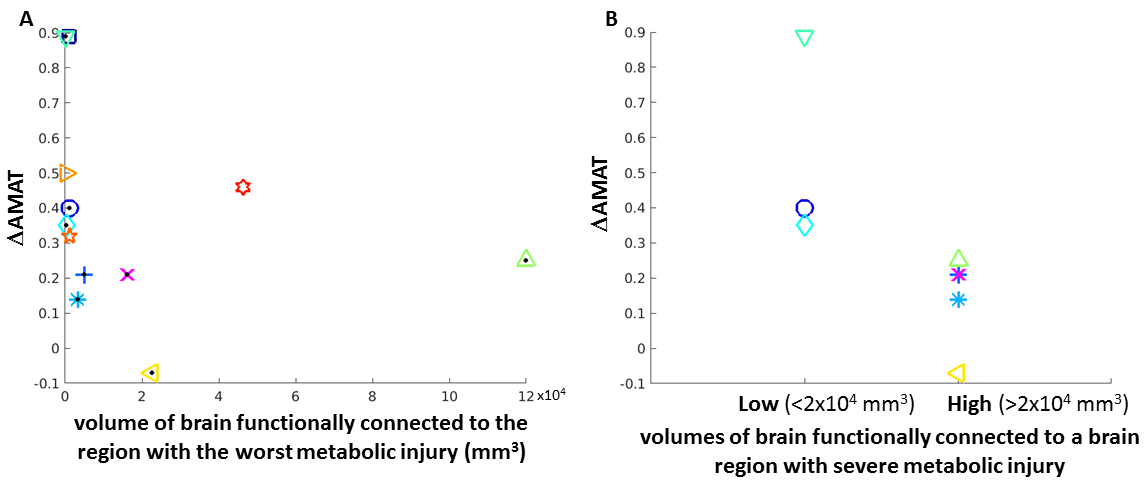
We found a significant negative association between ΔAMAT and the number of Yeo networks contained within the “PET-max-imbalance-region” (Fig. 2; ρ=-0.71, p=0.01). All participants whose “PET-max-imbalance-region” was not within any of the Yeo networks showed clinically improved ΔAMAT.We found a significant negative association between ΔAMAT and the total volume within the Yeo networks of significant functionally connected clusters to the “PET-max-imbalance-region” (Fig. 3A; ρ=-0.63, p=0.03). When we considered only those participants who exhibited the most severe metabolic injury (imbalance<0.6), we found that that participants with more brain volume functionally connected to the “PET-max-imbalance-region” experienced lower ΔAMAT compared to those with less functionally connected brain volume (Fig. 3B; p=0.035; ΔAMAT in low connected volume: mean=0.547, standard deviation (SD)=0.298; in high connected volume: mean=0.148, SD=0.128). Analyses of the Shirer networks revealed significantly lower volumes of brain functionally connected to the “PET-max-imbalance-region” for auditory (p=0.003) and posterior salience (p=0.03) networks, and significantly higher volumes in the basal ganglia (p=0.03) network for participants who showed clinically improved ΔAMAT compared to the group of patients who did not improve.
Discussion
We hypothesized that patients with metabolic injury to fewer rsfMRI networks would benefit the most from DBS-based therapy. We found that lower numbers of Yeo networks intersecting the most metabolically injured region were associated with greater arm function improvement. All participants with their most metabolically injured region outside the Yeo cortical networks experienced clinically improved arm function. The hypothesis was extended to test if patients with less brain volume functionally connected to the metabolically injured region would benefit the most from the therapy. We showed that lower volumes of significant clusters functionally connected to the most metabolically injured region and contained within the Yeo networks were associated with greater arm function improvement. The effect was most pronounced when evaluating the subset of patients with the most severe metabolic injuries. Analyses of the Shirer networks further suggested that patients with metabolic injury functionally connected to cortical networks benefit less from the therapy.Conclusion
Cerebellar dentate DBS can enhance rehabilitation of hand motor deficits in chronic post-stroke patients. There is a need for a method to identify which patients will benefit. We have shown that metrics quantifying the extent of rsfMRI networks associated with the most metabolically injured brain region may be important predictors of treatment outcome.Acknowledgements
This study was supported by the National Institutes of Health Brain Research Through Advancing Innovative Neurotechnologies Initiative under grant number UH3NS100543 (to A.M. and K.B.) as well as by Enspire DBS, a spin-off company of Cleveland Clinic.References
1. Baker KB, Plow EB, Nagel S, et al. Cerebellar deep brain stimulation for chronic post-stroke motor rehabilitation: a phase I trial. Nat Med. 2023 Sep;29(9):2366-2374.
2. Joshi AA, Choi S, Liu Y, et al. A hybrid high-resolution anatomical MRI atlas with sub-parcellation of cortical gyri using resting fMRI. J Neurosci Methods. 2022 May 15;374:109566.
3. Diedrichsen J, Maderwald S, Küper M, et al. Imaging the deep cerebellar nuclei: a probabilistic atlas and normalization procedure. Neuroimage. 2011;54(3):1786-1794.
4. Yeo BTT, Krienen FM, Sepulcre J, et al. The organization of the human cerebral cortex estimated by intrinsic functional connectivity. J Neurophysiol. 2011;106(3):1125-1165.
5. Shirer WR, Ryali S, Rykhlevskaia E, et al. Decoding Subject-Driven Cognitive States with Whole-Brain Connectivity Patterns. Cereb Cortex. 2012 Jan; 22(1):158-165.
6. Jones S, Nemani A, Huang X, et al. Comparing left vs right handed normal subjects using high spatial-resolution resting-state fMRI at 7T. Proc. Intl. Soc. Mag. Reson. Med. 2023;31;3493.
7. Jenkinson M, Beckmann CF, Behrens TEJ, et al. FSL. Neuroimage; 2012; 62(2):782-790.
8. Fulk G, Martin R, Page SJ. Clinically Important Difference of the Arm Motor Ability Test in Stroke Survivors. Neurorehabil Neural Repair. 2017 Mar;31(3)272-279.
9. Page SJ, Fulk GD, Boyne P. Clinically important differences for the upper-extremity Fugl-Meyer Scale in people with minimal to moderate impairment due to chronic stroke. Phys Ther. 2012 Jun;92(6):791-8.
Figures