0073
Dynamic evolution of infarct volumes at MRI in ischemic stroke due to large vessel occlusion1Institute of Bioimaging, University of Bordeaux, Bordeaux, France, 2Neuroimagerie diagnostique et thérapeutique, CHU de Bordeaux, Bordeaux, France, 3Neuroimaging department, Kyoto University Hospital, Kyoto, Japan, 4INSERM CIC-IT U1433, University of Nancy, Nancy, France, 5INSERM U1266, Institut de Psychiatrie et Neurosciences de Paris, Paris, France, 6CNRS, UMR 5293, Institut des Maladies Neurodégénératives, University of Bordeaux, Bordeaux, France, 7Bordeaux INP, LABRI, CNRS, UMR5800, University of Bordeaux, Talence, France, 8INSERM, Neurocentre Magendie, University of Bordeaux, Bordeaux, France, 9Service de Neurologie et Unité de Neuro Vasculaire, Hôpital FOCH, Suresnes, France, 10Unité neurovasculaire, CHU de Toulouse, Toulouse, France, 11Unité neurovasculaire, CHU de Bordeaux, Bordeaux, France, 12CNRS, UMR-5293, University of Bordeaux, Bordeaux, France
Synopsis
Keywords: Stroke, Stroke, Image analysis; Prognosis
Motivation: The typical infarct volume courses of stroke patients are still unknown.
Goal(s): We aimed to reveal the spatiotemporal evolutions of infarct volumes and show that such charts help anticipate clinical outcomes.
Approach: On a dataset of large vessel occlusion stroke patients, we performed unsupervised clustering approach to identify groups and then extrapolated pseudo-longitudinal core volume models across time for each group before assessing the growth phenotypes influence on outcome.
Results: We identified three groups with different infarct growth profiles: slow: 11%, intermediate: 62% and fast: 27%, which translated into archetype brain locations. This growth phenotypes significantly predicted the 3-month handicap in two datasets.
Impact: Infarct volumes show stereotypical spatiotemporal courses according to the patient phenotype of resistance to ischemia referred to as slow, intermediate, or fast progressors, which help to anticipate the clinical outcome for new patients.
Introduction
In the event of cerebral large vessel occlusion (LVO), the infarct growth rate (IGR) shows a wide variability from one patient to another1, which is determined by multiple factors: a major one being a good collateral circulation2. More recently, it appeared that personal identification of the rate of infarct progression, now referred to as slow - intermediate - or fast progressors3,4, could be the final output of the inter-individual tolerance to ischemia. However, there are currently no standard criteria to define these groups, but several somewhat arbitrary definitions and thresholds5-9. In this study, we aimed to reveal the typical spatiotemporal evolutions of infarct growth caused by LVO according to the phenotype of tolerance to ischemia. We also assessed the relevance of such new charts to anticipate the patient evolution in the prospect of guiding the therapeutic strategies ultimately.Methods
This is a secondary analysis from prospectively collected databases (FRAME, 2017–2019; ETIS, 2015–2022). We extracted data from acute MRI exams acquired on anterior LVO stroke patients with witnessed onset and we defined training and validation datasets. In the training dataset, we used an unsupervised clustering approach to identify subtypes of stroke progressors with a Gaussian mixture approach10, constraining the model to 3 clusters, as described in previous literature, later referred to slow, intermediate, and fast progressors. We explored the different clinical and imaging characteristics between the growth groups with Kruskal-Wallis rank sum tests. Then, we extrapolated pseudo-longitudinal core volume models across time for each group. We used the non-parametric LOESS approach (locally estimated scatterplot smoothing) consisting of fitting models to localized subsets of the data point by point11 to represent smooth curves. In parallel, we computed 3D frequency maps for consecutive bins of 1h in each growth group using the core masks normalized in MNI152.Then, we built, using the training dataset, a logistic regression model with the growth group as the primary independent variable and a good clinical outcome, defined by a 3-month Rankin scale (mRS) ≤2, as the dependent variable. We quantified the model performance with the area under the receiver operating characteristic curve (AUC) with bootstrap technique to estimate the 95% CI. Then, we applied this prognosis model to the patients from the independent dataset for external validation. We projected the core volumes of these new patients onto the longitudinal profiles created above to identify their growth groups from the smallest Euclidean distance to one of the three fitting curves. We compared the probability of these new patients having good outcome with the actual mRS and re-computed AUC and 95% CI. Analyses were implemented on R (version 4.2.2) and SPSS (version 29.0.1.0).Results
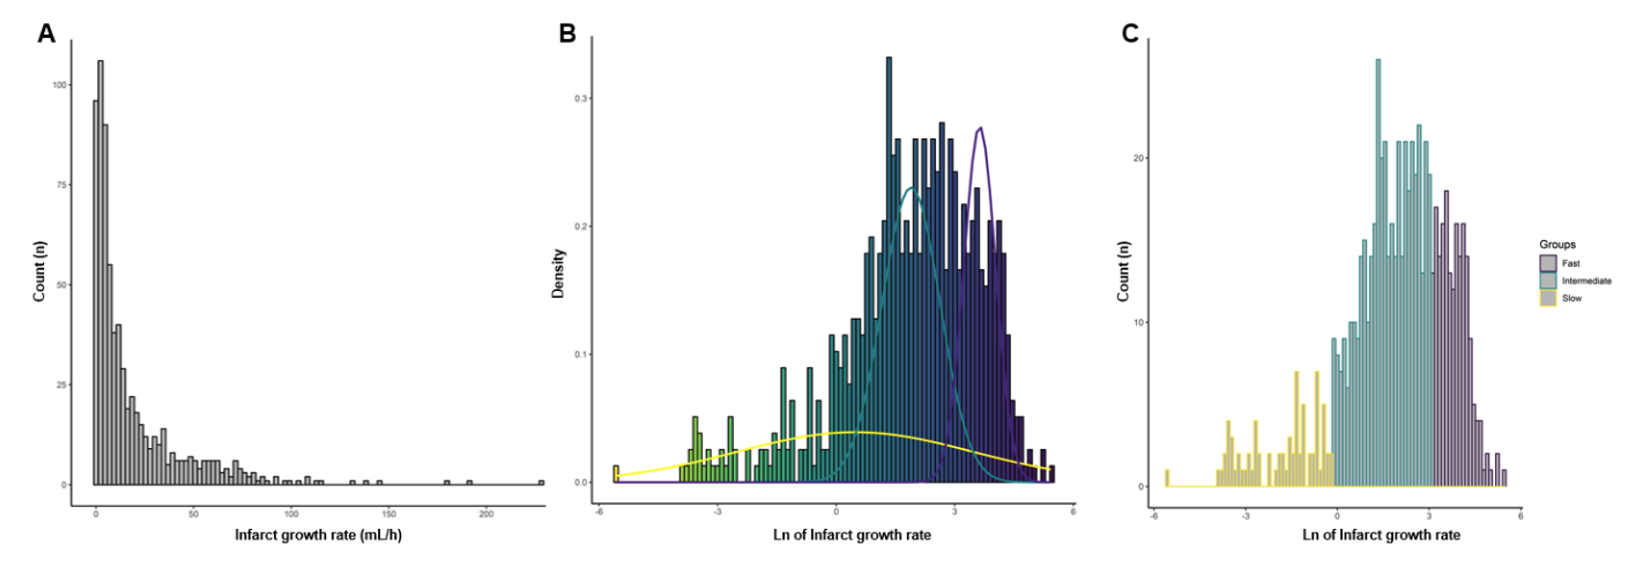
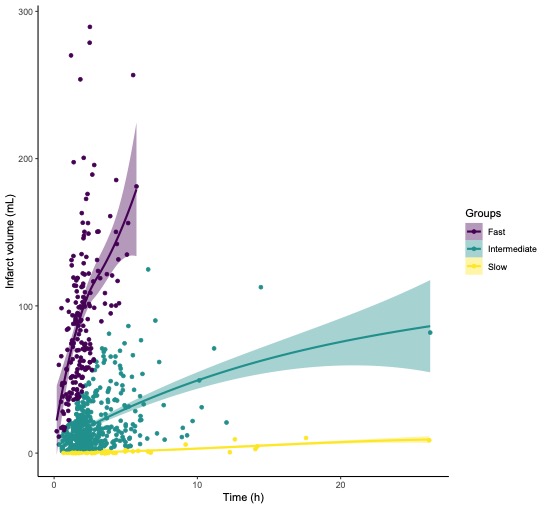
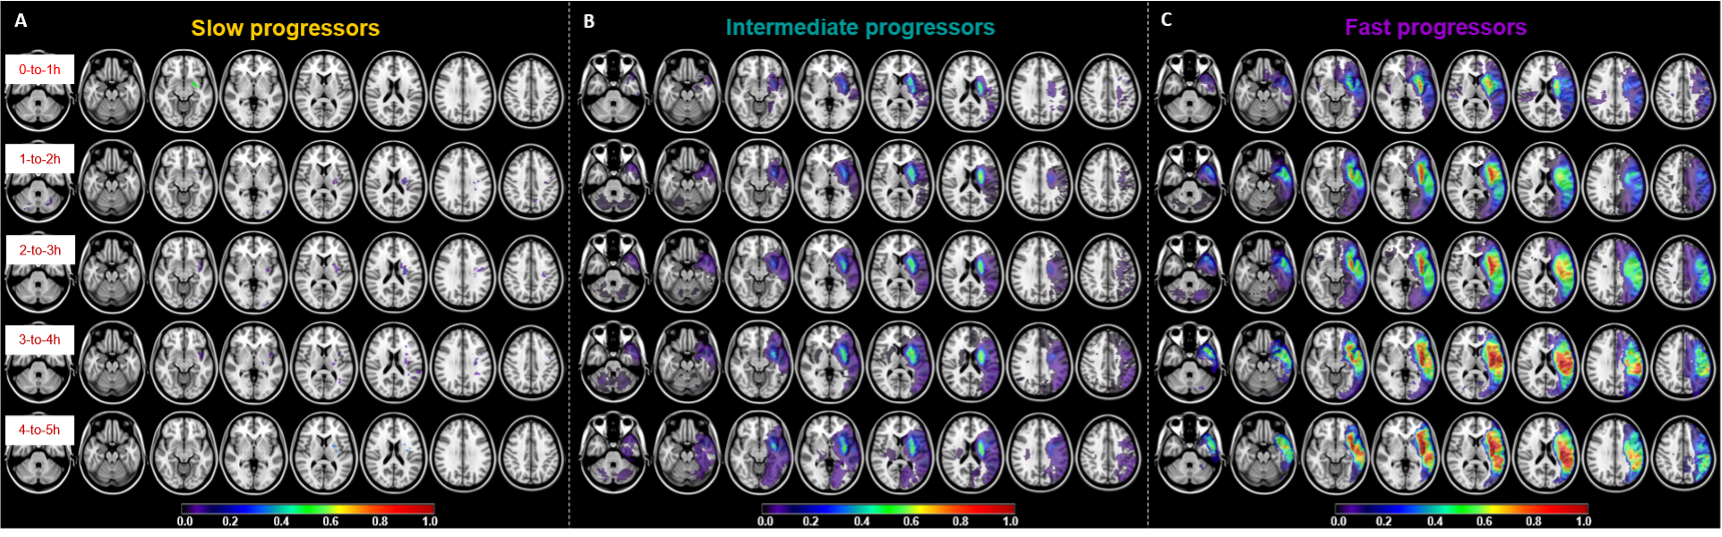
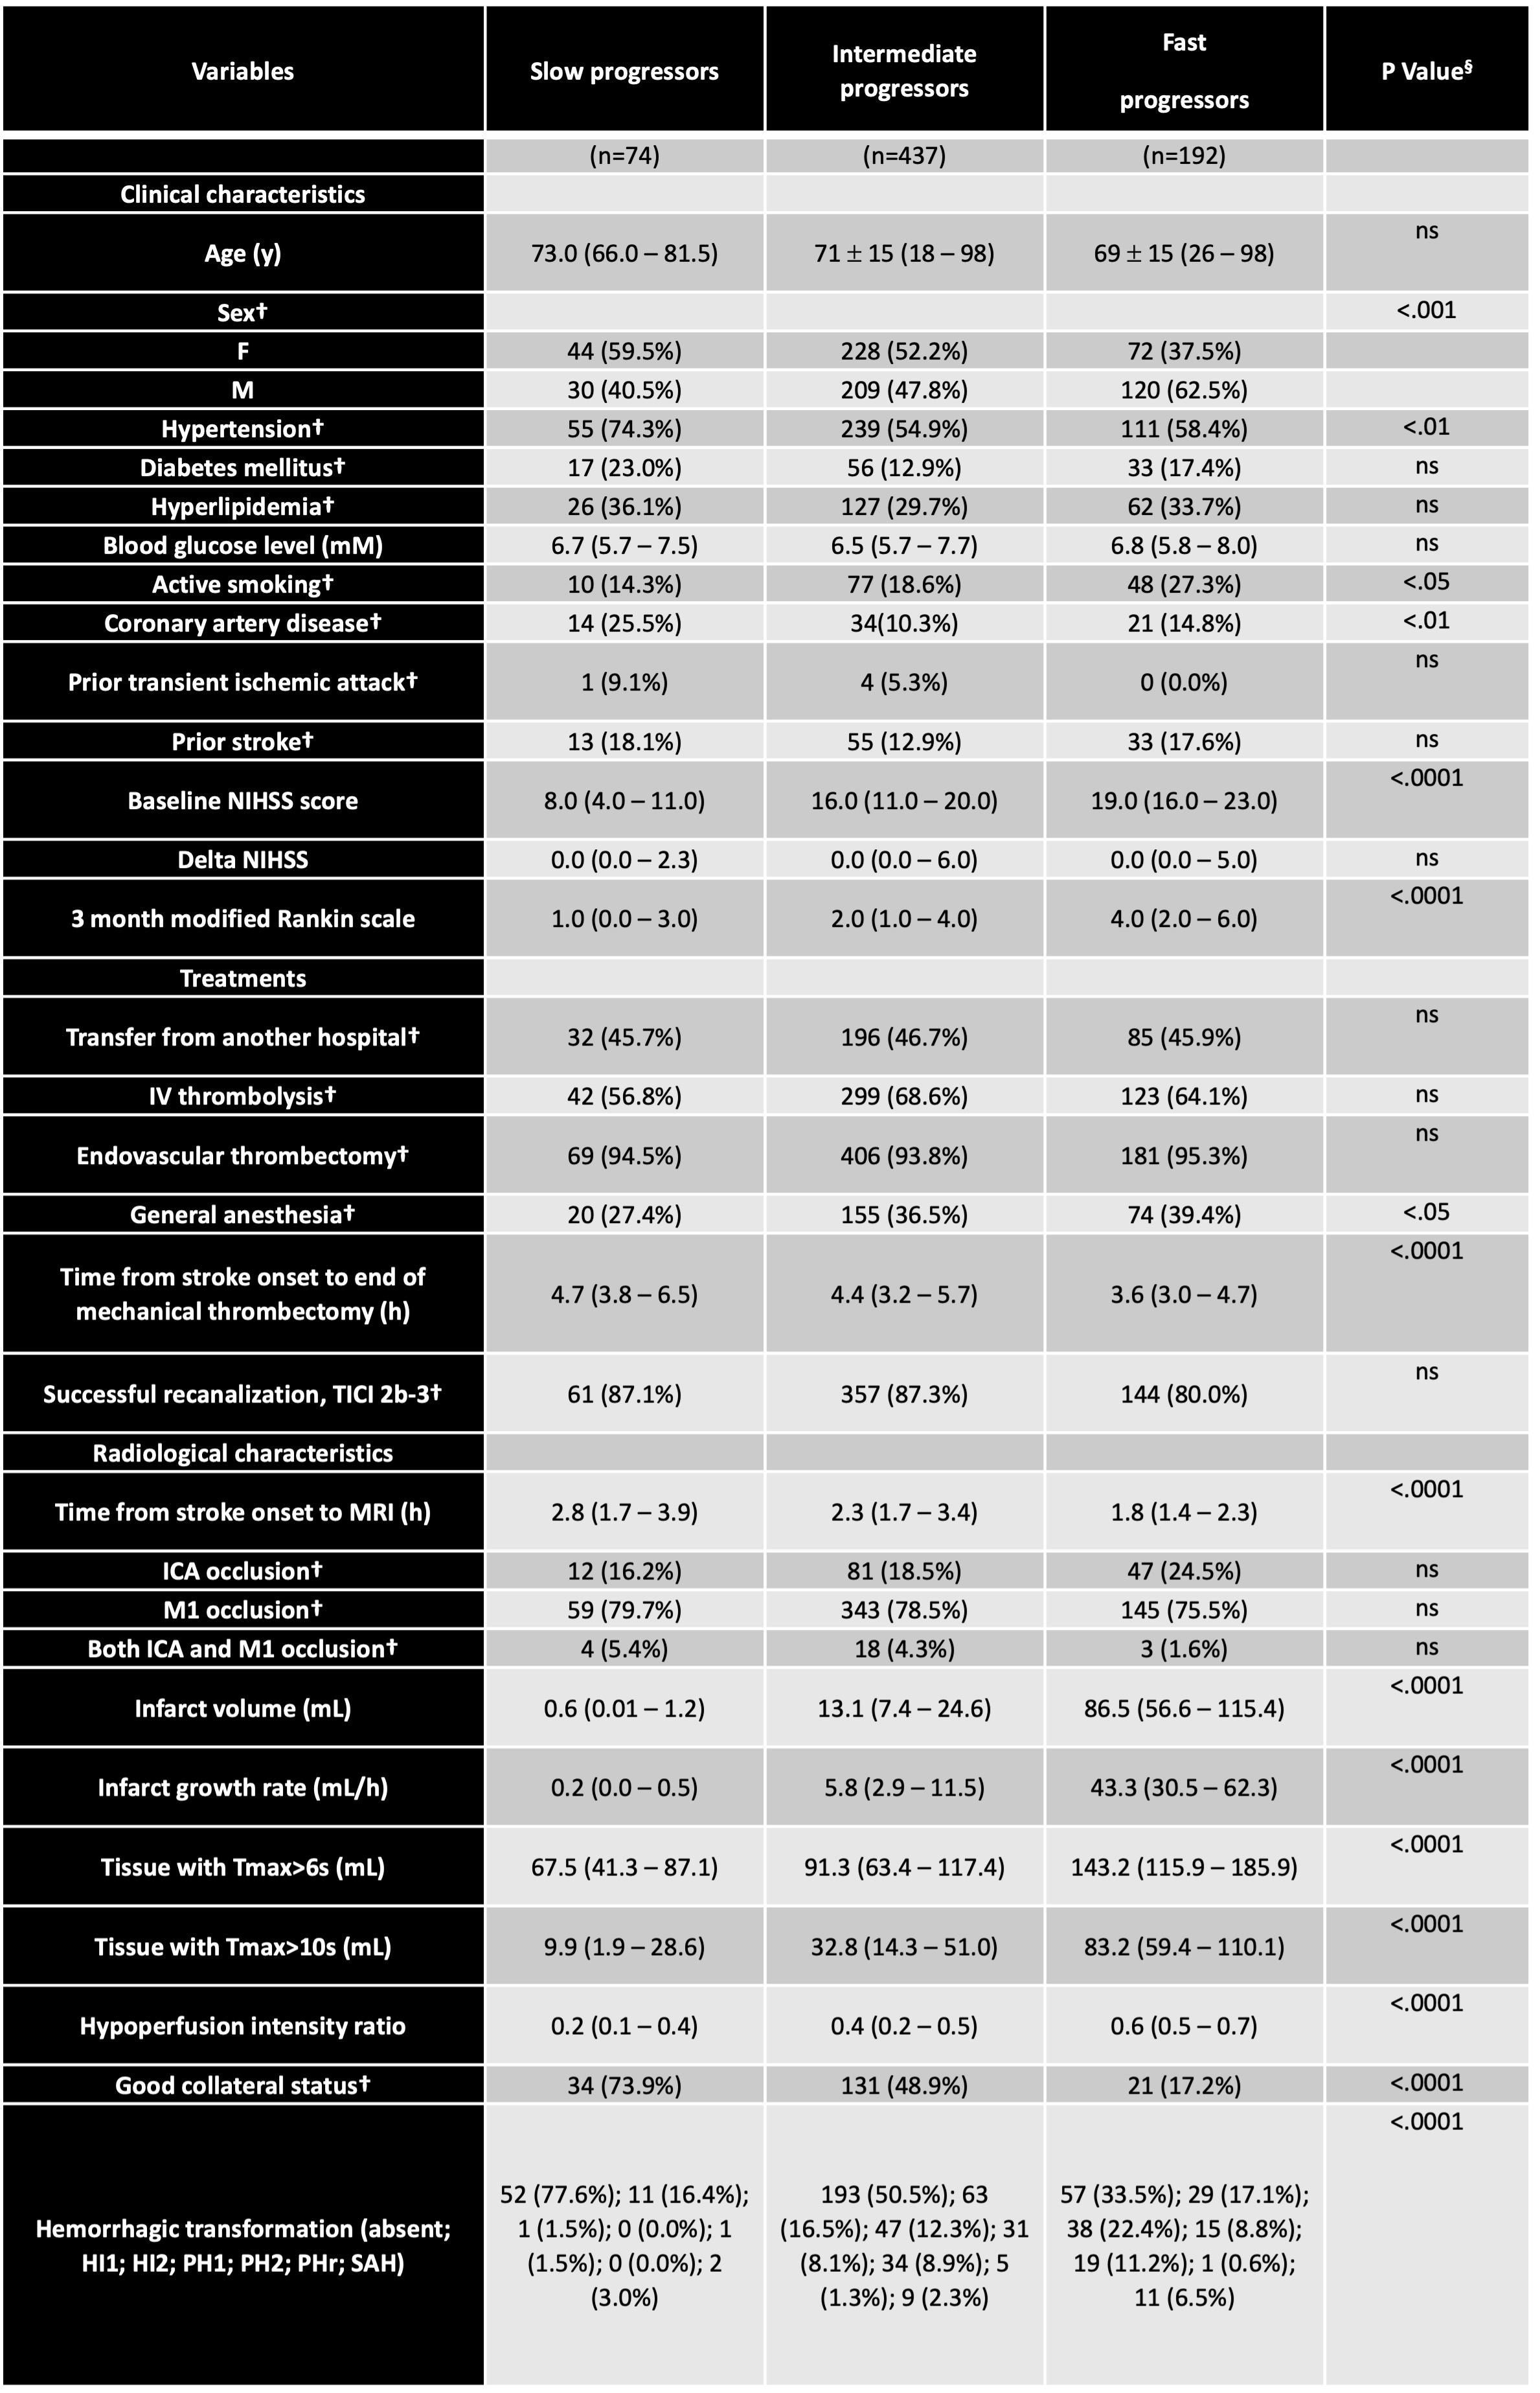
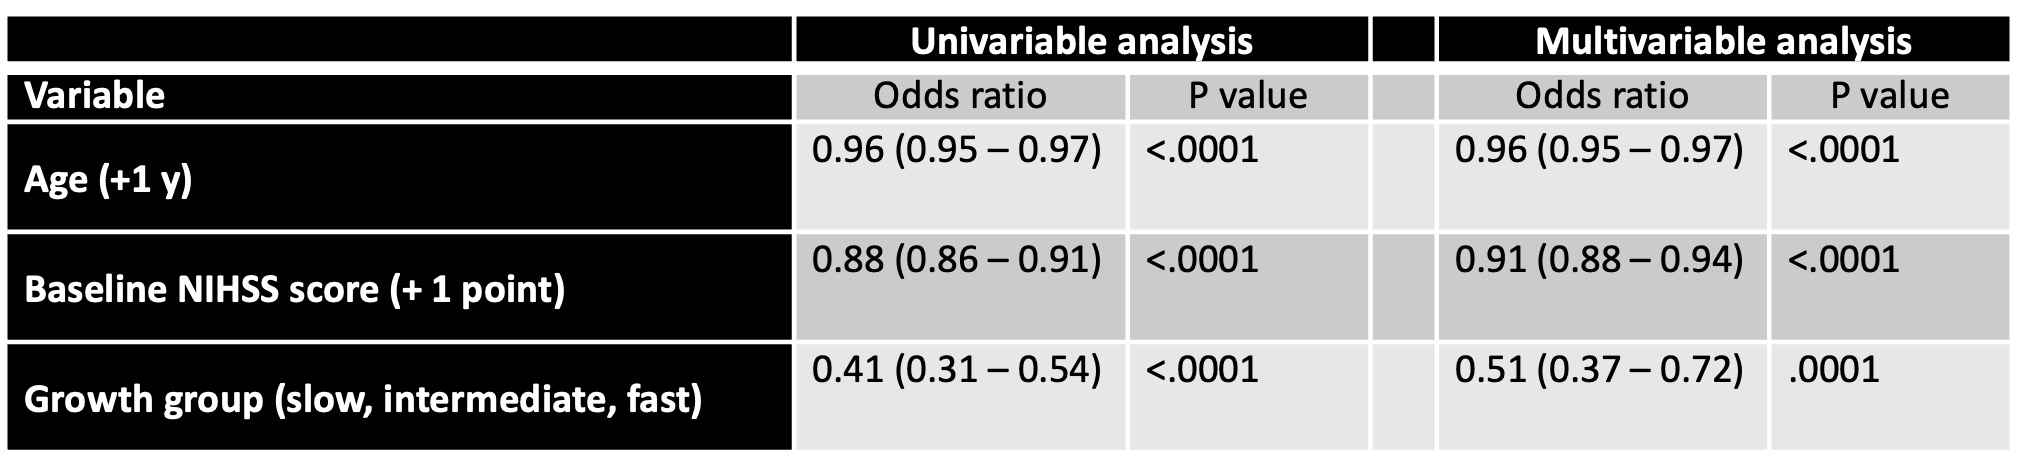
In the training dataset, infarct growth rate followed a non-normal left-skewed distribution (Figure 1-A), which then followed a more centered distribution after natural log-transformation. We were, then, able to identify a mixture of three Gaussians within the overall sample (Figure 1-B) that provided the likelihood for each patient to belong to a given group (Figure 1-C). The three groups represented respectively 11% (slow), 62% (intermediate), and 27% (fast) of the total sample (Table 1). These growth groups were significantly different for many clinical and radiological characteristics (Table 1). Each group can be considered as a homogeneous cluster of patients explored at different time points after the onset of symptoms, allowing us to obtain a pseudo-longitudinal evolutions of core volumes (Figure 2). The 3D maps representing the spatial evolution over time showed no stereotypical infarct pattern for the slow progressors (Figure 3-A) while they showed stereotypical patterns for the intermediate and fast progressors (Figure 3-B and Figure 3-C) whose global time courses were significantly different (time x group interaction; p<0.001; MANCOVA). Furthermore, within the training dataset, we found that the growth group was a significant and independent predictor of favorable functional outcome at 3 months, together with age and initial NIHSS severity (Table 2) with an AUC of 0.75 [95%CI: 0.71, 0.79]. Using the stereotypical time course evolutions defined in Figure-2, we classified the patients of the validation dataset as follows: 34% were slow progressors, 51% were intermediate, and 15% were fast progressors. Using these groups and the previously defined predictive model, we predicted mRS at 3 months with an AUC of 0.78 [95%CI: 0.66, 0.88].Conclusion
We provided growth charts for stroke progression in time and space that could offer a new and easy solution to identify the phenotype of stroke patients and estimate their anticipated outcome without requiring advanced post-processing. In the future, this may help for stroke patient triage and inter-institutional transfer.Acknowledgements
This study received financial support from the French government in the framework of the University of Bordeaux's France 2030 program / RRI "IMPACT".
The MRI data was collected from the "French acute multimodal imaging to select patients for mechanical thrombectomy" (FRAME; NCT03045146) and the "Endovascular treatment in Ischemic stroke" (ETIS; NCT03776877) studies.
References
1. Desai SM, Rocha M, Jovin TG, Jadhav AP. High Variability in Neuronal Loss. Stroke. 2019;50(1):34-37. doi:10.1161/STROKEAHA.118.023499
2. Vagal A, Aviv R, Sucharew H, et al. Collateral Clock Is More Important Than Time Clock for Tissue Fate. Stroke. 2018;49(9):2102-2107. doi:10.1161/STROKEAHA.118.021484
3. Rocha M, Jovin TG. Fast Versus Slow Progressors of Infarct Growth in Large Vessel Occlusion Stroke. Stroke. 2017;48(9):2621-2627. doi:10.1161/STROKEAHA.117.017673
4. Rocha M, Desai SM, Jadhav AP, Jovin TG. Prevalence and Temporal Distribution of Fast and Slow Progressors of Infarct Growth in Large Vessel Occlusion Stroke. Stroke. 2019;50(8):2238-2240. doi:10.1161/STROKEAHA.118.024035
5. Ospel JM, Hill MD, Kappelhof M, et al. Which Acute Ischemic Stroke Patients Are Fast Progressors? Stroke. 2021;52(5):1847-1850. doi:10.1161/STROKEAHA.120.032950
6. Sarraj A, Hassan AE, Grotta J, et al. Early Infarct Growth Rate Correlation With Endovascular Thrombectomy Clinical Outcomes. Stroke. 2021;52(1):57-69. doi:10.1161/STROKEAHA.120.030912
7. Seo WK, Liebeskind DS, Yoo B, et al. Predictors and Functional Outcomes of Fast, Intermediate, and Slow Progression Among Patients With Acute Ischemic Stroke. Stroke. 2020;51(8):2553-2557. doi:10.1161/STROKEAHA.120.030010
8. Mohammaden MH, Haussen DC, Pisani L, et al. Characterizing Fast and Slow Progressors in Anterior Circulation Large Vessel Occlusion Strokes. Interv Neuroradiol. 2023;29(4):379-385. doi:10.1177/15910199221083100
9. Rocha M, Desai S, Son J, Tonetti DA, Jovin T, Jadhav AP. Clinical characteristics of fast and slow progressors of infarct growth in anterior circulation large vessel occlusion stroke. J Cereb Blood Flow Metab. 2021;41(7):1517-1522. doi:10.1177/0271678X211015068
10. Figueiredo MAT, Jain AK. Unsupervised learning of finite mixture models. IEEE Trans Pattern Anal Mach Intell. 2002;24(3):381-396. doi:10.1109/34.990138
11. Cleveland WS, Devlin SJ. Locally Weighted Regression: An Approach to Regression Analysis by Local Fitting.
Figures