0069
Reduced coupling between cerebrospinal fluid flow and global brain activity in post-stroke dementia with subcortical lesion1Department of Biomedical Engineering, Zhejiang University, Hangzhou, China, 2Department of Neurology, Neuroscience Center, Sir Run Run Shaw Hospital, Zhejiang University, Hangzhou, China, 3Department of Radiology, Neuroscience Center, Sir Run Run Shaw Hospital, Zhejiang University, Hangzhou, China
Synopsis
Keywords: Stroke, Dementia, Neurovascular,glymphatic system
Motivation: Post-stroke dementia (PSD) affects up to one third of stroke survivors but the underlying mechanism remains unclear.
Goal(s): We hypothesized that dysfunction in glymphatic system may play a role in the pathogenesis in PSD and aim to investigate it with non-contrast imaging method.
Approach: Coupling between BOLD and cerebrospinal fluid (CSF) signal was compared between PSD, post-stroke non-dementia (PSND) and normal controls.
Results: Significant reduction in the BOLD-CSF coupling was found in PSD patients, which is negatively associated with cognitive test scores.
Impact: The present work revealed a reduced BOLD-CSF coupling in PSD patients, indicating a potential abnormality in the glymphatic function.
Introduction
Post-stroke dementia (PSD), characterized by the presence of multidomain cognitive impairments, arises in approximately 30% of stroke survivors within six months1. It was suggested that stroke patients with more amyloid deposition experience more rapid cognitive decline2. Glymphatic system is a recently discovered brain clearance system and we hypothesize that insufficient glymphatic clearance of stroke-induced amyloid deposition may play a role in the pathogenesis of PSD. Thus, we utilized the coupling between BOLD signal and CSF signal (BOLD-CSF coupling) as an indicator of glymphatic movement and examined its relationship with cognitive impairment in post-stroke patients.Methods
Data Acquisition: Our dataset included 18 PSD and 19 post-stroke non-dementia (PSND) patients with subcortical lesions, and 14 well-matched normal controls (NC) recruited at Sir Run Run Shaw Hospital, Zhejiang University School of Medicine. Written informed consent was obtained from all participants or their legal guardians. The PSD group and PSND group were divided by the standardized cognitive evaluation performed by two professional neurologists. The cognitive performances of all participants were evaluated using Mini-Mental State Examination3 (MMSE1, MMSE2) and MiniCog4 (MiniCog1, MiniCog2) assessments before the MRI scan.MRI scans were performed for each patient around the third month after stroke. All data were acquired on a Siemens 3T scanner. Resting-state fMRI data were acquired using a fast gradient-echo echoplanar imaging sequence, with TR/ TE = 2000/30 msec, flip angle (FA) = 90°, pixel size = 3.7 × 3.7 mm2, matrix = 70 × 70, field of view (FOV) = 260 × 260 mm2, and 35 slices with a slice-thickness of 4.0 mm, 120 volumes. 3D T1-weighted MPRAGE images were acquired with TR/TE = 2200/2.48 msec, inversion time = 900 msec, matrix = 256 × 256 × 176, voxel size = 0.9 × 0.9 × 1mm3, and FA = 8°.
Data Processing: The first five rsfMRI volumes were discarded to avoid the unsteady state of magnetization and the potential edge effect of temporal filtering. Slice-timing correction was performed using SPM12 in each dataset, followed by high-pass filtering (0.01–0.1 Hz) and linear and quadratic detrending. Note that motion correction was only done when extracting global BOLD signal but not CSF signal, as accurate motion correction cannot be achieved for edge slices5.
CSF ROI mask was drawn manually at the bottom slice (Figure 1A), which locates between the upper spinal cord/medulla oblongata and lower cerebellum, as it is expected to have maximal sensitivity to inflow effects5,6. Signals were z-normalized and averaged within the ROI to obtain CSF signal time course. To obtain global BOLD signal, the rsfMRI images were further smoothed with a Gaussian kernel of 4mm FWHM. Grey matter mask was generated based on T1w image and then registered to BOLD space. The global BOLD signal time course was then calculated as the averaged z-score signal within the mask at each frame. (Figure 1B)
To quantify the BOLD-CSF coupling, the cross-correlation was calculated between the BOLD and CSF signals at various time lags (from -20 to 20s). The negative peak closest to 0 in the cross-correlation curve was identified and this amplitude was used to quantify the strength of BOLD-CSF coupling7,8 (Figure 1C). The lag corresponding to this anti-correlation peak was retrieved as well.
Results
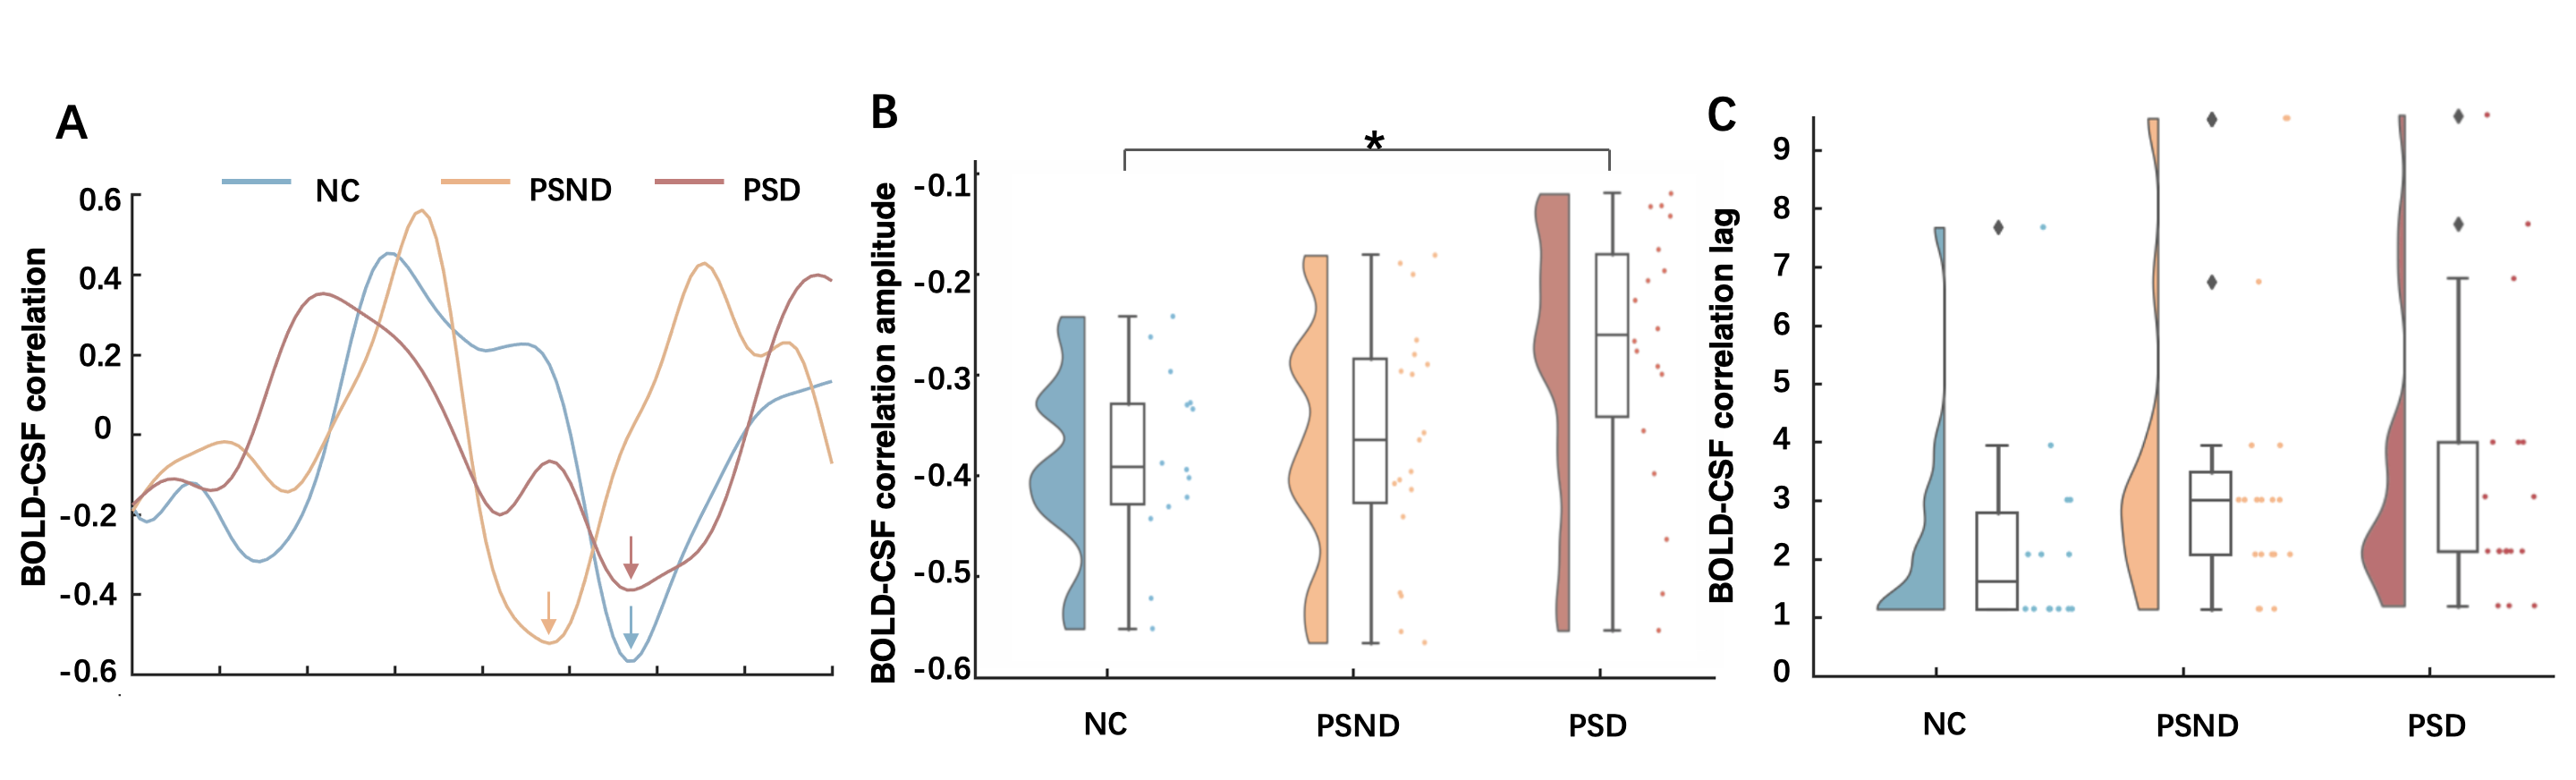
Demographic information of PSD, PSND and NC participants are presented in Figure 2. PSD patients showed significantly worse cognition compared with other two groups.One-way ANOVA showed that there was a significant difference in the BOLD-CSF coupling among groups (p=0.029). Post-hoc analysis suggested that PSD subjects had significantly lower BOLD-CSF coupling than controls (Figure 3B, p=0.044), but no there were no difference between PSND and control participants (p=0.918), or between PSD and PSND patients (p=0.072). No significant of time lags was found among groups (Figure 3C, All group: p=0.273. PSD-NC: p=0.253. PSD-PSND: p=0.873. PSND-NC: p=0.483).
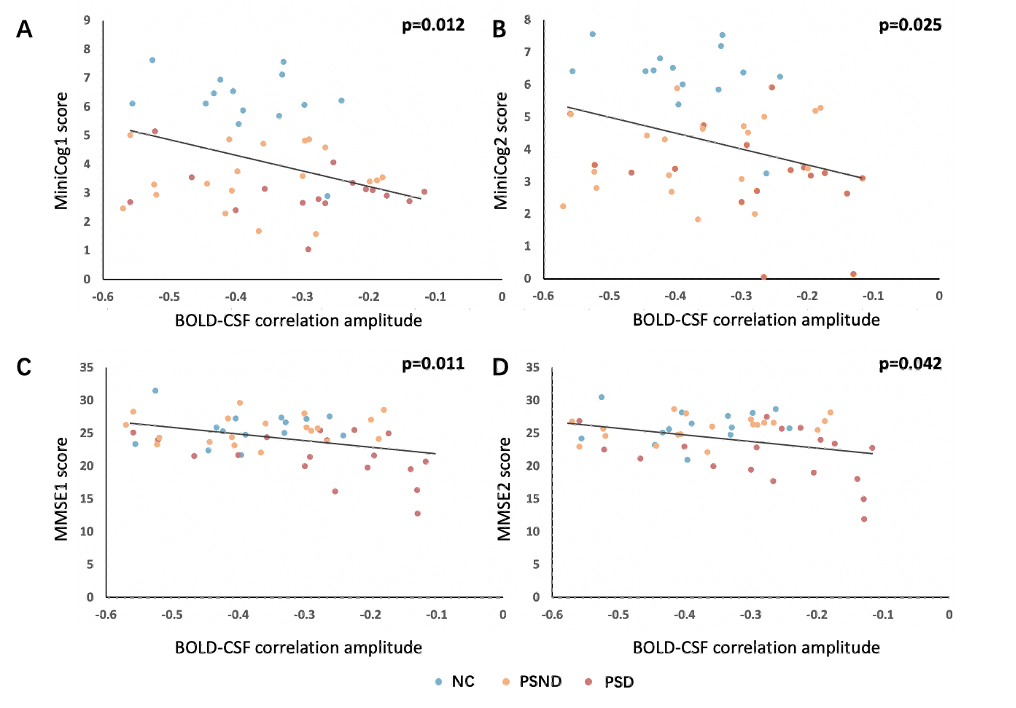
After correcting for age, sex and education, multivariate linear regression showed that the BOLD-CSF coupling presented significant negative correlation with MMSE1 (p=0.011), MMSE2 (p=0.042), MiniCog1 (p=0.012) and MiniCog2 (p=0.025). That is, patients with weaker (less negative) BOLD-CSF coupling performed worse in cognitive tests (Figure 4).
Discussion and Conclusion
This study, for the first time, investigated the glymphatic function in PSD and revealed PSD-specific reduction in BOLD-CSF coupling, suggesting a reduced glymphatic function may contribute to cognitive impairments in post-stroke patients. Insufficient glymphatic clearance may lead to accumulation and spread of neurotoxic proteins induced by post-stroke inflammation, thus contribute to the cognitive impairment. Moreover, the BOLD-CSF coupling was found to be negatively associated with multiple cognitive test scores, thus may serve as a potential imaging biomarker for clinical intervention in post-stroke patients.Acknowledgements
No acknowledgement found.References
1. Mijajlović, M. D., Pavlović, A., Brainin, M., Heiss, W. D., Quinn, T. J., Ihle-Hansen, H. B., ... & Bornstein, N. M. (2017). Post-stroke dementia–a comprehensive review. BMC medicine, 15(1), 1-12.
2. Rost, N. S., Brodtmann, A., Pase, M. P., van Veluw, S. J., Biffi, A., Duering, M., ... & Dichgans, M. (2022). Post-stroke cognitive impairment and dementia. Circulation Research, 130(8), 1252-1271.
3. Folstein MF, Folstein SE, McHugh PR. “Mini-mental state”. A practical method for grading the cognitive state of patients for the clinician. J Psychiatr Res. 1975;12(3):189–98.
4. Borson, S., Scanlan, J. M., Chen, P., & Ganguli, M. (2003). The Mini‐Cog as a screen for dementia: validation in a population‐based sample. Journal of the American Geriatrics Society, 51(10), 1451-1454.
5. Fultz, N. E., Bonmassar, G., Setsompop, K., Stickgold, R. A., Rosen, B. R., Polimeni, J. R., & Lewis, L. D. (2019). Coupled electrophysiological, hemodynamic, and cerebrospinal fluid oscillations in human sleep. Science, 366(6465), 628-631.
6. Gao, J. H., & Liu, H. L. (2012). Inflow effects on functional MRI. Neuroimage, 62(2), 1035-1039.
7. Han, F., Chen, J., Belkin-Rosen, A., Gu, Y., Luo, L., Buxton, O. M., ... & Alzheimer’s Disease Neuroimaging Initiative. (2021). Reduced coupling between cerebrospinal fluid flow and global brain activity is linked to Alzheimer disease–related pathology. PLoS biology, 19(6), e3001233.
8. Han, F., Brown, G. L., Zhu, Y., Belkin‐Rosen, A. E., Lewis, M. M., Du, G., ... & Liu, X. (2021). Decoupling of global brain activity and cerebrospinal fluid flow in Parkinson's disease cognitive decline. Movement Disorders, 36(9), 2066-2076.
Figures
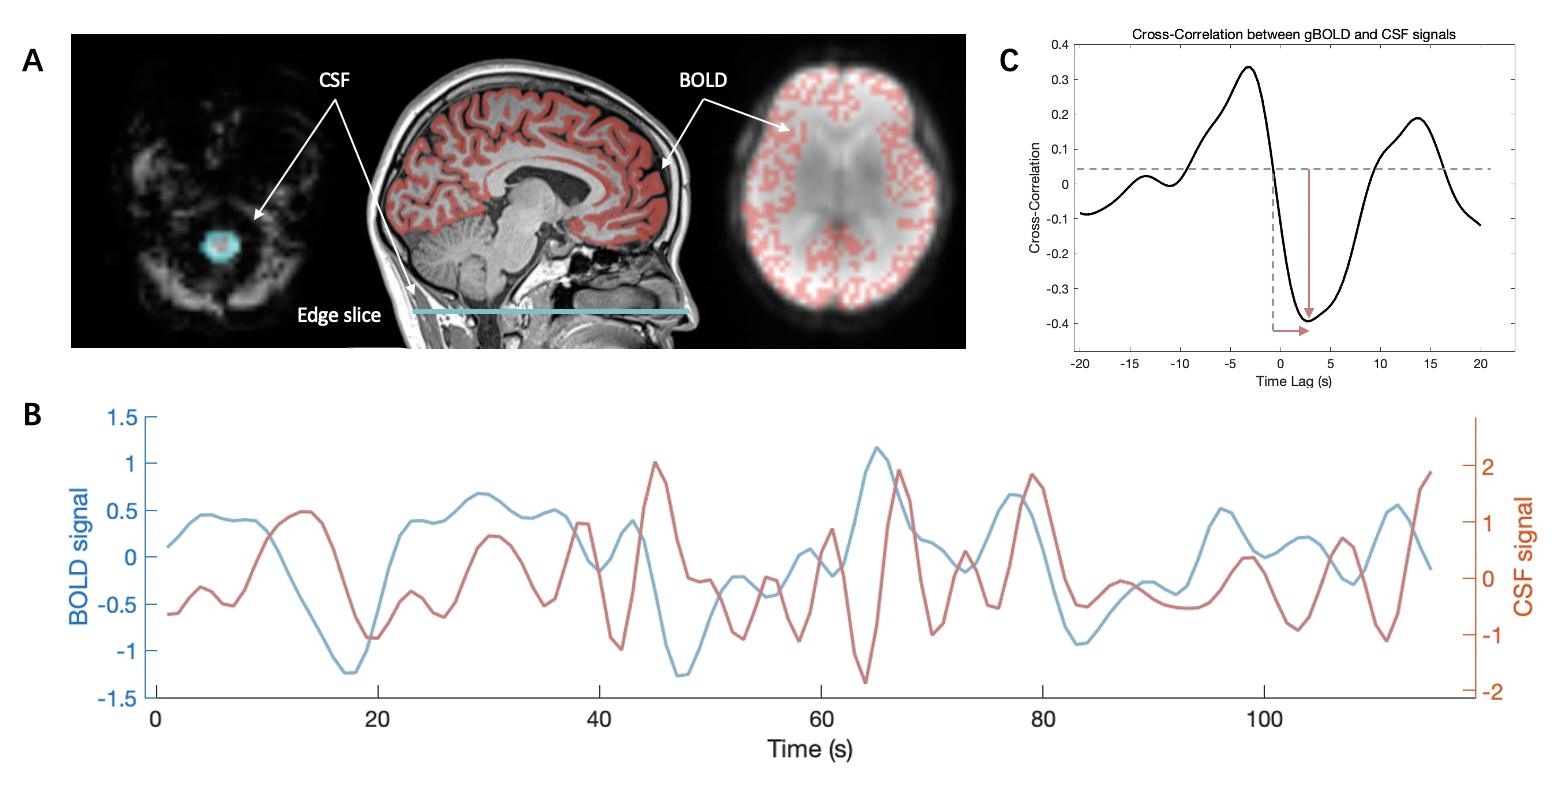
Figure 1. Analysis procedure of BOLD-CSF coupling. (A) The global BOLD signal is extracted from the cortical gray matter region of cerebrum. The CSF signals are extracted from the edge slice of fMRI acquisition. (B) A strong coupling between the global cortical BOLD signals and CSF signals in a representative healthy control. Both the BOLD and CSF signals were Z-normalized. (C) The cross-correlation analysis between the global BOLD signal and the CSF signal. The negative peak closest to 0 was identified as the strength of BOLD-CSF coupling.
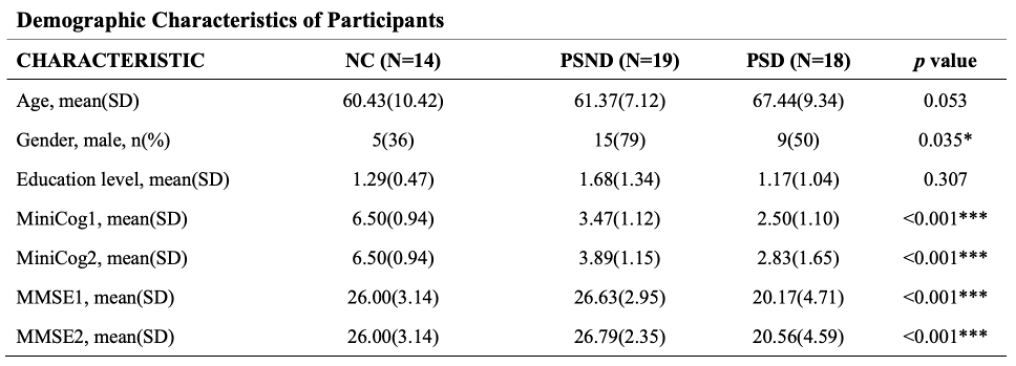
Figure 2. Demographic information of PSD, PSND and NC participants.