0067
Combining Cortical Neurometabolic Changes and Structural Disconnection Improves Stroke Severity Prediction: A High-Resolution 1H-MRSI Study1School of Biomedical Engineering, Shanghai Jiao Tong University, Shanghai, China, 2Radiology Department, Renji Hospital, Shanghai Jiao Tong University of Medicine, Shanghai, China, 3Department of Radiology, The First Affiliated Hospital of South China of University, South China of University, Hengyang, China, 4Beckman Institute for Advanced Science and Technology, University of Illinois at Urbana-Champaign, Urbana, IL, United States, 5Department of Electrical and Computer Engineering, University of Illinois at Urbana-Champaign, Urbana, IL, United States, 6Siemens Medical Solutions USA, Inc, Urbana, IL, United States, 7The National Center for Supercomputing Applications, University of Illinois at Urbana-Champaign, Urbana, IL, United States, 8Department of Biomedical Engineering, Case Western Reserve University, Cleveland, OH, United States
Synopsis
Keywords: Stroke, Stroke
Motivation: Understanding distant metabolic changes resulting from stroke injuries can offer valuable prognostic biomarkers for patient recovery but remains underexplored.
Goal(s): Our goal was to investigate the relationship between lesional and cortical neurometabolic changes, structural disconnections, and their collective impact on stroke severity using high-resolution 3D 1H-MRSI.
Approach: 3D 1H-MRSI scanning using SPICE technology (scan time: 8 minutes, resolution: 2×3×3 mm3, FOV: 240×240×72 mm3) was performed on 105 acute ischemic stroke patients.
Results: Cortical neurometabolic changes were associated with lesional metabolic levels and structural disconnections, which can be used jointly to improve symptom severity prediction in stroke patients.
Impact: The demonstrated predictive value of combining structural disconnections with distant cortical metabolic disruptions may offer prognostic biomarkers useful for treatment and management of stroke patients.
Introduction
Stroke-related behavioral deficits result from both injury site damage and widespread network dysfunction due to structural, functional, and metabolic disconnections 1,2. Understanding these imaging findings can offer valuable prognostic biomarkers for treatment and management of stroke patients. While previous studies have explored whole-brain structural and functional disconnections post-stroke using functional and diffusion MRI, the associated metabolic changes and their relation to clinical impairment remain less understood. MR spectroscopic imaging (MRSI) allows for noninvasive mapping of various neurometabolites, shedding light on the neurobiological consequences of stroke injury. However, current MRSI techniques suffer from long scanning times, limited spatial resolution, and partial brain coverage, constraining our ability to detect metabolic changes in stroke patients. In this study, we applied a fast high-resolution 3D 1H-MRSI technique, called SPICE (SPectroscopic Imaging by exploiting spatiospectral CorrElation), on 105 ischemic stroke patients within one-week post-injury. We investigated the relationship between lesional and cortical neurometabolic changes, structural disconnections, and their collective impact on stroke severity in clinical settings.Methods
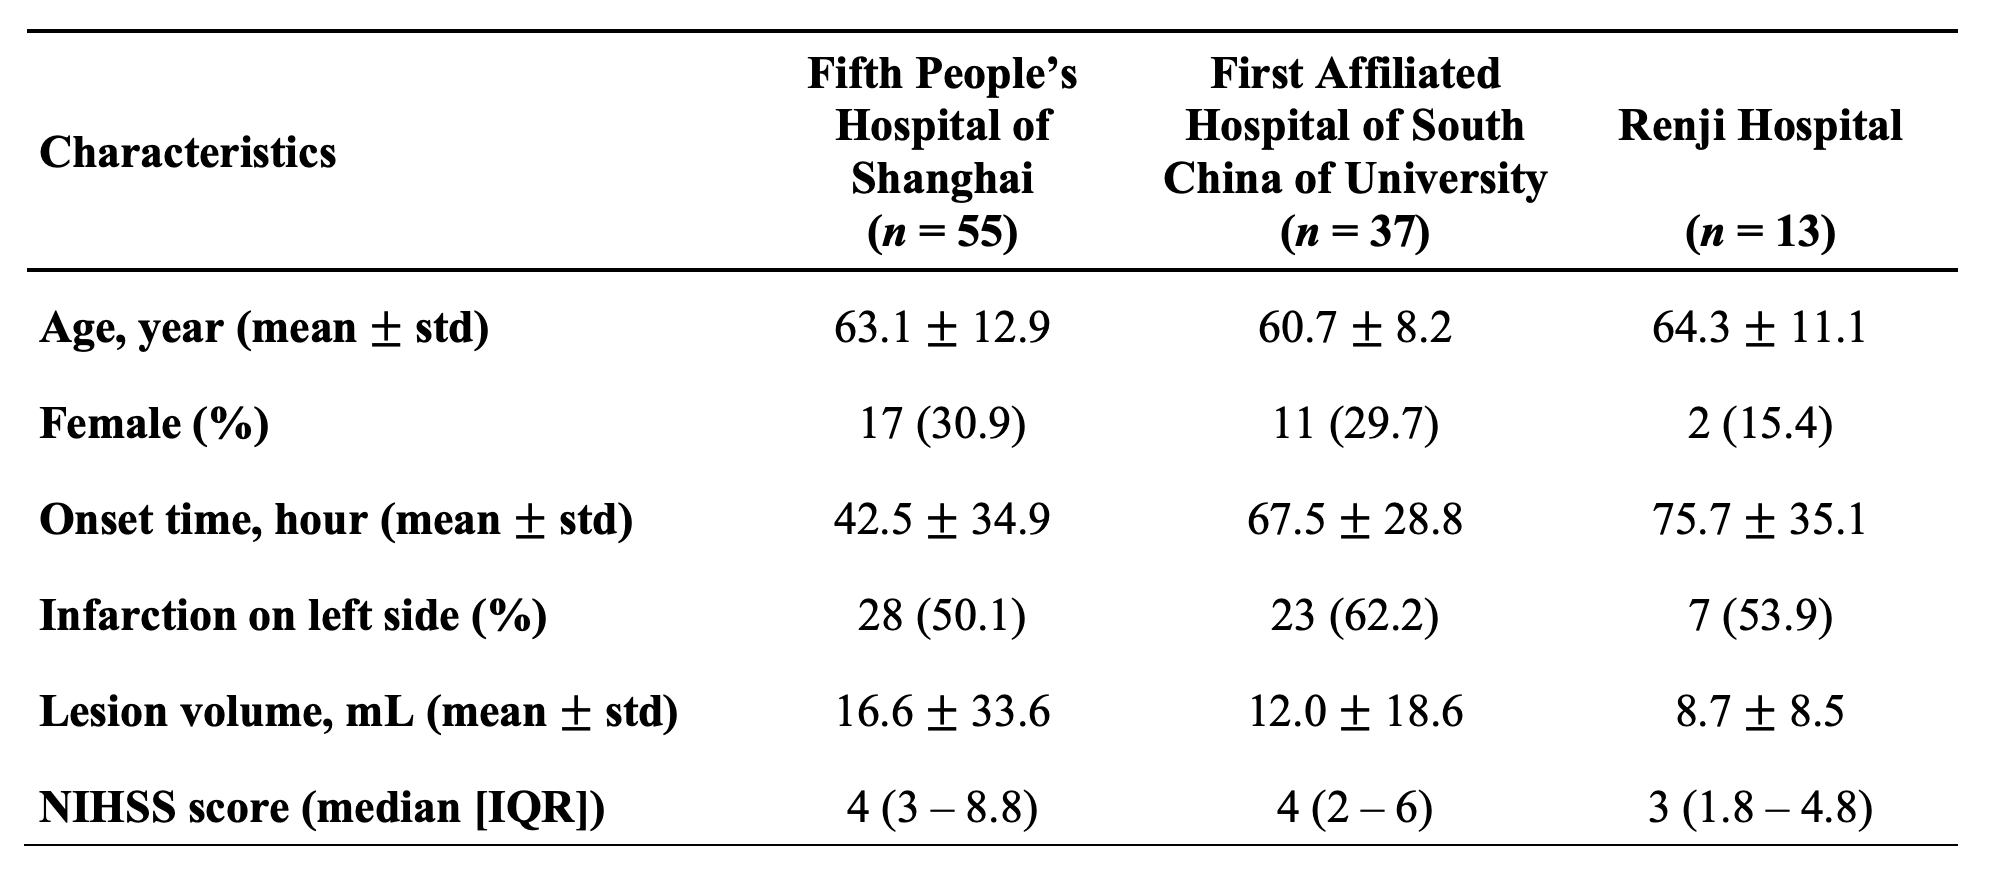
One hundred and five ischemic stroke patients from three clinical centers, including the Fifth People’s Hospital of Shanghai (n = 55), Renji Hospital (n = 13), and the First Affiliated Hospital of South China of University (n = 37), were involved in this study. Exclusion criteria included hemorrhage or non-stroke lesions on structural MRI, and contraindication for MRI. All patients underwent MRI scans within one-week post symptom onset. The NIHSS score was used to assess stroke severity at admission. This study was approved by the IRB of local hospitals with written informed consents provided. Detailed demographics are summarized in Table 1.All patients underwent MRI using 3T Siemens Prisma or Skyra scanners (Siemens Healthcare, Erlangen, Germany). The image acquisition protocol included 3D MRSI scan using the SPICE sequence (TR/TE = 160/1.6 ms, resolution = 2.0×3.0×3.0mm3, FOV = 240×240×72mm3, scan time = 8min), 3D MPRAGE (TR/TE/TI = 2400/2.13/1100ms, resolution = 1.0×1.0×1.0mm3, FOV = 256mm), DWI (TR/TE = 4300/[74,125]ms, resolution = 1.3×1.3×4.0mm3, FOV = 240 mm, b = 0 and 1000 s/mm2), and FLAIR imaging (TR/TE/TI = 9000/89/2500ms, resolution = 0.5×0.5×2.0mm3, FOV = 240mm). The neurometabolite signals were reconstructed from the MRSI data using a union-of-subspaces model, incorporating pre-learned spectral basis functions 3–5. For spectral quantification, an improved LCModel-based method was used, incorporating both spatial and spectral priors 5.
For each patient, the lesion mask was manually delineated based on DWI and FLAIR maps by an experienced neuroradiologist (T.W.). All images were first co-registered to MPRAGE images using an affine linear transformation in ANTs 6. The neurometabolites maps, including NAA, choline, and creatine maps as well as lesion masks were nonlinearly registered to standard MNI152 space. The structural disconnection maps induced by each lesion were generated using Lesion Quantification Toolkit 7. Seven brain functional networks were included in our analysis 8. Correlations between neurometabolic levels and structural disconnections were assessed by Pearson's correlation analysis. Bayesian linear regression analysis employing incrementally increasing numbers of inputs was used to compare the predictive models for patient NIHSS score 9. All statistical analyses were performed using MATLAB.
Results
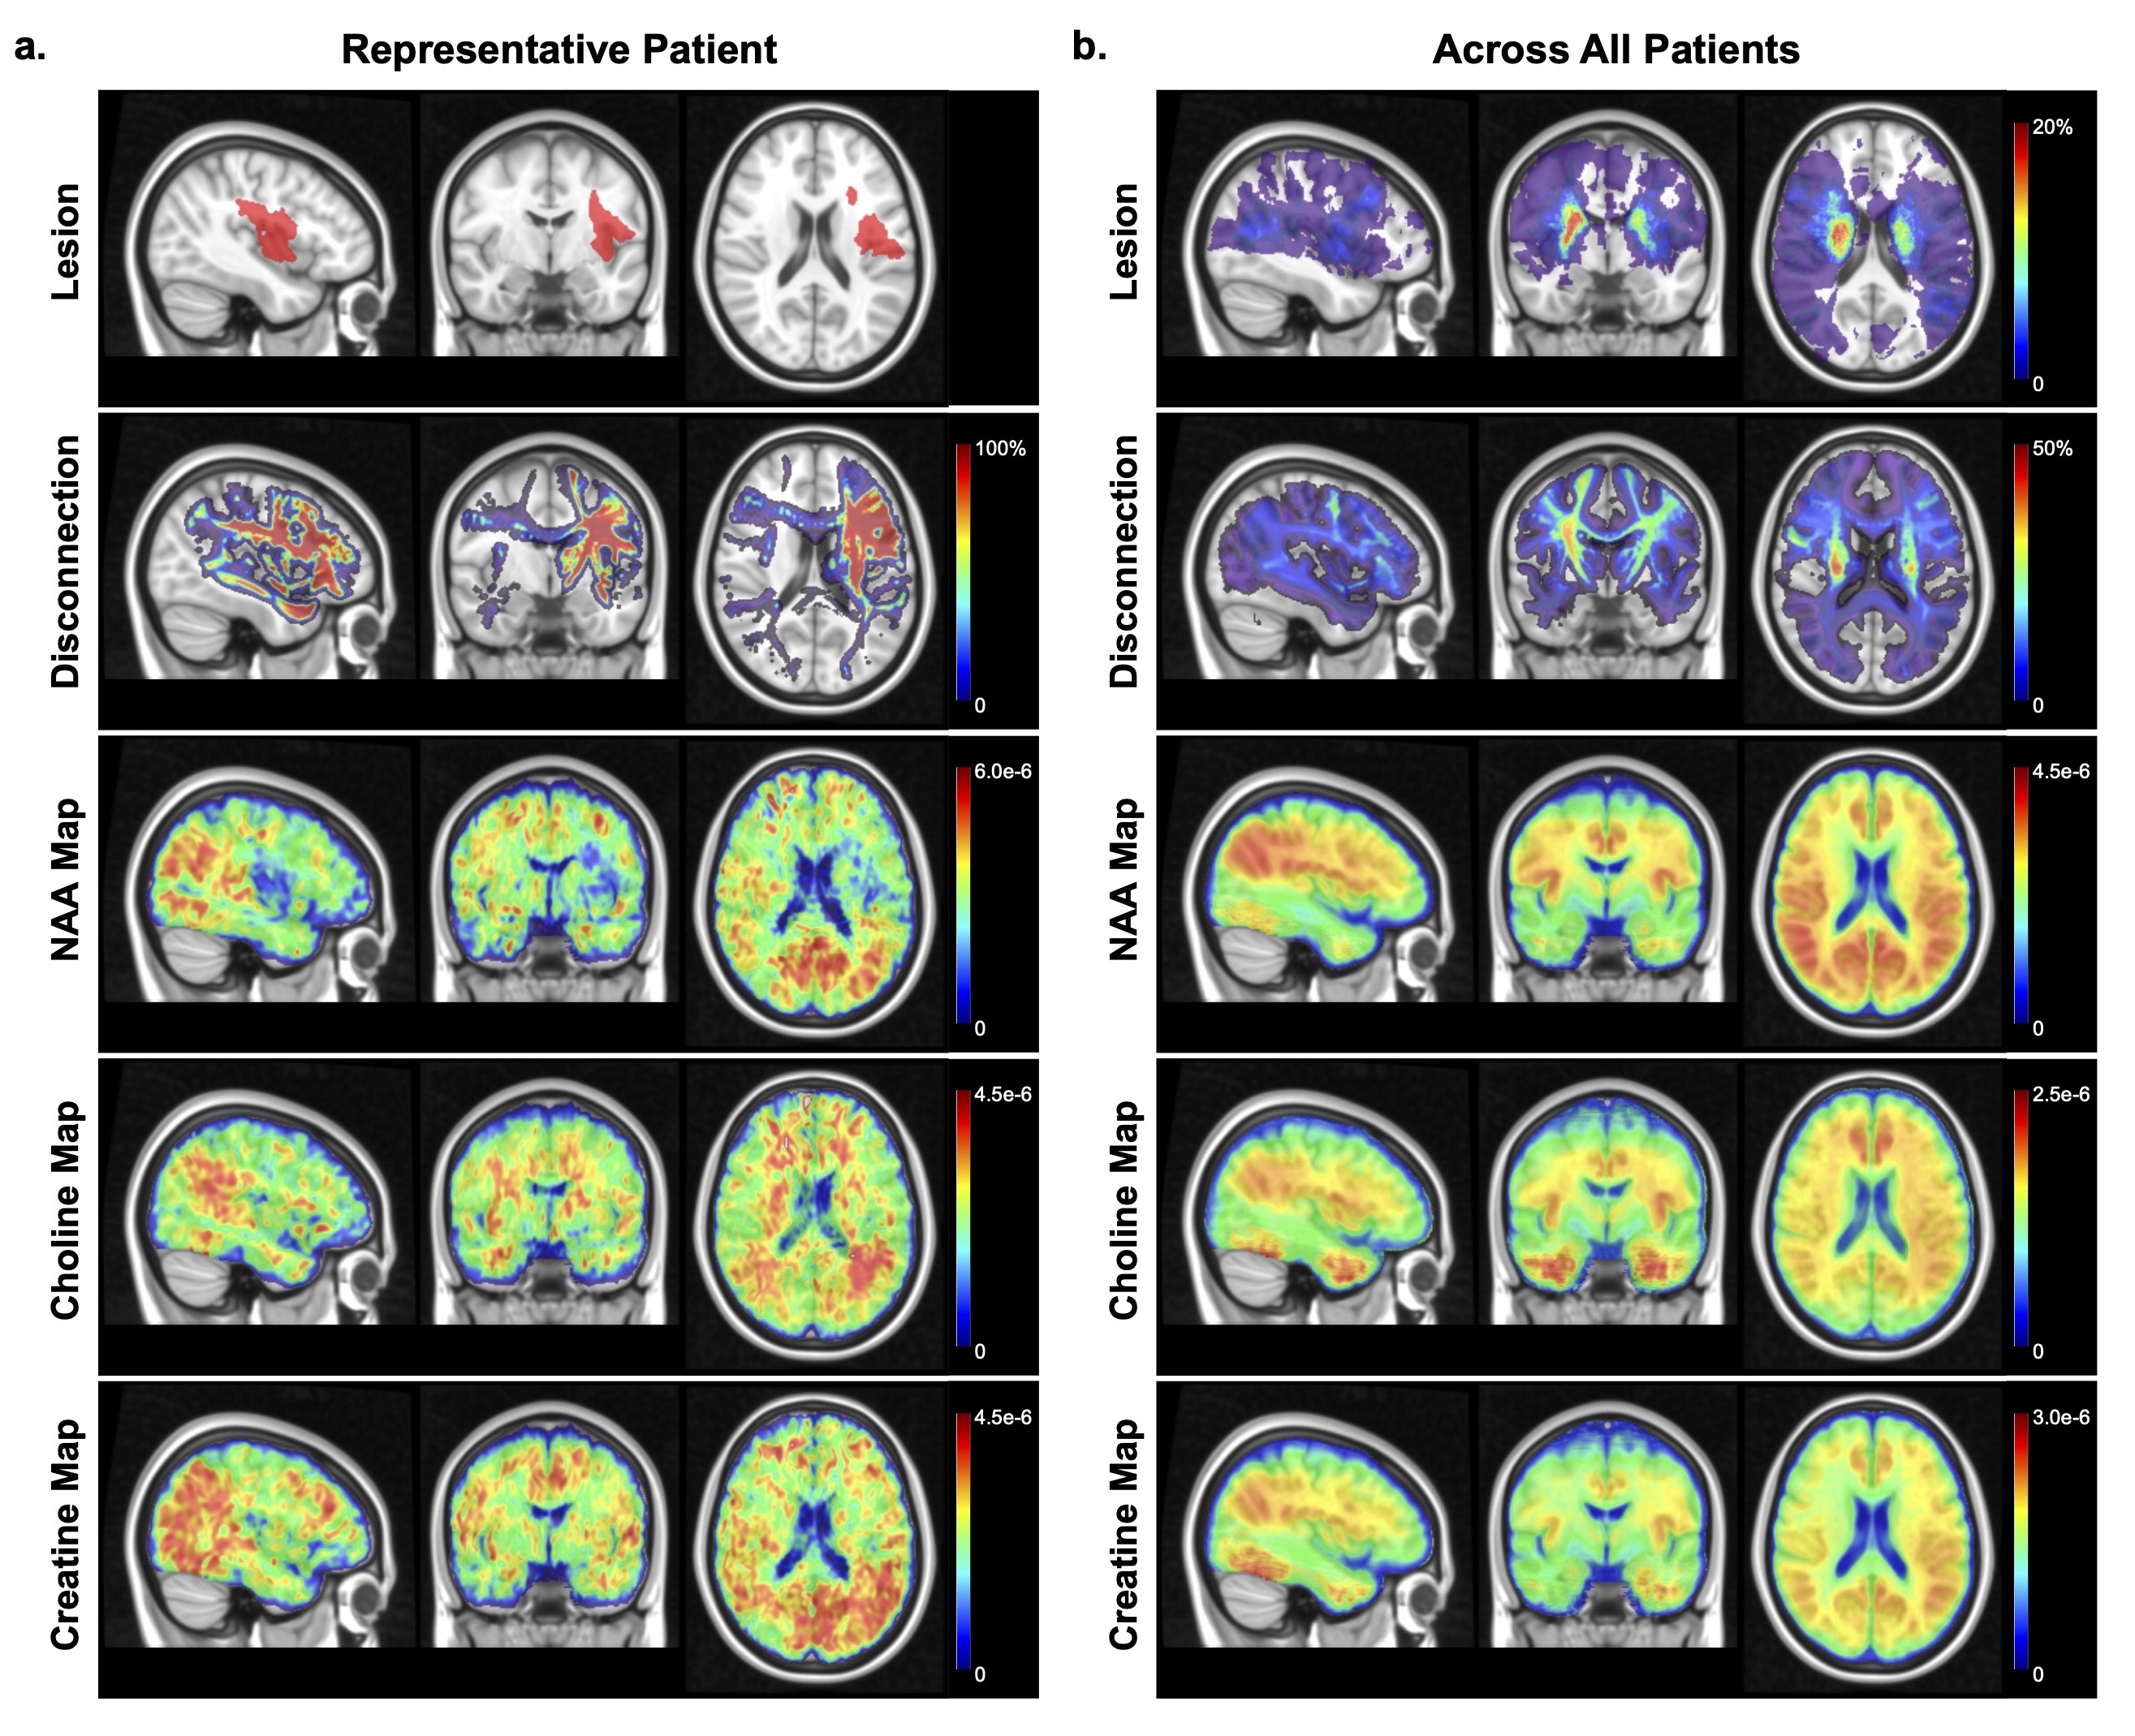
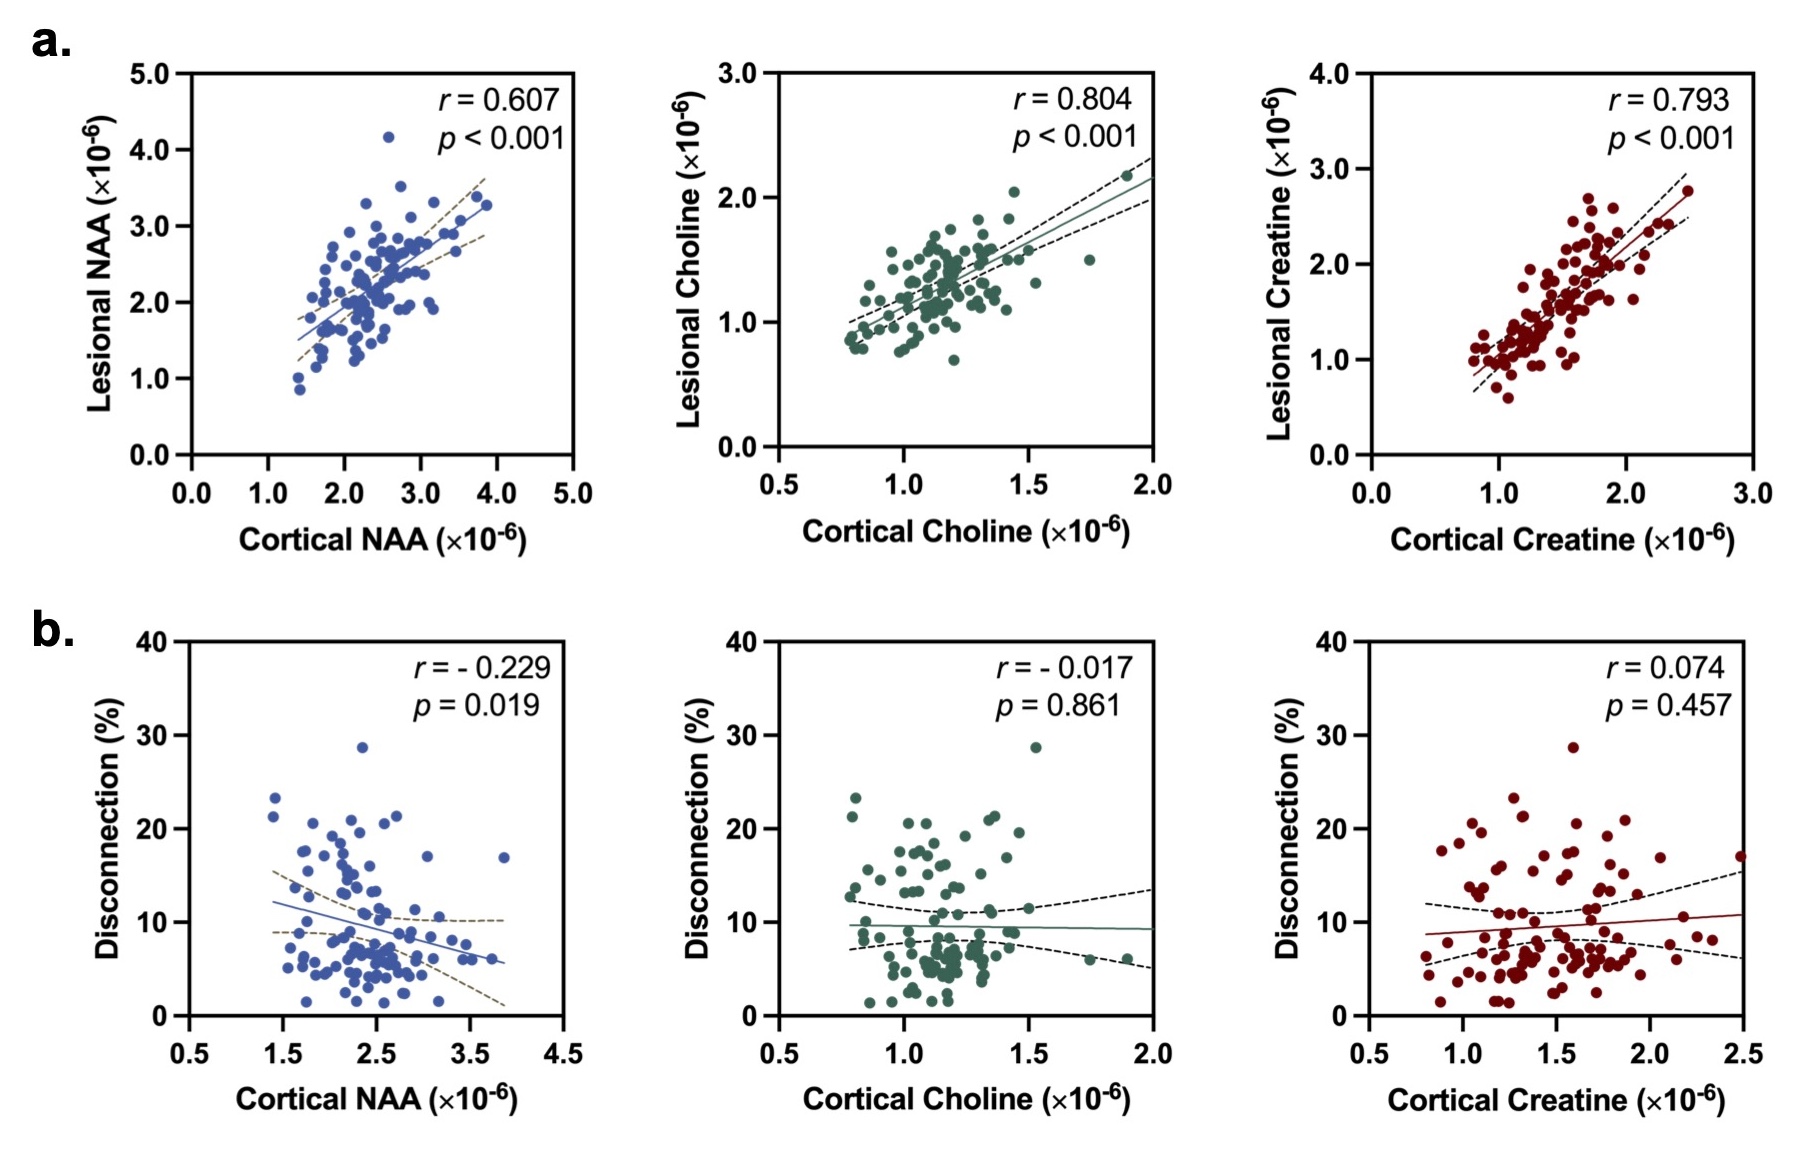
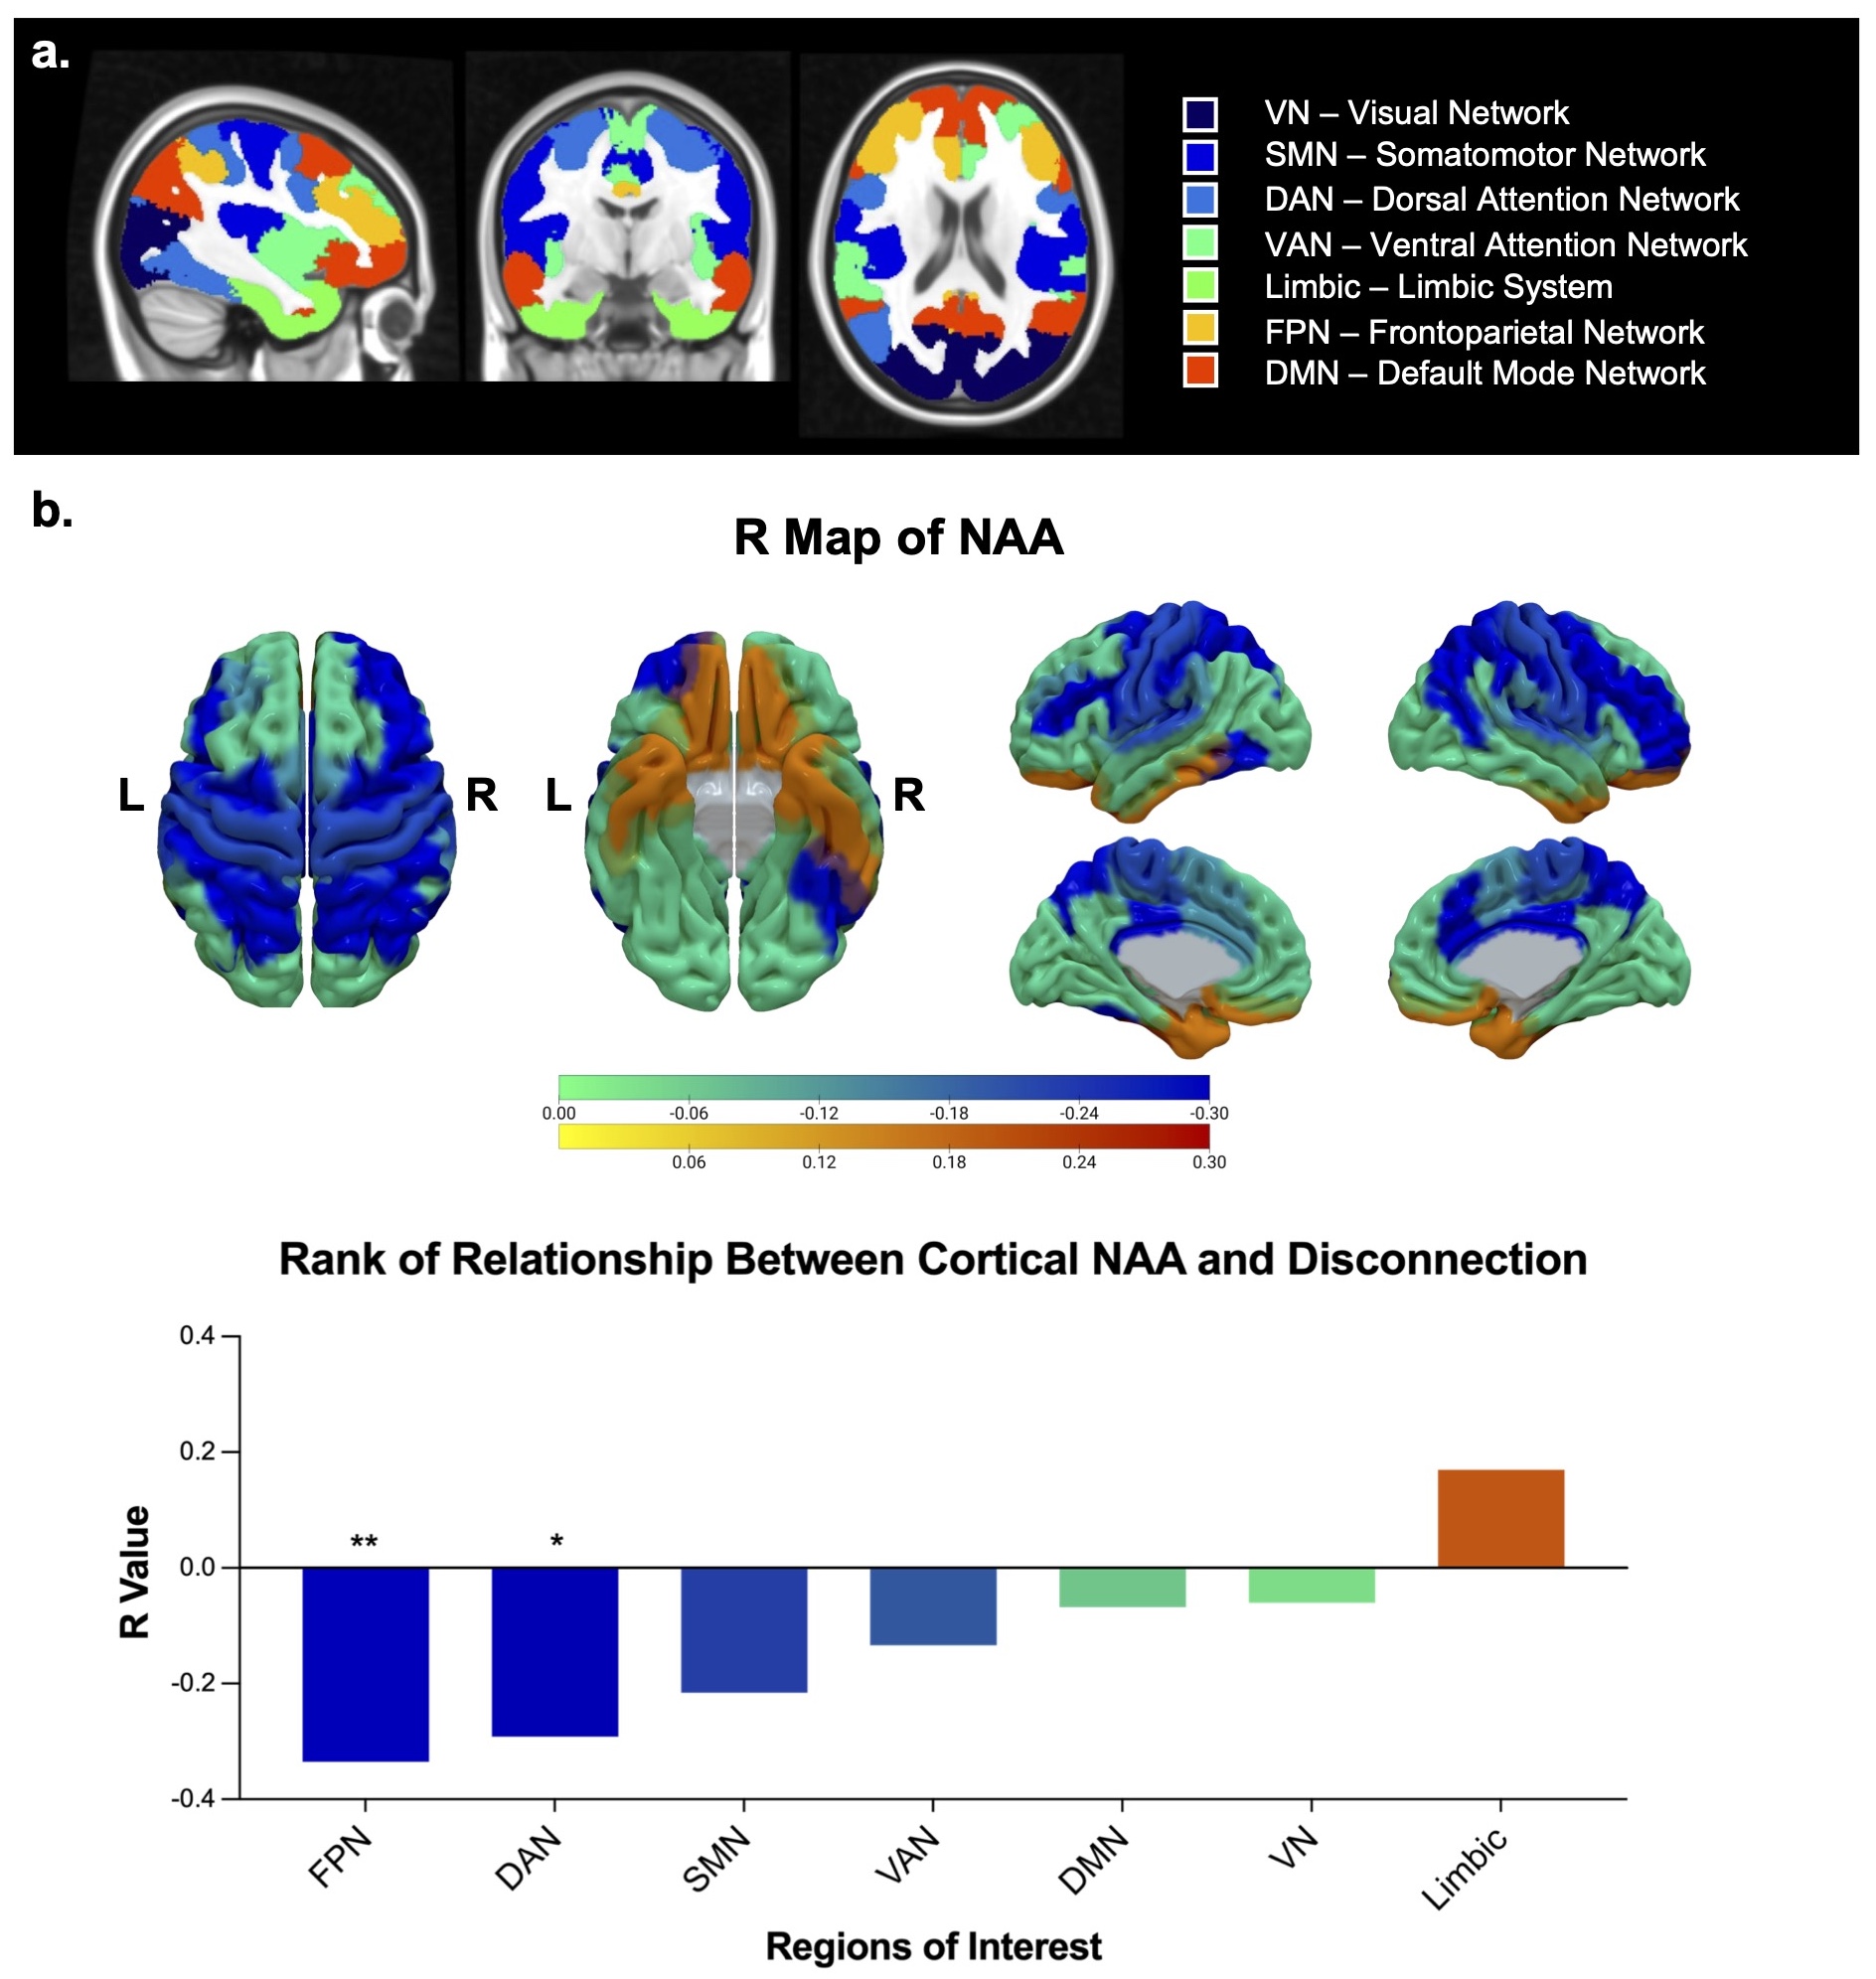
Representative high-resolution 3D maps of neurometabolites (NAA, choline, and creatine), along with the lesion and structural disconnection maps are shown in Fig.1, obtained from an acute stroke patient and across the entire group, respectively. The spatial distribution patterns for lesion occurrence and neurometabolic alterations could be visualized.Figure 2(a) illustrates the lesional neurometabolic levels with respect to cortical neurometabolic changes across all patients. All neurometabolites showed significant correlations (NAA: r = 0.607, p < 0.001; choline: r = 0.804, p < 0.001; creatine: r = 0.793, p < 0.001). As shown in Figure 2(b), the cortical NAA levels were correlated with structural disconnections (r = − 0.229, p = 0.019), but not for choline and creatine. We further examined the relationship of cortical NAA with structural disconnection in each functional network. As shown in Fig.3, the correlation coefficients showed distinct patterns, with significant associations shown in dorsal attention network (r = − 0.291, p = 0.009) and frontoparietal network (r = − 0.335, p = 0.010).
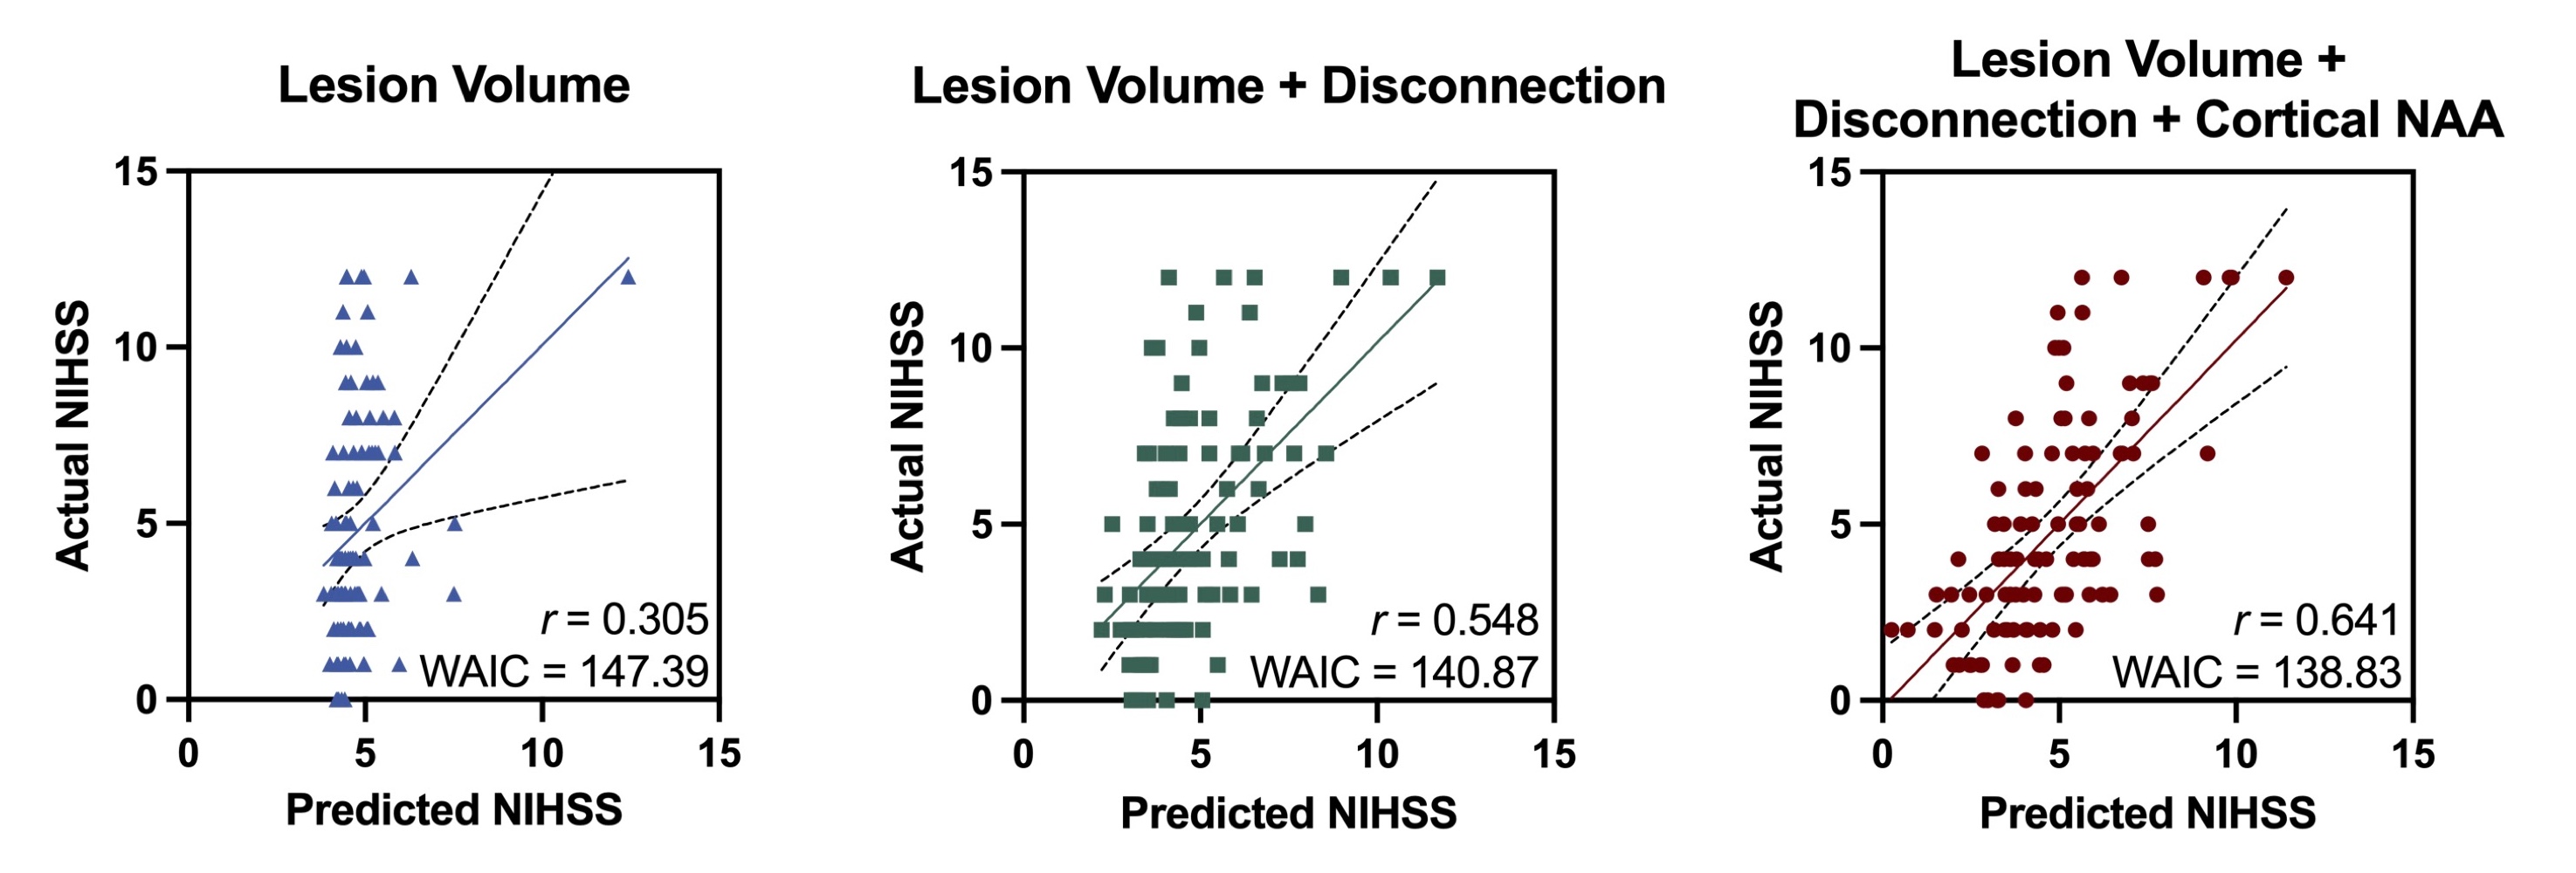
As displayed in Figure 4, the prediction performance for patient NIHSS score was better by integrating lesion volume, structural disconnection and cortical NAA level (r = 0.641, WAIC = 138.83) than using lesion volume alone (r = 0.305, WAIC = 147.39) or lesion volume and structural disconnection (r = 0.548, WAIC = 140.87).
Conclusion
With high-resolution 3D-MRSI, we linked cortical neurometabolites to lesional metabolic levels and structural disconnections in acute stroke patients, which collectively improved symptom severity prediction.Acknowledgements
This work was supported by Shanghai Pilot Program for Basic Research—Shanghai Jiao Tong University (21TQ1400203), the Program for Professor of Special Appointment (Eastern Scholar) at Shanghai Institutions of Higher Learning; Key Program of Multidisciplinary Cross Research Foundation of Shanghai Jiao Tong University (YG2021ZD28, YG2023ZD22), and New Faculty Start-up Foundation of Shanghai Jiao Tong University (23X010501992).References
- Thiebaut de Schotten M, Foulon C, Nachev P. Brain disconnections link structural connectivity with function and behaviour. Nat Commun. 2020;11(1): 5094.
- Salvalaggio A, de Filippo De Grazia M, Zorzi M, de Schotten MT, Corbetta M. Post-stroke deficit prediction from lesion and indirect structural and functional disconnection. Brain. 2020;143(7):2173-2188.
- Liang Z.P. Spatiotemporal imaging with partially separable functions. In: Proceedings of the 4th IEEE International Symposium on Biomedical Imaging: From Nano to Macro.; 2007:988-991.
- Lam F, Ma C, Clifford B, Johnson CL, Liang Z.P. High-resolution 1H-MRSI of the brain using SPICE: Data acquisition and image reconstruction. Magn Reson Med. 2016;76(4):1059-1070.
- Li Y, Lam F, Clifford B, Liang Z.P. A subspace approach to spectral quantification for MR spectroscopic imaging. IEEE Trans Biomed Eng. 2017;64(10):2486-2489.
- Avants B B, Tustison N, Song G. Advanced normalization tools (ANTS). Insight j. 2009;2(365): 1-35.
- Griffis JC, Metcalf NV., Corbetta M, Shulman GL. Lesion Quantification Toolkit: A MATLAB software tool for estimating grey matter damage and white matter disconnections in patients with focal brain lesions. NeuroImage Clin. 2021;30:102639.
- Schaefer A, Kong R, Gordon EM, et al. Local-global parcellation of the human cerebral cortex from intrinsic functional connectivity MRI. Cereb Cortex. 2018;28(9):3095-3114.
- Rajajee V, Kidwell C, Starkman S, et al. Early MRI and outcomes of untreated patients with mild or improving ischemic stroke. Neurology. 2006;67(6):980-984.
Figures