0062
ICA-enabled oxygen-enhanced MRI (OE-MRI) correlates with pulmonary function tests in cystic fibrosis1Centre for Medical Image Computing (CMIC), Department of Medical Physics & Biomedical Engineering, University College London, London, United Kingdom, 2Bioxydyn Limited, Manchester, United Kingdom, 3National Heart & Lung Institute, Imperial College London, London, United Kingdom, 4Royal Brompton Hospital, Guy's & St Thomas' Trust, London, United Kingdom, 5European CF Society Lung Clearance Index Core Facility, London, United Kingdom
Synopsis
Keywords: Lung, Data Processing
Motivation: There is a clinical need for non-ionising methods to assess heterogeneous lung function in cystic fibrosis (CF). Dynamic oxygen-enhanced MRI (OE-MRI) can assess regional lung function, however OE-MRI analysis is impaired by confounding signals and poor SNR.
Goal(s): To evaluate the sensitivity of OE-MRI measures to the lung clearance index (LCI) in CF, with and without independent component analysis (ICA) to reduce noise.
Approach: We used ICA to reduce noise in the OE-MRI measures. We evaluated the correlation between OE-MRI measures, LCI, and pulmonary function tests.
Results: OE-MRI measures demonstrated significant correlation with LCI. OE-MRI measures extracted using ICA displayed clear oxygen-enhancement responses.
Impact: Dynamic lung OE-MRI measures extracted using independent component analysis (ICA) exhibited significant correlation with lung clearance index (LCI2.5) in cystic fibrosis (CF) patients, suggesting a potential application of ICA-extracted OE-MRI measures to assess regional disease severity in CF.
Introduction
Dynamic oxygen-enhanced MRI (OE-MRI) uses inhaled oxygen to provide contrast to indicate regional lung function. T2*-sensitive dual-echo dynamic lung OE-MRI acquisitions have recently been demonstrated at 3T1 and 1.5T2. However, analysis of dynamic lung OE-MRI is challenging due to the presence of artefacts, confounding signals, and poor SNR. Application of independent component analysis (ICA) to dynamic lung OE-MRI can separate the lung’s oxygen-enhancement response from confounds3. Here we present the application of ICA to dual-echo dynamic OE-MRI in cystic fibrosis (CF). We examine the correlation between dynamic OE-MRI, the lung clearance index and spirometry.Methods
11 CF patients (median age 26 years, range 8-46) were imaged using a free-breathing dynamic 2D multi-slice dual-echo RF-spoiled gradient echo OE-MRI acquisition at 1.5T2 (sequence parameters are provided in Table 1). Subjects inhaled medical air (approximately 1.5 minutes), 100% oxygen (approximately 3.5 minutes), and medical air (approximately 4 minutes) via a non-rebreathing mask.The dynamic MRI series were registered using NiftyReg3,4; density-induced MR signal alterations were not corrected. A median filter5 was applied to each echo using a 3x3x3 kernel (in-plane spatial and temporal filtering).
R2* and S0 were extracted from the dual-echo data within a cardiac mask consisting of cardiac tissue, lung tissue, and major blood vessels, assuming a monoexponential signal decay. ICA was applied to separate the oxygen-enhancement response of R2* and S0 from confounding signals using the pipeline described by Needleman et al.3. The pipeline was altered for application to R2* and S0 and a single oxygen-inhalation period by considering 2-72 ICA components. ΔR2* and ΔS0 were calculated as the difference between 100% oxygen-inhalation (average over 180-215 dynamics) and air-inhalation (average over 10-50 dynamics). ΔR2* and ΔS0 were calculated for the registered MRI data without application of ICA (ΔR2*MRI and ΔS0,MRI) and for the ICA-extracted parameters (ΔR2*ICA and ΔS0,ICA).
Subjects underwent pulmonary function testing (PFT) using spirometry to obtain FEV1 %predicted (FEV1%p) and FVC %predicted (FVC%p), and multiple breath N2 washout to obtain the lung clearance index (LCI2.5). The median lung values of ΔR2*MRI, ΔR2*ICA, ΔS0,MRI, and ΔS0,ICA were compared with the PFT measures using Pearson’s correlation; p < 0.05 was considered significant.
Results
The ICA-derived time series ΔR2*ICA and ΔS0,ICA (Figure 1(Aii,iv),(Bii,iv)) demonstrated clearer oxygen-enhancement with reduced signal fluctuations than were observed in ΔR2*MRI and ΔS0,MRI (Figure 1(Ai,iii),(Bi,iii)). The ΔR2*ICA maps of a CF patient (LCI2.5 11.4), shown in Figure 2(Aiii), exhibited homogeneous positive ΔR2*ICA in lung tissue and weakly negative ΔR2*ICA in the heart and aorta. The subject’s ΔS0,ICA maps (Figure 2(Av)) demonstrated positive ΔS0,ICA in lung tissue; positive and negative ΔS0,ICA was observed in cardiac tissue and vessels. The ΔR2*ICA and ΔS0,ICA maps of a patient with higher LCI2.5 (19.6) (Figure 2(Biii,v)) appeared heterogeneous.ΔR2*MRI, ΔR2*ICA, ΔS0,MRI, ΔS0,ICA exhibited significant correlations with LCI2.5 (Table 2). ΔR2*MRI and ΔR2*ICA also displayed significant correlations with FEV1%p and FVC%p, but ΔS0,MRI and ΔS0,ICA did not. The ICA-derived ΔR2*ICA and ΔS0,ICA displayed a stronger correlation with LCI2.5 than those calculated directly from the MRI data (scatter plots are presented in Figure 3).
Discussion
The reduced signal fluctuations of the ΔR2*ICA and ΔS0,ICA time series suggests ICA was effective in reducing confounds.LCI2.5 is of interest as a global marker of CF disease severity, particularly for early disease6. OE-MRI biomarkers provide regional lung function measures, of relevance to heterogeneous presentations of CF. All OE-MRI measures exhibited significant correlations with LCI2.5, with greater correlations demonstrated by the ICA-derived OE-MRI measures, suggesting a likely sensitivity to CF disease severity and the benefits of applying ICA.
ΔR2* is potentially more specific to ventilation than ΔS0, as lung ΔR2* is driven by magnetic susceptibility changes arising from an increased concentration of gaseous oxygen3,7. The strong relation of ΔR2*ICA to ventilation likely resulted in its good correlation with PFTs.
ΔS0 in a spoiled gradient echo is influenced by proton density and R1; ΔR1 is driven by changes in the concentration of dissolved oxygen in lung tissue water and blood plasma, which reflects the combination of ventilation, diffusion, and perfusion3,8. The lower correlation of ΔS0,ICA than ΔR2*ICA with PFTs may be due to the influence of gas exchange and perfusion on ΔS0,ICA, which is not reflected in the functional measurements available in this study. The influence of proton density variation is also likely to confound ΔS0 more than ΔR2*.
Conclusion
The oxygen-induced change of R2* and S0 (a parameter relating to R1), derived from dual-echo gradient echo dynamic OE-MRI, demonstrated good correlation with lung clearance index in cystic fibrosis, suggesting a potential sensitivity to disease severity. ICA increased the sensitivity of the method.Acknowledgements
This work is supported by the EPSRC-funded UCL Centre for Doctoral Training in Medical Imaging (EP/L016478/1), by the Cancer Research UK National Cancer Imaging Translational Accelerator (NCITA) award C1519/A28682, by Innovate UK award 104629, by Cystic Fibrosis Foundation, grant number 0208A120, and by the NIHR Imperial Biomedical Research Centre. JM acknowledges funding from CRUK via the Network Accelerator Award Grant (A21993) to the ART-NET consortium and the Wellcome/EPSRC Centre for Interventional and Surgical Sciences (WEISS) (203145/Z/16/Z).
References
1. Kim M, Naish JH, Needleman SH, et al. Feasibility of dynamic T2*-based oxygen-enhanced lung MRI at 3 T. Magn Reson Med. Published online 2023:1-15. doi:10.1002/mrm.29914
2. Tibiletti M, Short C, Naish JH, et al. Double-echo Oxygen Enhanced MRI at 1 . 5 T correlates with clinical lung function in CF patients. In: Proc. Intl. Soc. Mag. Reson. Med. 32. ; 2023:1399. doi:10.3389/fninf.2014.00044.4
3. Needleman SH, Kim M, McClelland JR, et al. Independent component analysis (ICA) applied to dynamic oxygen‐enhanced MRI (OE‐MRI) for robust functional lung imaging at 3 T. Magn Reson Med. Published online 2023:1-17. doi:10.1002/mrm.29912
4. Modat M, Ridgway GR, Taylor ZA, et al. Fast free-form deformation using graphics processing units. Comput Methods Programs Biomed. 2010;98(3):278-284. doi:10.1016/j.cmpb.2009.09.002
5. van der Walt S, Schönberger JL, Nunez-Iglesias J, et al. scikit-image: image processing in Python. PeerJ. 2014;2:e453. doi:10.7717/peerj.453
6. Davies JC, Cunningham S, Alton EWFW, Innes JA. Lung clearance index in CF: a sensitive marker of lung disease severity. Thorax. 2008;63(2):96 LP - 97. doi:10.1136/thx.2007.082768
7. Pracht ED, Arnold JFTT, Wang T, Jakob PM. Oxygen-enhanced proton imaging of the human lung using T2*. Magn Reson Med. 2005;53(5):1193-1196. doi:10.1002/mrm.20448
8. Edelman RR, Hatabu H, Tadamura E, Li W, Prasad P V. Noninvasive assessment of regional ventilation in the human lung using oxygen–enhanced magnetic resonance imaging. Nat Med. 1996;2(11):1236-1239. doi:10.1038/nm1196-1236
Figures
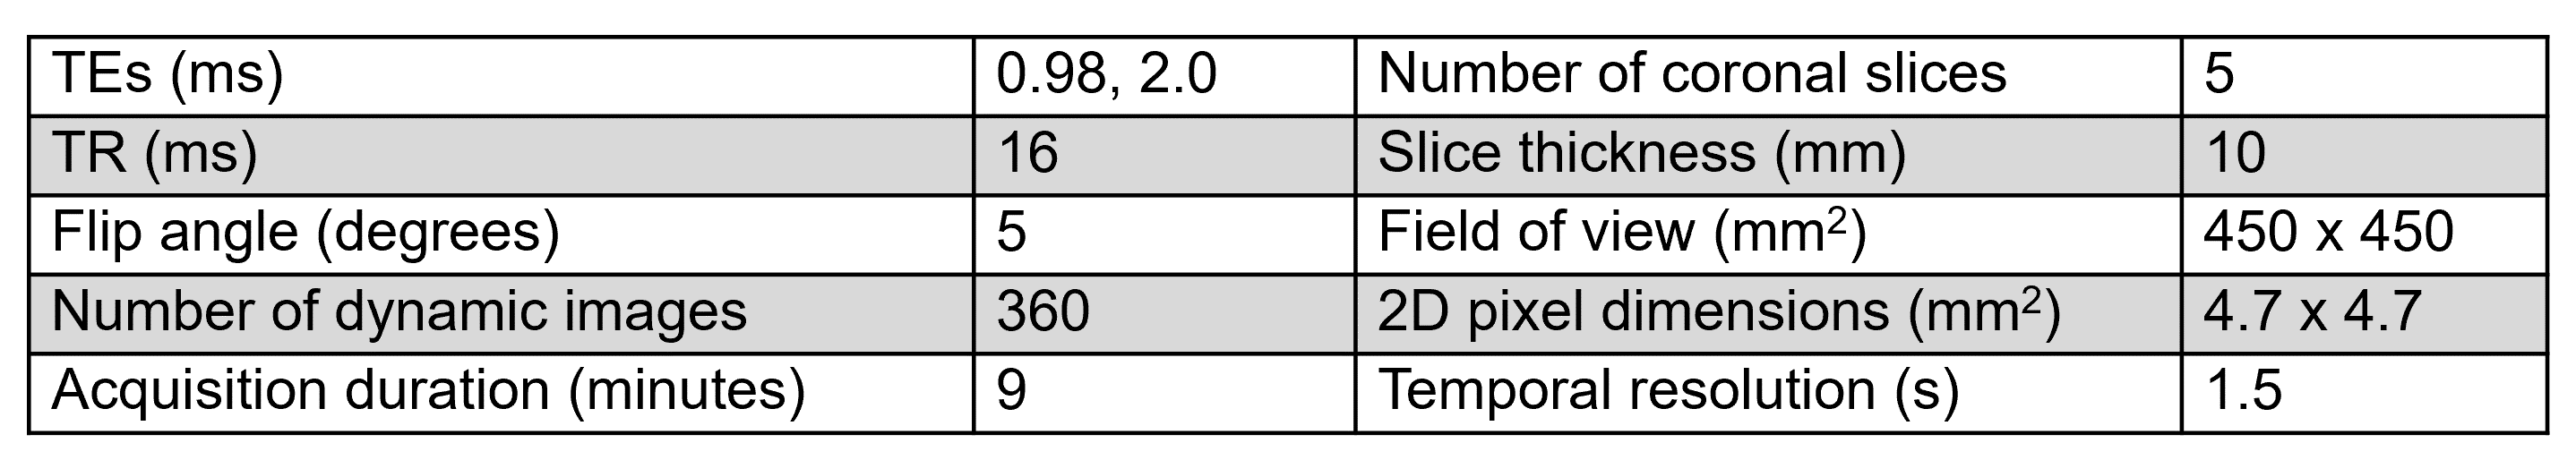
Table 1: Sequence parameters of the free-breathing dynamic 2D multi-slice dual-echo RF-spoiled gradient echo OE-MRI acquisition implemented at 1.5T on a Siemens Aera MRI scanner2.
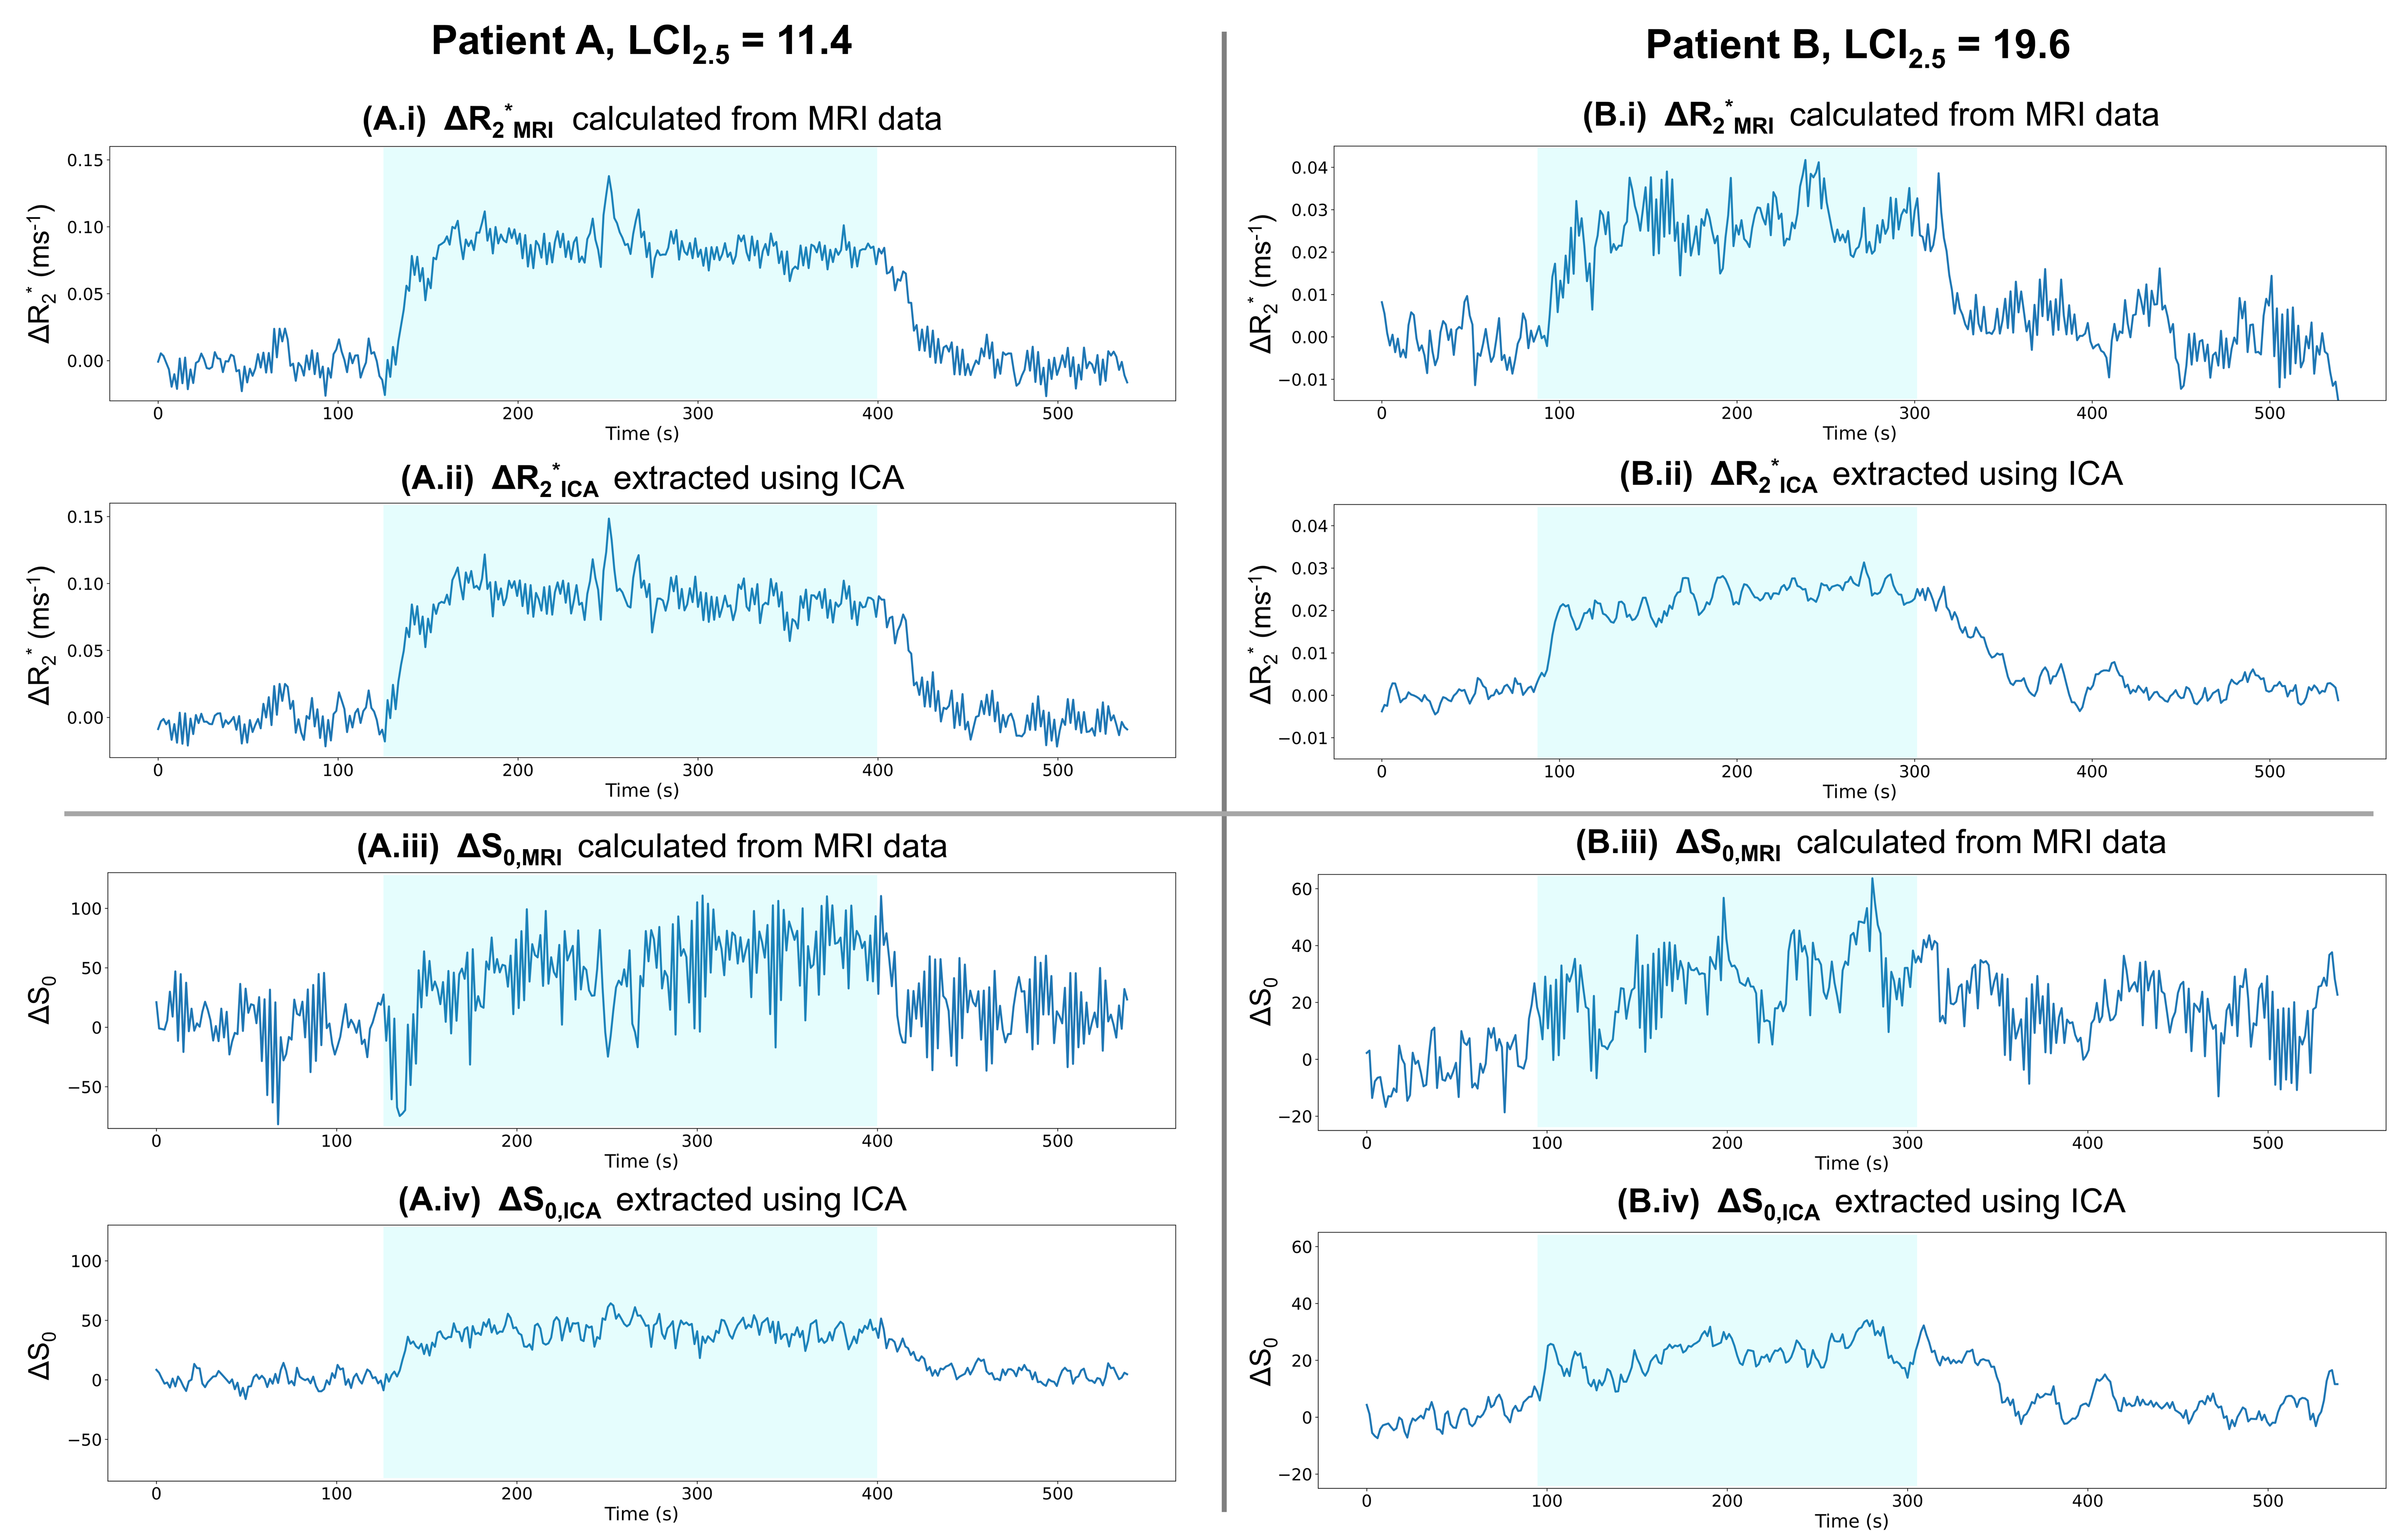
Figure 1: Time series of the median lung value of (i) ΔR2*MRI, (ii) ΔR2*ICA, (iii) ΔS0,MRI, and (iv) ΔS0,ICA for two CF patients: (A) 19 years, LCI2.5 = 11.4, FEV1p% = 96, FVCp% = 112, and (B) 46 years, LCI2.5 = 19.6, FEV1p% = 51, FVCp% = 58. Subject (B) exhibited lower amplitudes than subject (A). The time series extracted from the MRI data (i, iii) contained artefactual signal fluctuations which were reduced in the time series extracted using ICA (ii, iv). The ICA-extracted time series displayed well-defined oxygen-enhancement responses. Blue shading indicates 100% oxygen inhalation.
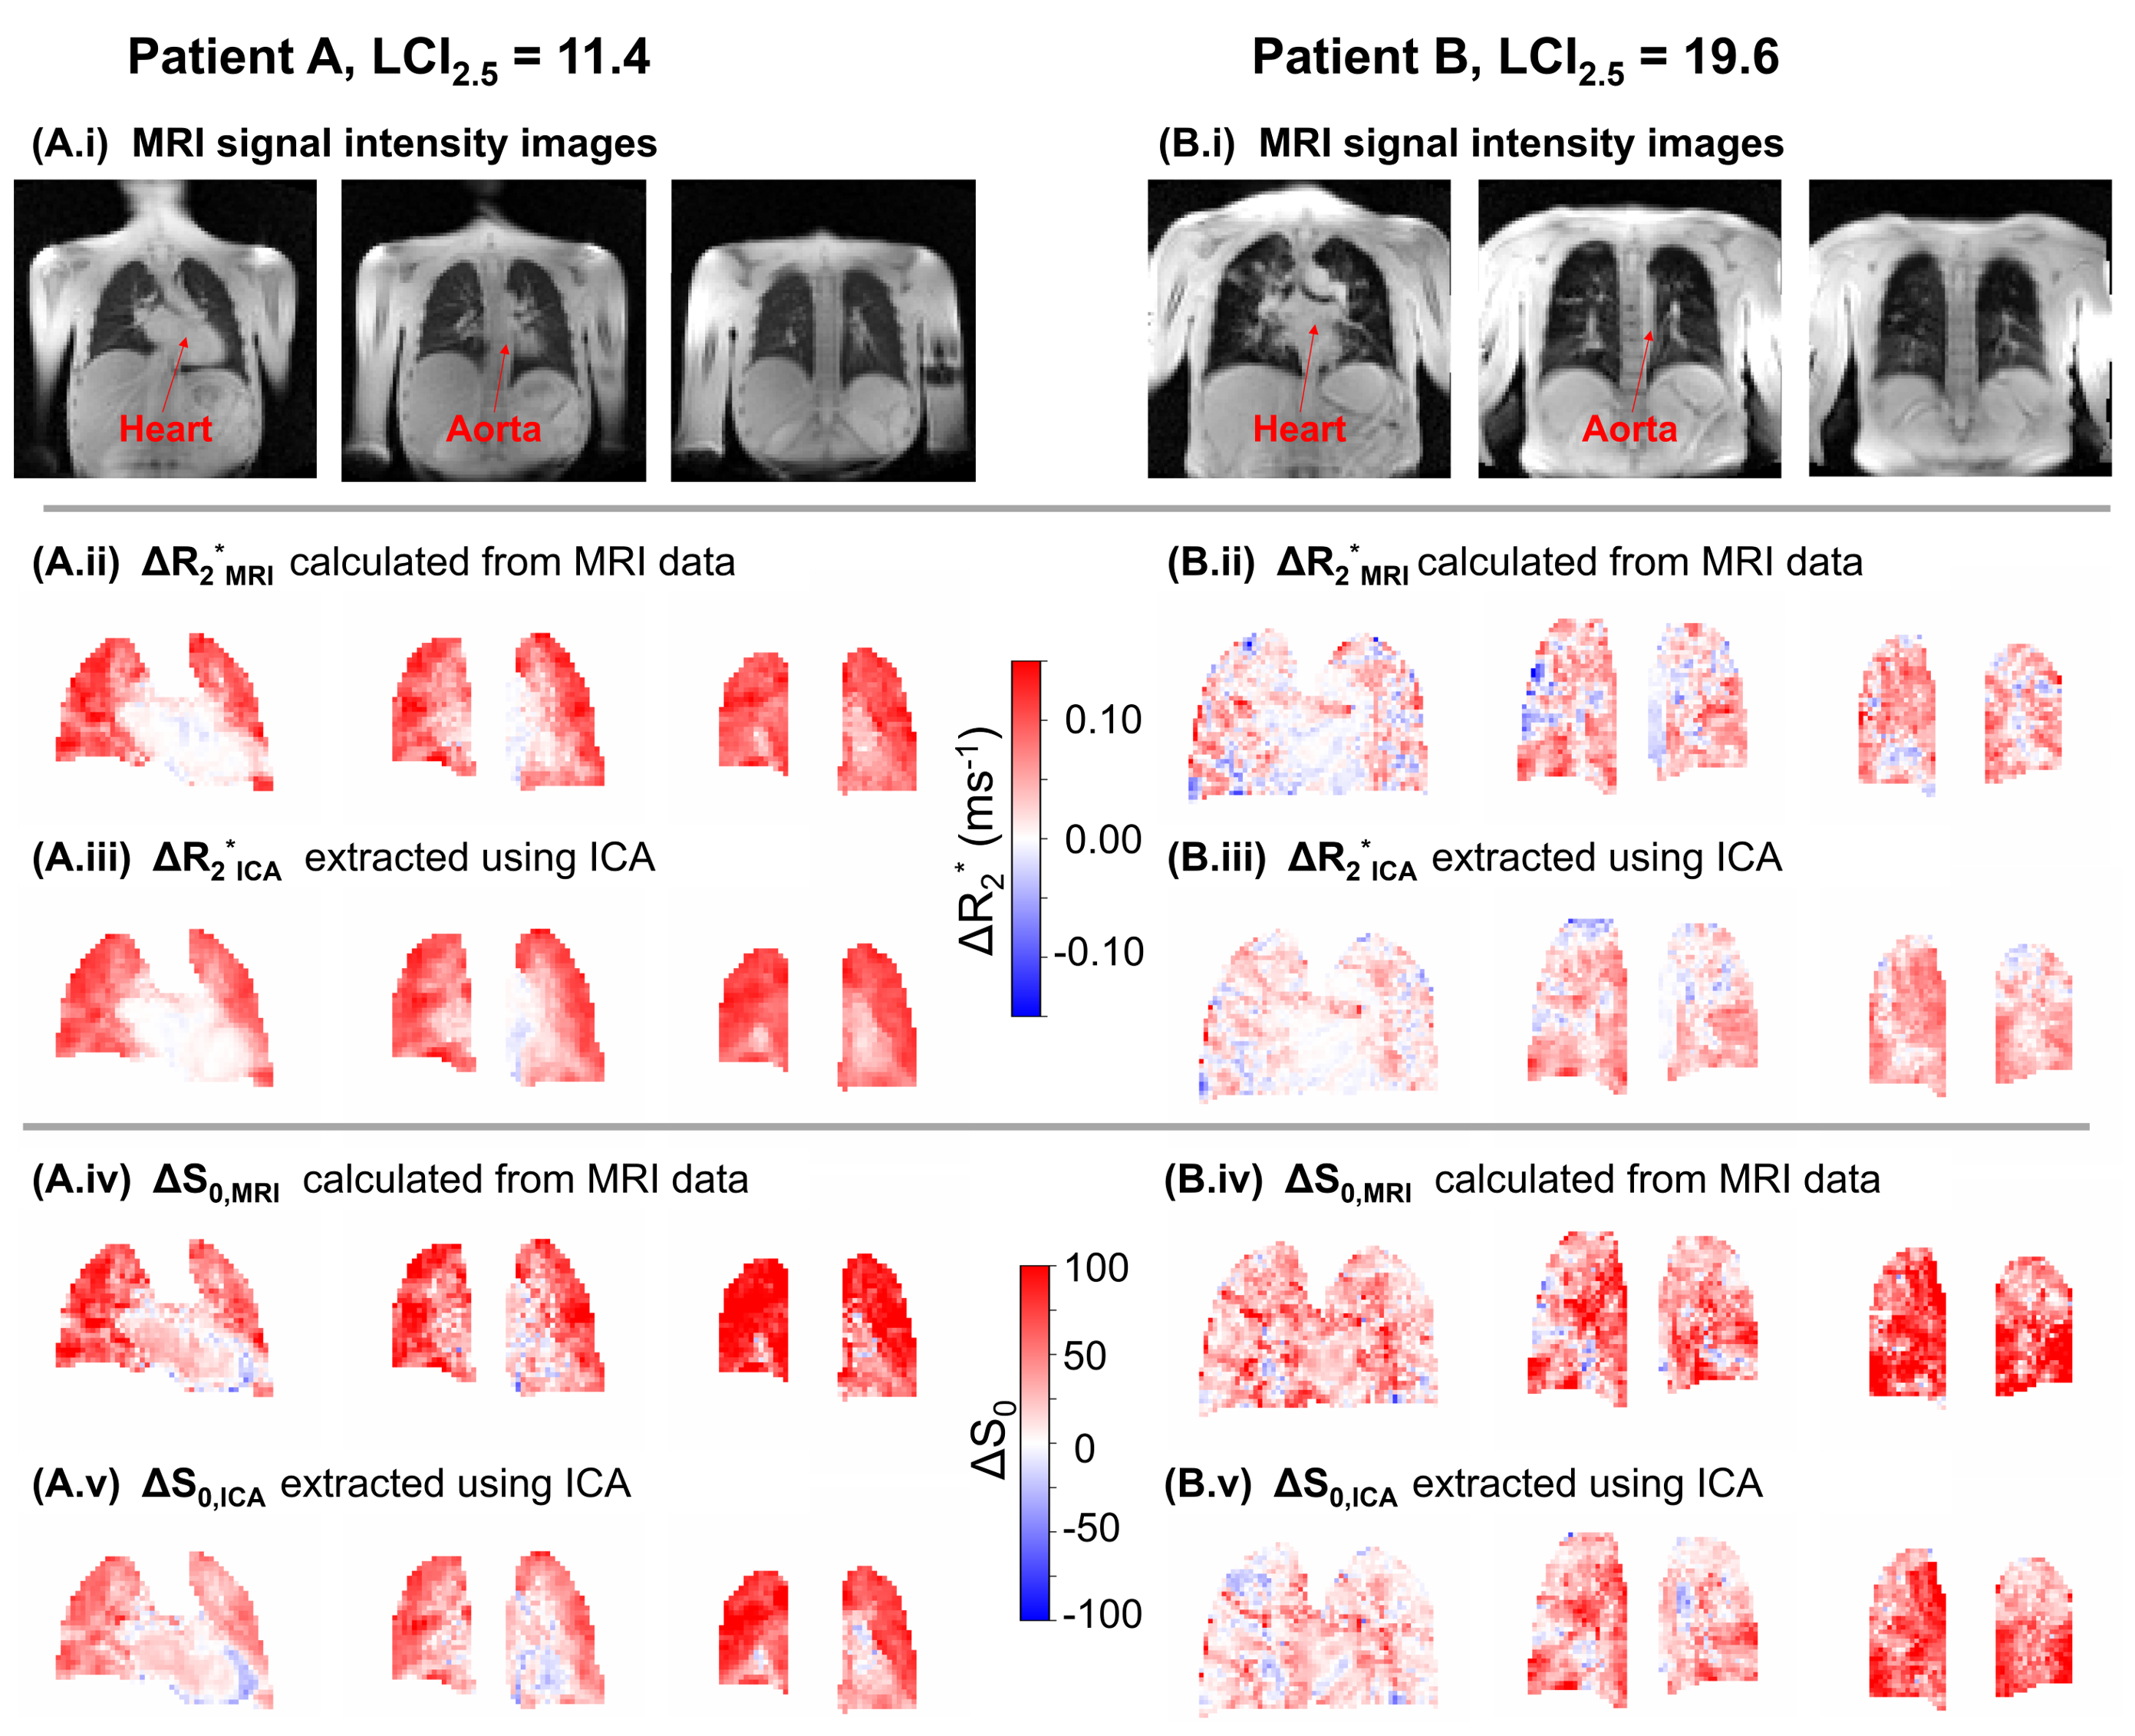
Figure 2: (i) MRI images, and maps of (ii) ΔR2*MRI, (iii) ΔR2*ICA, (iv) ΔS0,MRI, and (v) ΔS0,ICA for three coronal slices from the two CF patients in Figure 1. Subject (A) demonstrated homogeneous positive ΔR2*ICA in lung tissue; cardiac tissue and the aorta displayed a weakly negative ΔR2*ICA. Subject (A) demonstrated positive ΔS0,ICA in lung tissue with regions of negative ΔS0,ICA in cardiac tissue and vessels. The lung appeared heterogeneous in both ΔR2*ICA and ΔS0,ICA for subject (B). The lung appeared more homogeneous in ΔR2*ICA and ΔS0,ICA than ΔR2*MRI and ΔS0,MRI for subject (A).
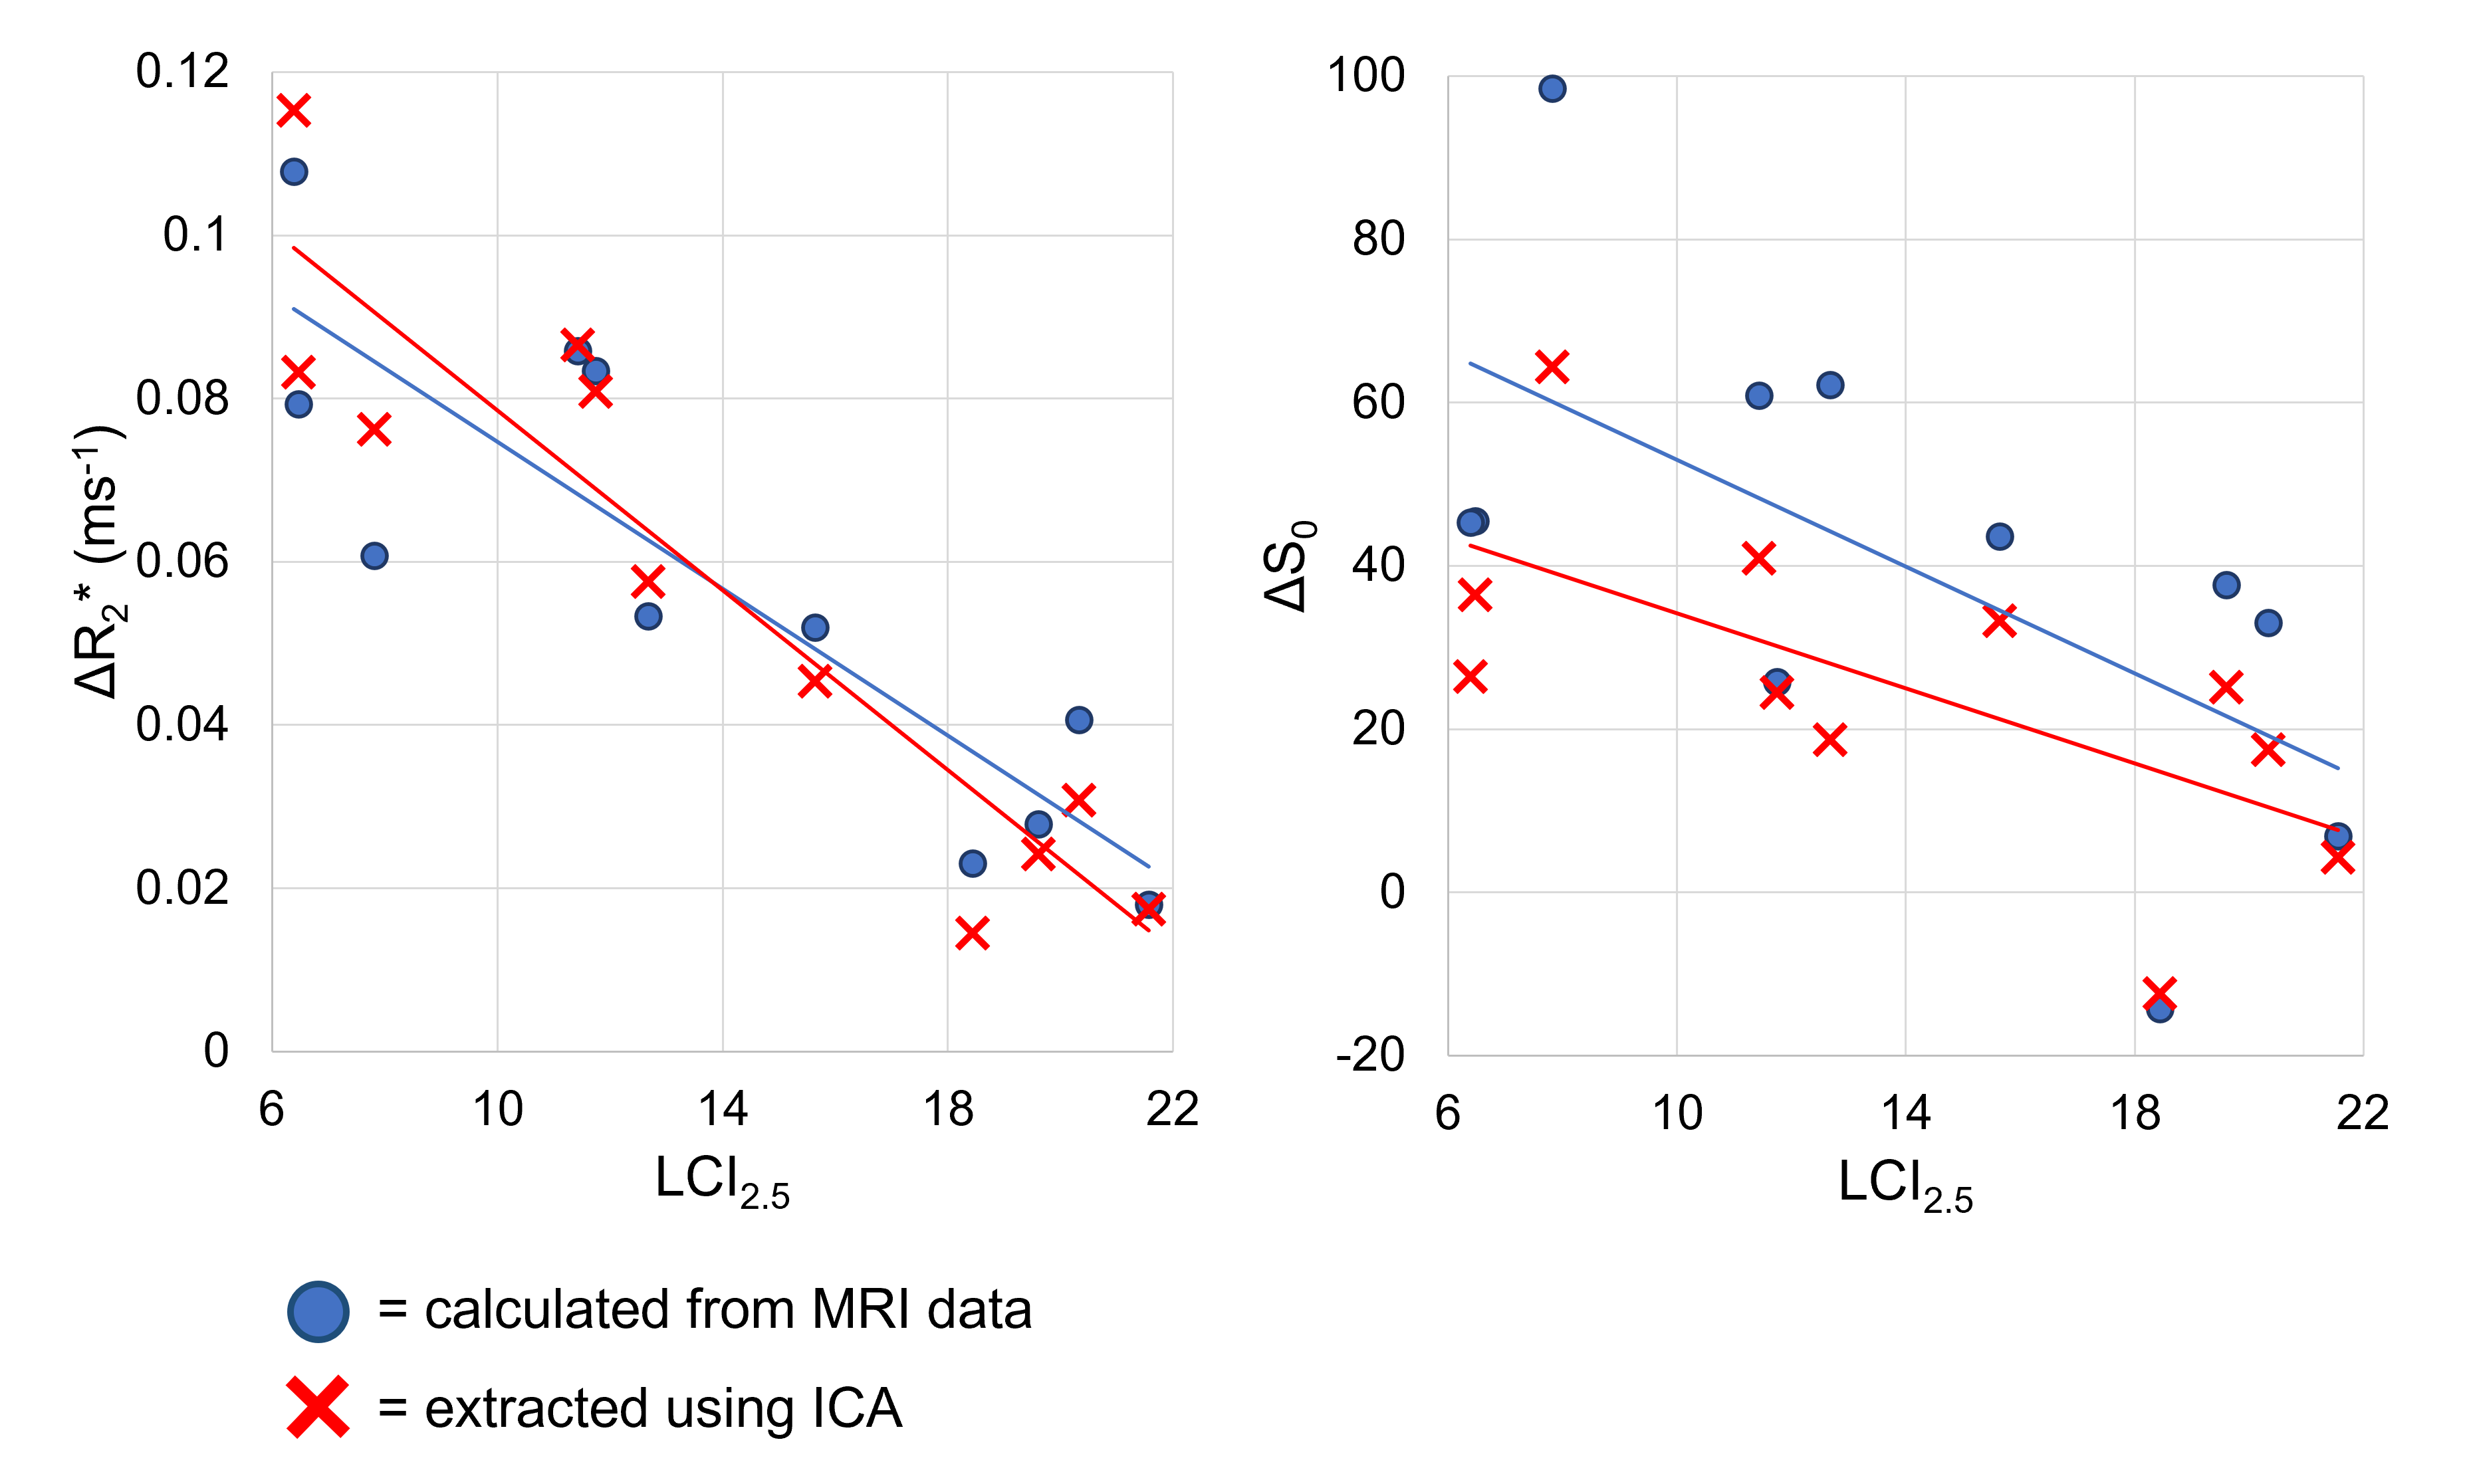
Figure 3: Scatter plots of the linear correlation between ΔR2* (left) and ΔS0 (right) with lung clearance index (LCI2.5). Both the ICA-extracted measures (ΔR2*ICA and ΔS0,ICA, red) and the measures calculated from registered MRI data without application of ICA (ΔR2*MRI and ΔS0,MRI, blue) are shown.
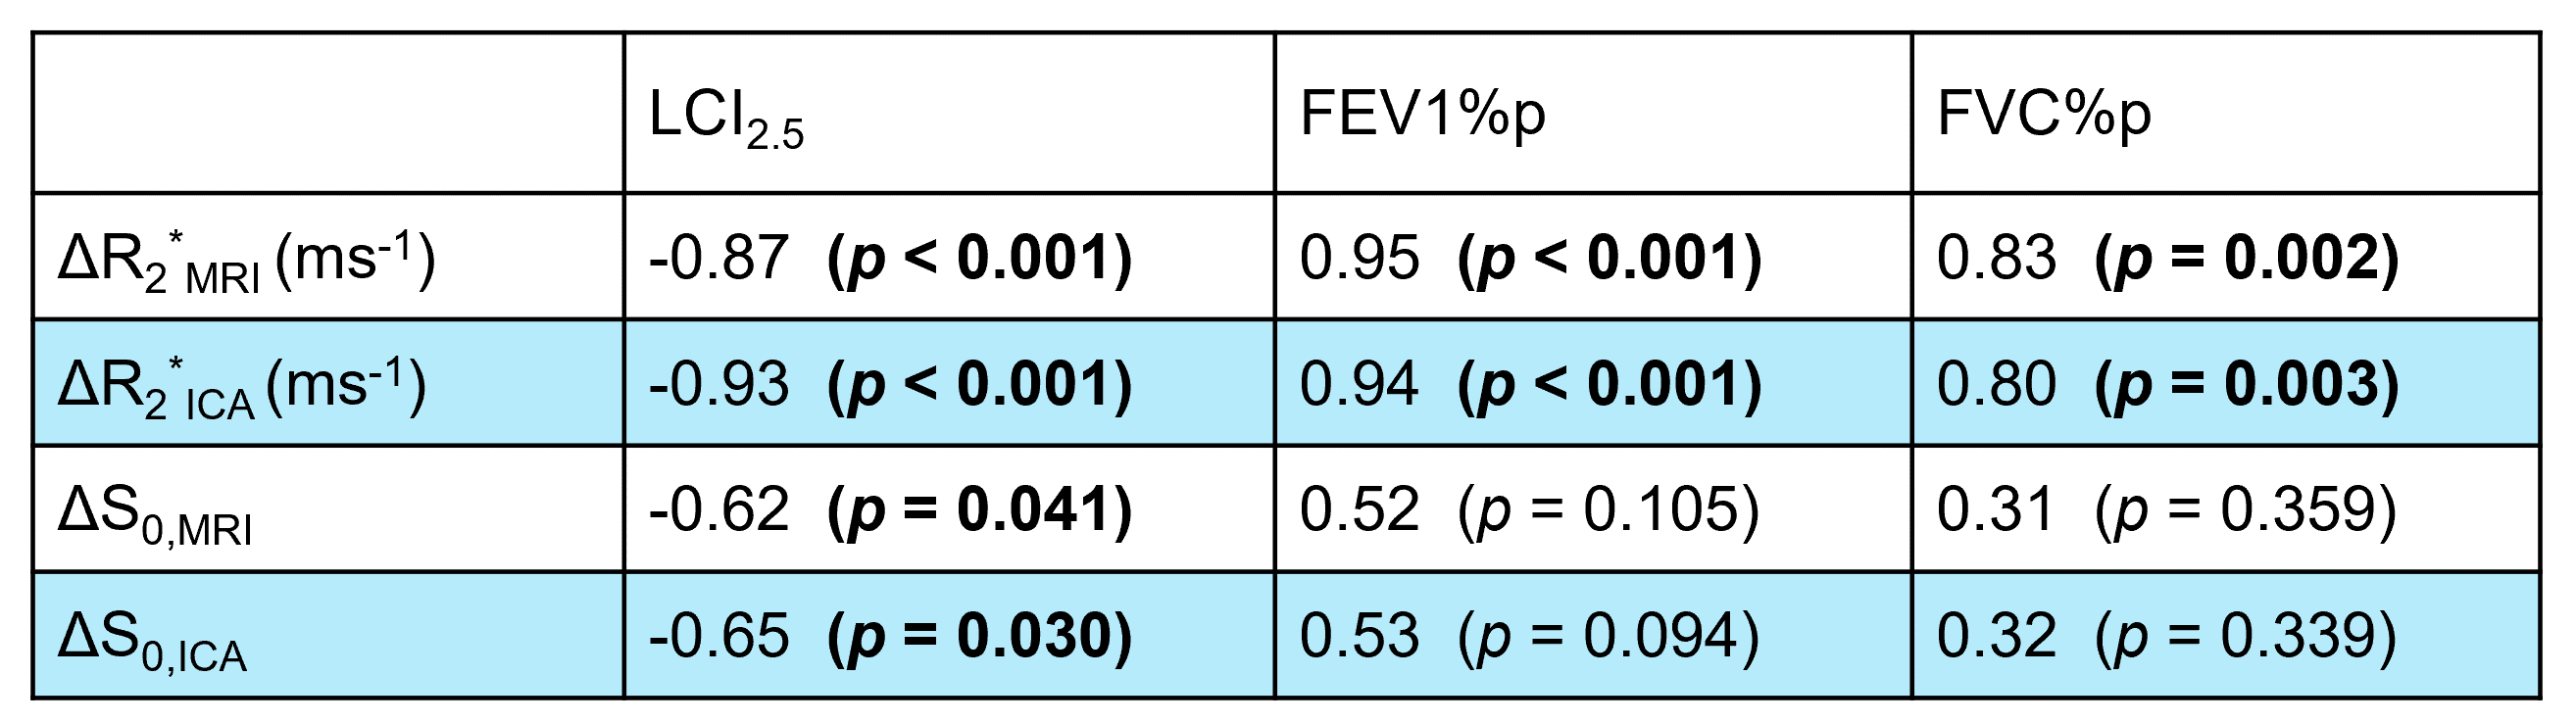
Table 2: Pearson’s correlation of the dynamic OE-MRI measures (ΔR2*MRI, ΔR2*ICA, ΔS0,MRI, ΔS0,ICA) with PFTs. OE-MRI measures extracted using ICA (ΔR2*ICA and ΔS0,ICA) are shaded in blue.