0061
Simultaneous extraction of Oxygen enhanced MRI indices and α-mapping in Cystic Fibrosis1Bioxydyn Ltd, Manchester, United Kingdom, 2National Heart & Lung Institute, Imperial College London, London, United Kingdom, 3Royal Brompton Hospital, Guy's & St Thomas’ Trust, London, United Kingdom, 4MCMR, Manchester University NHS Foundation Trust, Manchester, United Kingdom, 5Centre for Imaging Sciences, University of Manchester, Manchester, United Kingdom, 6Centre for Paediatric and Child Health, Imperial College London, London, United Kingdom, 7Centre for Medical Image Computing, Department of Medical Physics and Biomedical Engineering, University College London, London, United Kingdom
Synopsis
Keywords: Lung, Oxygenation
Motivation: Functional lung MRI methods based on different physical principles are available, but their relationship is not well understood in disease
Goal(s): Compare dynamic oxygen-enhanced MRI and ‘α-mapping’ extracted from the same acquisition with lung clearance index (LCI) in a cystic fibrosis (CF) population
Approach: Oxygen enhancement at 30s to 60s after oxygen start and at plateau are compared with α-mapping in 45 CF patients.
Results: α-mapping and OE-MRI correlate strongly with LCI, confirming their validity. Dynamic OE-MRI identifies areas of fast and slow enhancement, which may be areas of collateral ventilation. α-mapping cannot separate non-ventilated areas from areas of slow gas arrival.
Impact: Dynamic OE-MRI and α-mapping are extracted from a single acquisition and compared in a cystic fibrosis population. Dynamic OE-MRI identifies areas of fast and slow enhancement, possible collateral ventilation. α-Index cannot separate non-ventilated areas from areas of slow gas arrival.
Introduction
Dynamic oxygen-enhanced MRI (OE-MRI) uses changing levels of inhaled oxygen to provide regional lung ventilation-related metrics. Information regarding the speed and the intensity of the signal change can be extracted from dynamic acquisitions1.Another family of functional MR lung methods (eg Fourier Decomposition2, PREFUL3, α-mapping4) studies how lung signal changes over time due to changes in parenchyma density over the respiratory cycle to infer ventilation. The ‘α-mapping’ method models the signal variation with lung volume, and works well at low temporal resolution.
In this work we compare dynamic OE-MRI metrics and α-mapping extracted from the same acquisition and we explore the relationship between imaging biomarkers, lung clearance index (LCI) and spirometry in cystic fibrosis (CF) patients.
Methods
Population and data acquisitionForty-five CF patients (age range 8-49 yo) were recruited, and informed consent was obtained. Imaging was carried out on a 1.5 T Siemens Aera scanner and consisted of a 9 min dynamic 2D multi-slice double-echo T1-FFE sequence (TEs = 0.98/2 ms, TR = 16 ms, FA = 5 deg, FOV 450x450 mm2, in plane spatial resolution 4.7x4.7 mm2, 360 time points, temporal resolution 1.5 s). Five coronal 10 mm thick slices were acquired. Breathing gases were delivered to the free-breathing subject at 15 L/min via a non-rebreather mask (Intersurgical EcoliteTM, Intersurgical) and switched from air to 100% oxygen after 1.5 min and back to air at 5 min.
Images were registered to a reference expiratory image using ANTS5 and lungs segmented manually. Change in lung volume over time (R(t)) was extracted by applying each transformation to the lung mask and extracting the area of the deformed segmentations. All time points where R(t) was 20% higher than the median were identified as outliers (deep breathing or coughing) and excluded from further analysis .
Respiratory α-Index
Under the assumption that at shallow breathing a linear relationship between the lung signal and the pixel density exists, a ‘sponge model’4,6 analysis can be applied, i.e. we assume there is a linear relationship between log(R(t)) and the log of the signal intensity (SI(t)):
log(SI(t)) = α log(R(t)) + c
where α is the α-Index, C a constant (figure 1, ref 6).
The α-Index was calculated pixel-wise from the first echo after the application of a 3x3 in-plane median filter. α-Index images were then thresholded as suggested by Obert et al7 to obtain the Ventilated Volume Fraction from the α-Index (α-I-VVF).
OE-MRI analysis
Dynamic pixel-wise R2* values were extracted from the double echo images and a median filter with 3x3 in plane kernel applied. The R2* images from the second half of the oxygen delivery period were averaged to obtain R2*O2-plateau, and the images before the oxygen was switched on were averaged to obtain R2*air. The images between 30s and 60s after the oxygen switch were also averaged as R2*O2-30s-60s. Two oxygen enhancement maps were then extracted, ∆R2*plateau = R2*O2-plateau - R2*air and ∆R2*30s-60s = R2*O2-30s-60s - R2*air. For both, the whole lung median was extracted and ∆R2* images were thresholded as α-Index images to obtain the VVF at plateau and at 30s - 60s (OE-VVF-plateau / OE-VVF-30-60s).
Pulmonary Function Testing
On the same day, subjects underwent pulmonary function testing (PFT) to obtain FEV1%predicted(p) and FVC%p from spirometry and the lung clearance index (LCI2.5) from multiple breath N2 washout.
Statistics
Pearson’s correlation between imaging and PFT parameters was calculated. Dice coefficients among thresholded maps were calculated.
Results
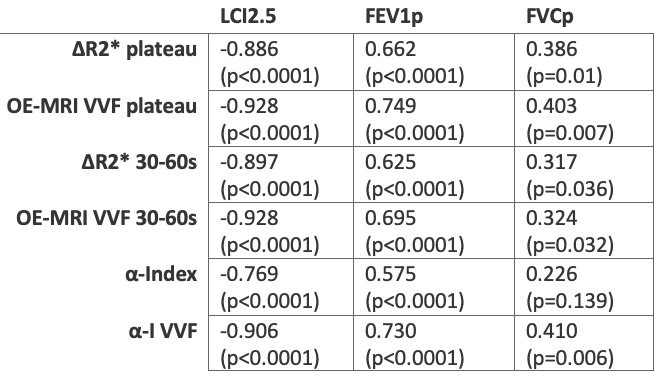
Figure 2 presents scatterplots of the relationships between LCI2.5 and MR biomarkers considered. The correlation coefficients obtained between PFTs, and imaging biomarkers are presented in Table 1.The Dice coefficient between OE-VVF-plateau and α-I-VVF is 0.84 ± 0.16, between OE-VVF-30-60s and α-I-VVF is 0.79 ± 0.19, between OE-VVF-plateau and OE-VVF-30-60s is 0.85 ± 0.13.
Figure 3 presents an example of a slowly O2 enhancing defect (low OE-VVF-30s-60s, normal OE-VVF -plateau) corresponding to an α-index defect.
Figure 4 presents an example of a non-O2 enhancing defect (low OE-VVF-30s-60s, low OE-VVF-plateau) also corresponding to a α-index defect.
Discussion
α-Index and OE-MRI results present similar and strong correlations with LCI2.5, confirming the validity of both methods in extracting functional information in a CF population.The Dice coefficients confirm a large but not complete overlap between ventilation maps obtained by both methods.
The results suggest that dynamic OE-MRI distinguish areas of fast and slow enhancement, which may represent areas of collateral ventilation. α-Index alone, and other methods based on similar assumptions, may not be able to separate non-ventilated areas from areas of slow gas arrival (Figure 3).
Acknowledgements
Cystic Fibrosis Foundation, grant number 0208A120References
1) Martini, K., et al. "Volumetric dynamic oxygen-enhanced MRI (OE-MRI): comparison with CT Brody score and lung function in cystic fibrosis patients." European radiology 28 (2018): 4037-4047.
2) Bauman, G., Puderbach, M., Deimling, M., Jellus, V., Chefd'hotel, C., Dinkel, J., ... & Schad, L. R. (2009). Non‐contrast‐enhanced perfusion and ventilation assessment of the human lung by means of Fourier decomposition in proton MRI. Magnetic Resonance in Medicine: An Official Journal of the International Society for Magnetic Resonance in Medicine, 62(3), 656-664.
3) Behrendt, Lea, et al. "Validation of automated perfusion‐weighted phase‐resolved functional lung (PREFUL)‐MRI in patients with pulmonary diseases." Journal of Magnetic Resonance Imaging 52.1 (2020): 103-114.
4) Pusterla, Orso, et al. "Rapid 3D in vivo 1H human lung respiratory imaging at 1.5 T using ultra‐fast balanced steady‐state free precession." Magnetic resonance in medicine 78.3 (2017): 1059-1069.
5) Avants, B.B., Tustison, N.J., Song, G., Cook, P.A., Klein, A. and Gee, J.C., 2011. A reproducible evaluation of ANTs similarity metric performance in brain image registration. Neuroimage, 54(3), pp.2033-2044.
6) Staring, Marius, et al. "Towards local estimation of emphysema progression using image registration." Medical Imaging 2009: Image Processing. Vol. 7259. SPIE, 2009.
7) Obert, A. J., Kern, A. L., Gutberlet, M., Voskrebenzev, A., Kaireit, T. F., Crisosto, C., ... & Vogel‐Claussen, J. (2022). Volume‐Controlled 19F MR Ventilation Imaging of Fluorinated Gas. Journal of Magnetic Resonance Imaging.
Figures
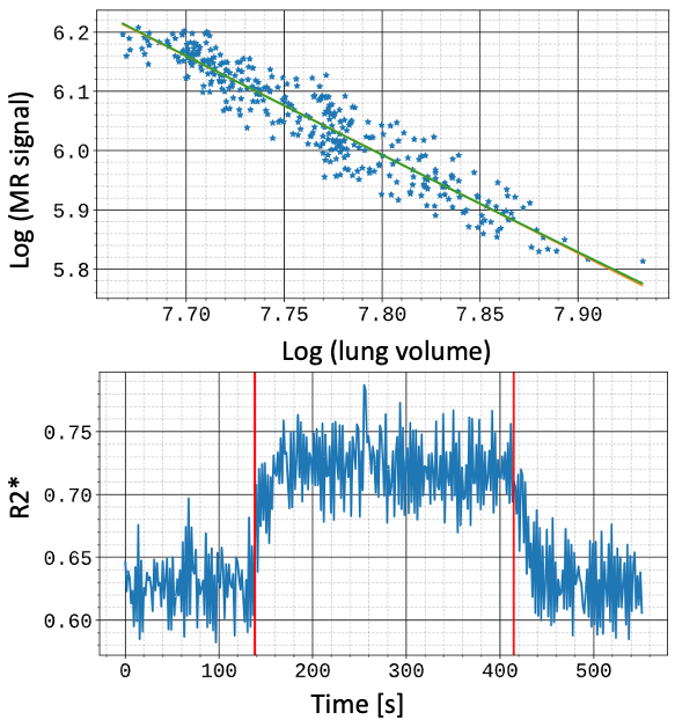
Figure 1: Example of the α-Index analysis (top) and OE-MRI analysis (bottom), from the same dataset (whole lung average).
α-Index analysis fit a linear relationship between the logarithm of the first echo to the logarithm of the lung volume and uses the slope (α) as a marker of ventilation.
The OE-MRI extracts R2* from two echoes and analyses it over time to extract enhancement at different time intervals. Red vertical bars indicate the time where gas delivery is switched.
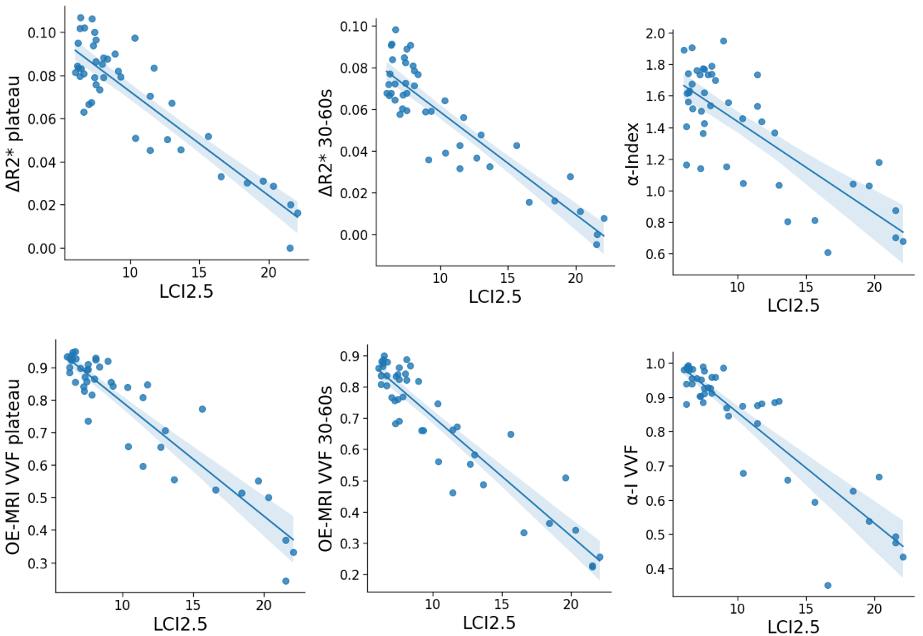
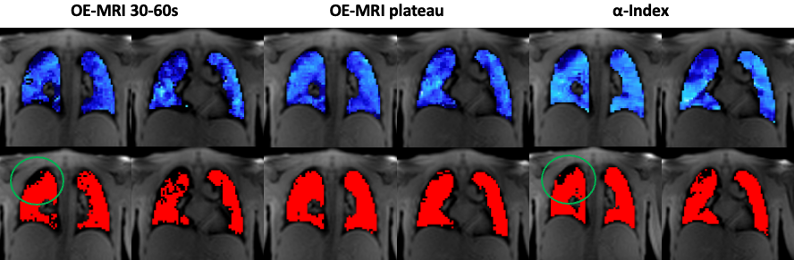
Figure 3: Representative images of 2 slices from a 17 yo CF patient with an LCI of 8.07 and FEV1p of 102%. Top row shows the full dynamic range of each parameter; the bottom row shows the thresholded images to show areas of defect.
Areas of low oxygen enhancement in the upper right lobe (circle) are visible in the early (30-60s) but not in the plateau oxygen enhancement. The α-Index images present a pattern similar to early (30-60s) oxygen enhancement.
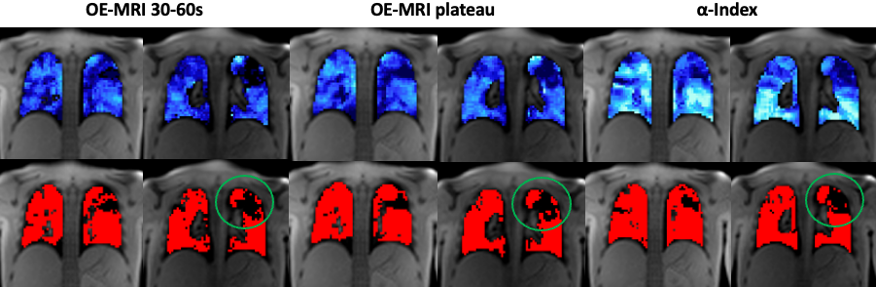
Figure 4: Representative images of 2 slices from a 21 yo CF patient with an LCI of 7.46 and FEV1p of 76%. Top row shows the full dynamic range of each parameter; the bottom row shows the thresholded images to show areas of defect.
Areas of low oxygen enhancement (circle) are visible in the upper lobes in both in the early (30-60s) and plateau enhancement. A similar pattern in visible in α-Index images.