0059
Dual-center repeatability and comparison of 3D phase-resolved functional lung (PREFUL) ventilation MRI at 3T1Institute of Diagnostic and Interventional Radiology, Hannover Medical School, Hannover, Germany, 2Biomedical Research in Endstage and Obstructive Lung Disease Hannover (BREATH), German Center for Lung Research (DZL), Hannover, Germany, 3Department of Respiratory Medicine, Eastern Health, Melbourne, Australia, 4Faculty of Medicine, Nursing and Health Sciences, Monash University, Melbourne, Australia, 5Monash Biomedical Imaging, Monash University, Melbourne, Australia, 6Monash Imaging Department, Monash Health, Melbourne, Australia, 7MR Application Predevelopment, Siemens Healthineers AG, Erlangen, Germany
Synopsis
Keywords: Lung, Lung, Repeatability
Motivation: 3D phase-resolved functional lung (PREFUL) MRI provides evaluation of ventilation during free-breathing without contrast agents. The repeatability of 3D PREFUL at 3T is unknown.
Goal(s): To assess the performance of 3D PREFUL in dual-center setting and to compare 3T measurement to 1.5T.
Approach: Dual-center 3D PREFUL MRI in healthy volunteers
Results: 3D PREFUL was feasible at 3T scanners at both centers. The repeatability assessments showed a bias only for one parameter, where it was negligibly small. Significant differences of 3D PREFUL ventilation parameters were observed between 1.5T and 3T, suggesting for pronounced susceptibility effects at 3T.
Impact: Despite the pronounced differences in ventilation parameters across the field strengths, consistently reproducible surrogates of ventilation markers were derived from 3D PREFUL MRI using a patient-friendly acquisition without the need for contrast agents and during free tidal breathing.
Introduction
MRI devices with a field strength of 3T are routinely used in clinical radiology. When compared to 1.5T, the higher field strength of 3T offers higher achievable signal-to-noise ratio or faster imaging in many clinical applications1. However, in the lungs, the theoretical advantage of 3T might be outweighed by the increase of the magnetic susceptibility in the lungs which decreases the short T2* relaxation time even further2. 3D phase-resolved functional (PREFUL) lung MRI offers ventilation assessment of the whole lung3. Good repeatability of ventilation parameters derived by 3D PREFUL was reported for 1.5T4. Feasibility and repeatability of 3D PREFUL at 3T has not yet been evaluated. In this dual-center study, the performance of 3D PREFUL MRI at 3T is evaluated and compared to imaging at 1.5T.Methods
At Center 1 (C1), 12 healthy volunteers underwent MRI at both 1.5T and 3T, while at Center 2 (C2), 14 healthy volunteers underwent MRI at 3T. The study participants' characteristics are shown in Table 1a. During each MR session, a commercially available 3D spoiled gradient echo acquisition with stack-of-stars trajectory was performed for 8 minutes during free breathing (sequence parameters in Table 1b). The MR acquisitions were repeated after a minimum of 10 minutes outside the scanner.Prior to image reconstruction of temporally resolved 3D PREFUL images (27-39 breathing states) a radial intersection gradient delay estimation (RING) method5, was used for the gradient delay correction. The offline image reconstruction part was followed by registration towards the end-inspiratory image, implemented in Forsberg toolbox6. Additionally, the morphological images of the 2nd measurement were spatially co-registered to the fixed image used for the spatial alignment of the 1st measurement.
For all scans, regional ventilation (RVent) maps were computed for each breathing phase7 and the RVent ventilation cycle was analyzed by flow-volume loops (FVL)8. Similarity of all FVLs to a healthy-reference FVL9 was measured by cross-correlation, which resulted in a cross-correlation (FVL-CM) map. Further, ventilated volume percentage (VVPRVent and VVPFVL-CM) values were calculated using published thresholds9,10.
To exclude potential bias caused by different tidal volumes across 3D PREFUL measurements, the tidal volume of each measurement was estimated using deep-learning based lung parenchyma segmentation of end-inspiratory and end-expiratory morphological images11. The tidal volume was calculated as a volume difference between both lung parenchyma segmentations.
For the image analysis, the previously described lung parenchyma segmentation of the end-inspiratory image was used. Differences between ventilation parameters (mean RVent, standard deviation (SD) RVent, mean FVL-CM, SD FVL-CM, VVPRVent, VVPFVL-CM and tidal volume) were tested for significance using Wilcoxon signed-rank/rank-sum tests. The agreement between measurements was assessed by Bland-Altman analysis, coefficient of variation (CoV) and intraclass-correlation analysis (ICC).
Results
Medians and interquartile ranges of 3D PREFUL ventilation parameters derived for all measurements are presented in Table 2.No significant bias was observed between 1st and 2nd measurement at both centers, except for VVPFVL-CM parameter derived at C2 (mean bias of -2.4%, P=0.0419). Median CoV of all parameters was less than 12 %, except the SD FVL-CM with median CoV up to 25%. The ICC values ranged from 0.34 to 0.94.
For both 3D PREFUL measurements, RVent values (mean and SD) were significantly increased (both P<=0.0146, mean of -0.04ml/ml and -0.02ml/ml for mean RVent and SD RVent, respectively) and mean FVL-CM values were significantly decreased (P=0.0469, mean bias of 0.01, Table 3a) at 3T compared to 1.5T. In the 1st measurements, VVPRVent values of 1.5T were significantly elevated (mean bias of 4.2%, P=0.0034). A visual comparison of PREFUL derived parameters and corresponding morphological maps, derived at 1.5T and 3T for the same subject, is shown in Figure 1.
In Figure 2, a visual comparison of age-matched volunteers is depicted. No significant bias was observed between the age-matched 3D PREFUL measurements (Table 3b, all P>0.18).
Discussion
3D PREFUL MRI was feasible at both centers at 3T and the dual-center comparison showed no differences.Repeatability assessment showed no significant bias between 1st and 2nd measurements, excluding mean bias of 2.5% for VVPFVL-CM at C2. However, this bias lies under the minimal clinically important difference of 4%12. CoV and ICC values were in agreement with previous study4.
There were differences between 1.5T and 3T RVent measurements independent of tidal volume. This finding suggests pronounced sensitivity of 3T data to susceptibility variations in the lung parenchyma.
Conclusion
Preliminary data suggest that 3D PREFUL ventilation parameters remain stable at 3T among different centers. Minor but significant differences were observed using 3T compared to 1.5T. This is attributed to differences in field strength. Future larger studies are required to confirm these findings.Acknowledgements
This work was funded by the German Center for Lung Research (DZL).References
1. Lederlin M, Crémillieux Y. Three-dimensional assessment of lung tissue density using a clinical ultrashort echo time at 3 tesla: A feasibility study in healthy subjects. J Magn Reson Imaging. 2014;40(4):839-847. doi:10.1002/jmri.24429
2. Yu J, Xue Y, Song HK. Comparison of lung T2* during free-breathing at 1.5 T and 3.0 T with ultrashort echo time imaging. Magn Reson Med. 2011;66(1):248-254. doi:10.1002/mrm.22829
3. Klimeš F, Voskrebenzev A, Gutberlet M, et al. 3D phase‐resolved functional lung ventilation MR imaging in healthy volunteers and patients with chronic pulmonary disease. Magn Reson Med. 2021;85(2):912-925. doi:10.1002/mrm.28482
4. Klimeš F, Voskrebenzev A, Gutberlet M, et al. Repeatability of dynamic 3D phase-resolved functional lung (PREFUL) ventilation MR Imaging in patients with chronic obstructive pulmonary disease and healthy volunteers. J Magn Reson Imaging. 2021;54(2):618-629. doi:10.1002/jmri.27543
5. Rosenzweig S, Holme HCM, Uecker M. Simple auto‐calibrated gradient delay estimation from few spokes using Radial Intersections (RING). Magn Reson Med. 2019;81(3):1898-1906. doi:10.1002/mrm.27506
6. Forsberg D. fordanic/image-registration (https://github.com/fordanic/image-registration), GitHub. Retrieved September 8, 2021.
7. Klimeš F, Voskrebenzev A, Gutberlet M, et al. Free‐breathing quantification of regional ventilation derived by phase‐resolved functional lung (PREFUL) MRI. NMR Biomed. 2019;(February):e4088. doi:10.1002/nbm.4088
8. Voskrebenzev A, Klimeš F, Gutberlet M, et al. Imaging-Based Spirometry in Chronic Obstructive Pulmonary Disease (COPD) Patients using Phase Resolved Functional Lung Imaging (PREFUL). Proc Intl Soc Mag Reson Med 26. 2018:1079. http://indexsmart.mirasmart.com/ISMRM2018/PDFfiles/1079.html.
9. Moher Alsady T, Voskrebenzev A, Greer M, et al. MRI‐derived regional flow‐volume loop parameters detect early‐stage chronic lung allograft dysfunction. J Magn Reson Imaging. 2019;50(6):1873-1882. doi:10.1002/jmri.26799
10. Kaireit TF, Kern A, Voskrebenzev A, et al. Flow Volume Loop and Regional Ventilation Assessment Using Phase‐Resolved Functional Lung (PREFUL) MRI: Comparison With 129Xenon Ventilation MRI and Lung Function Testing. J Magn Reson Imaging. 2021;53(4):1092-1105. doi:10.1002/jmri.27452
11. Wernz M, Zubke M, Voskrebenzev A, et al. Influence of lung vessel segmentation on the reproducibility of PREFUL MRI. Proc IWPFI 10. 2022:73.
12. Eddy RL, Svenningsen S, McCormack DG, Parraga G. What is the minimal clinically important difference for helium-3 magnetic resonance imaging ventilation defects? Eur Respir J. 2018;51(6):8-11. doi:10.1183/13993003.00324-2018
Figures
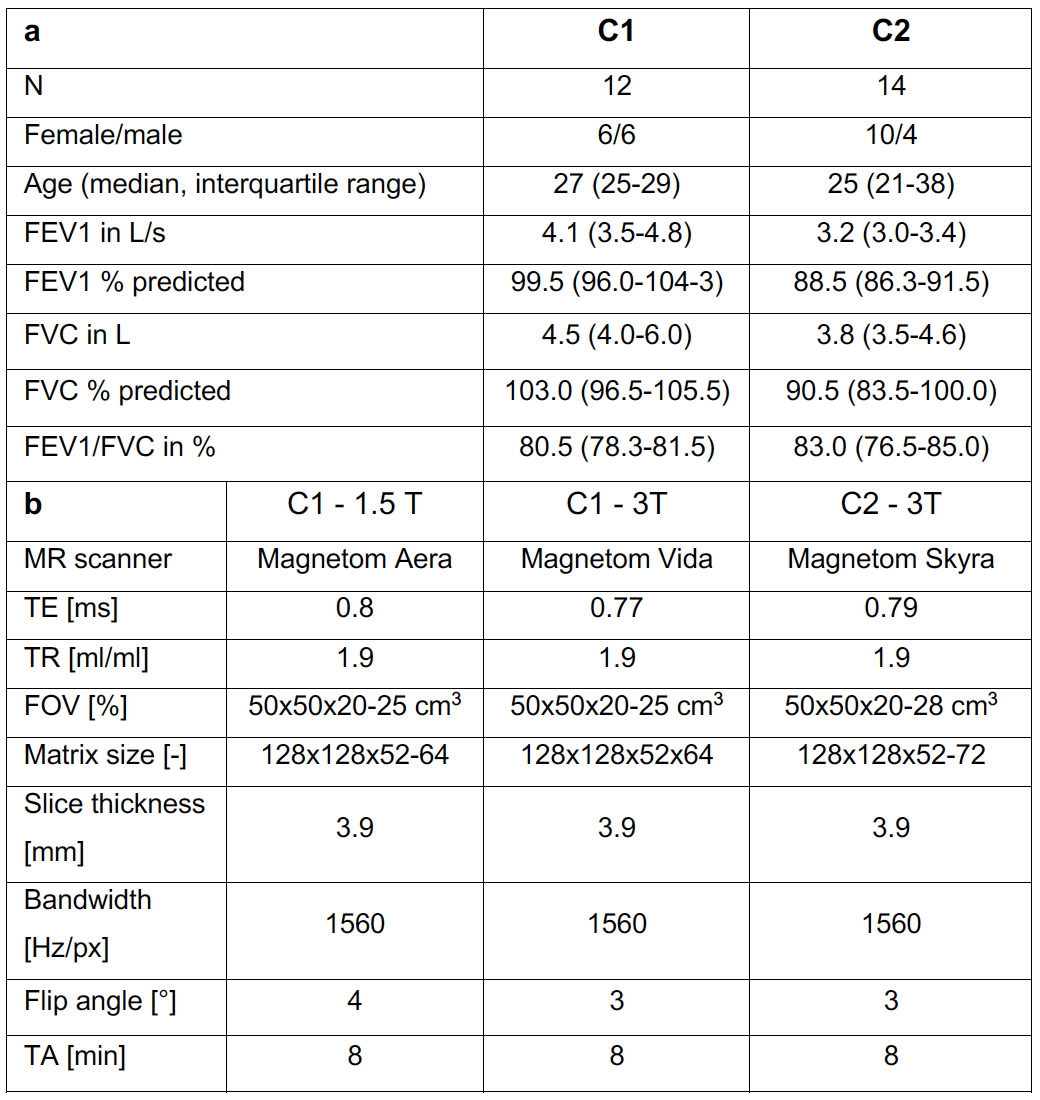
Table 1. Study demographics (a) and MR scanner/sequence parameters (b) for all scanners at both included centers (C1-Center 1, C2 - Center 2).
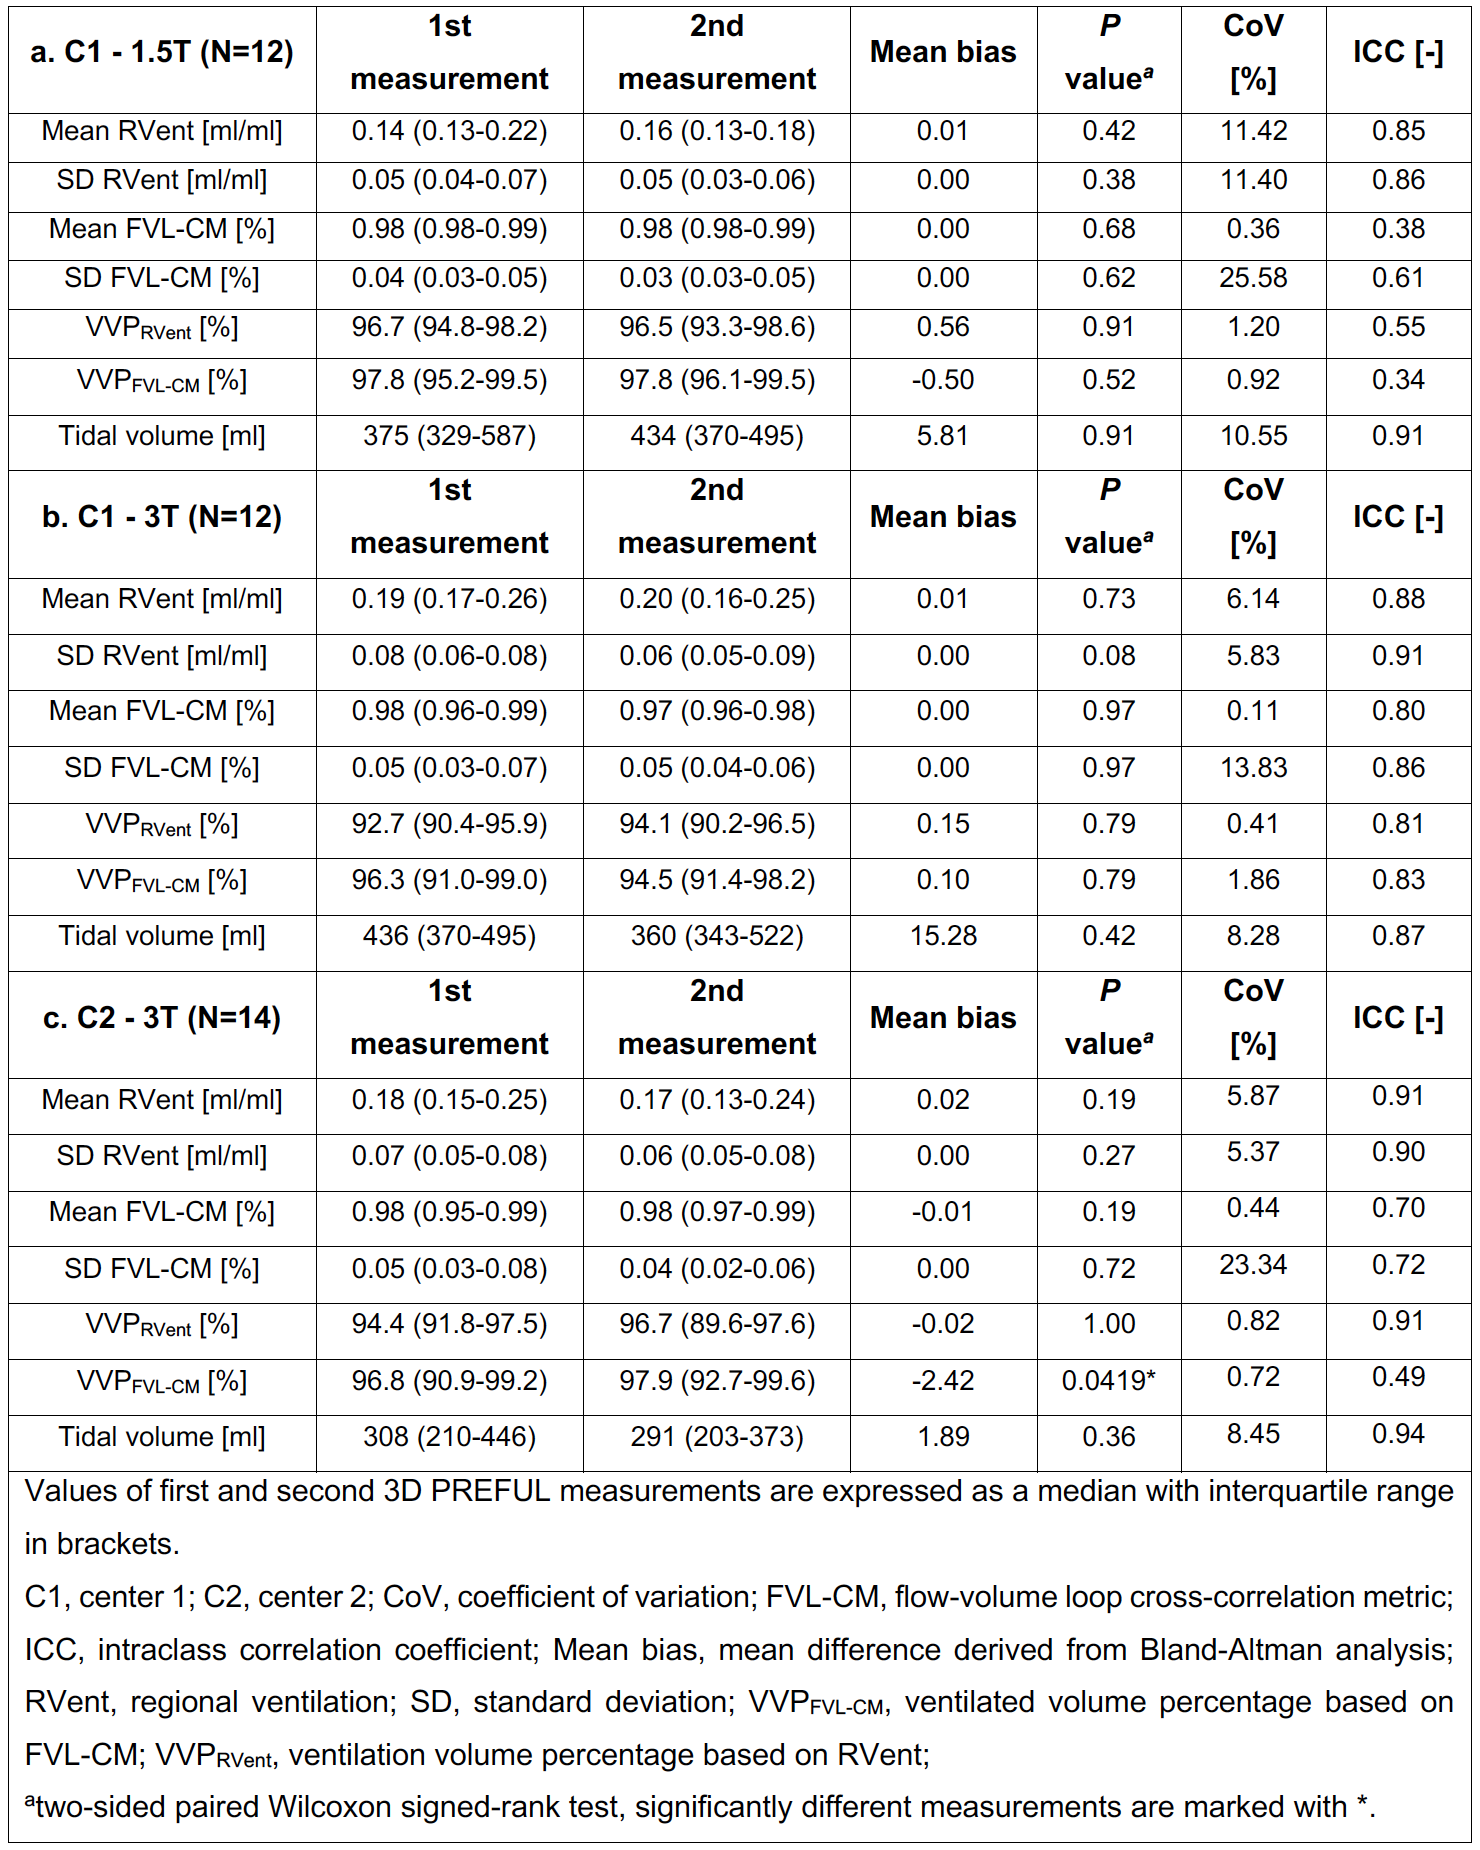
Table 2. Repeatability comparison of 3D PREFUL ventilation parameters derived at both centers.
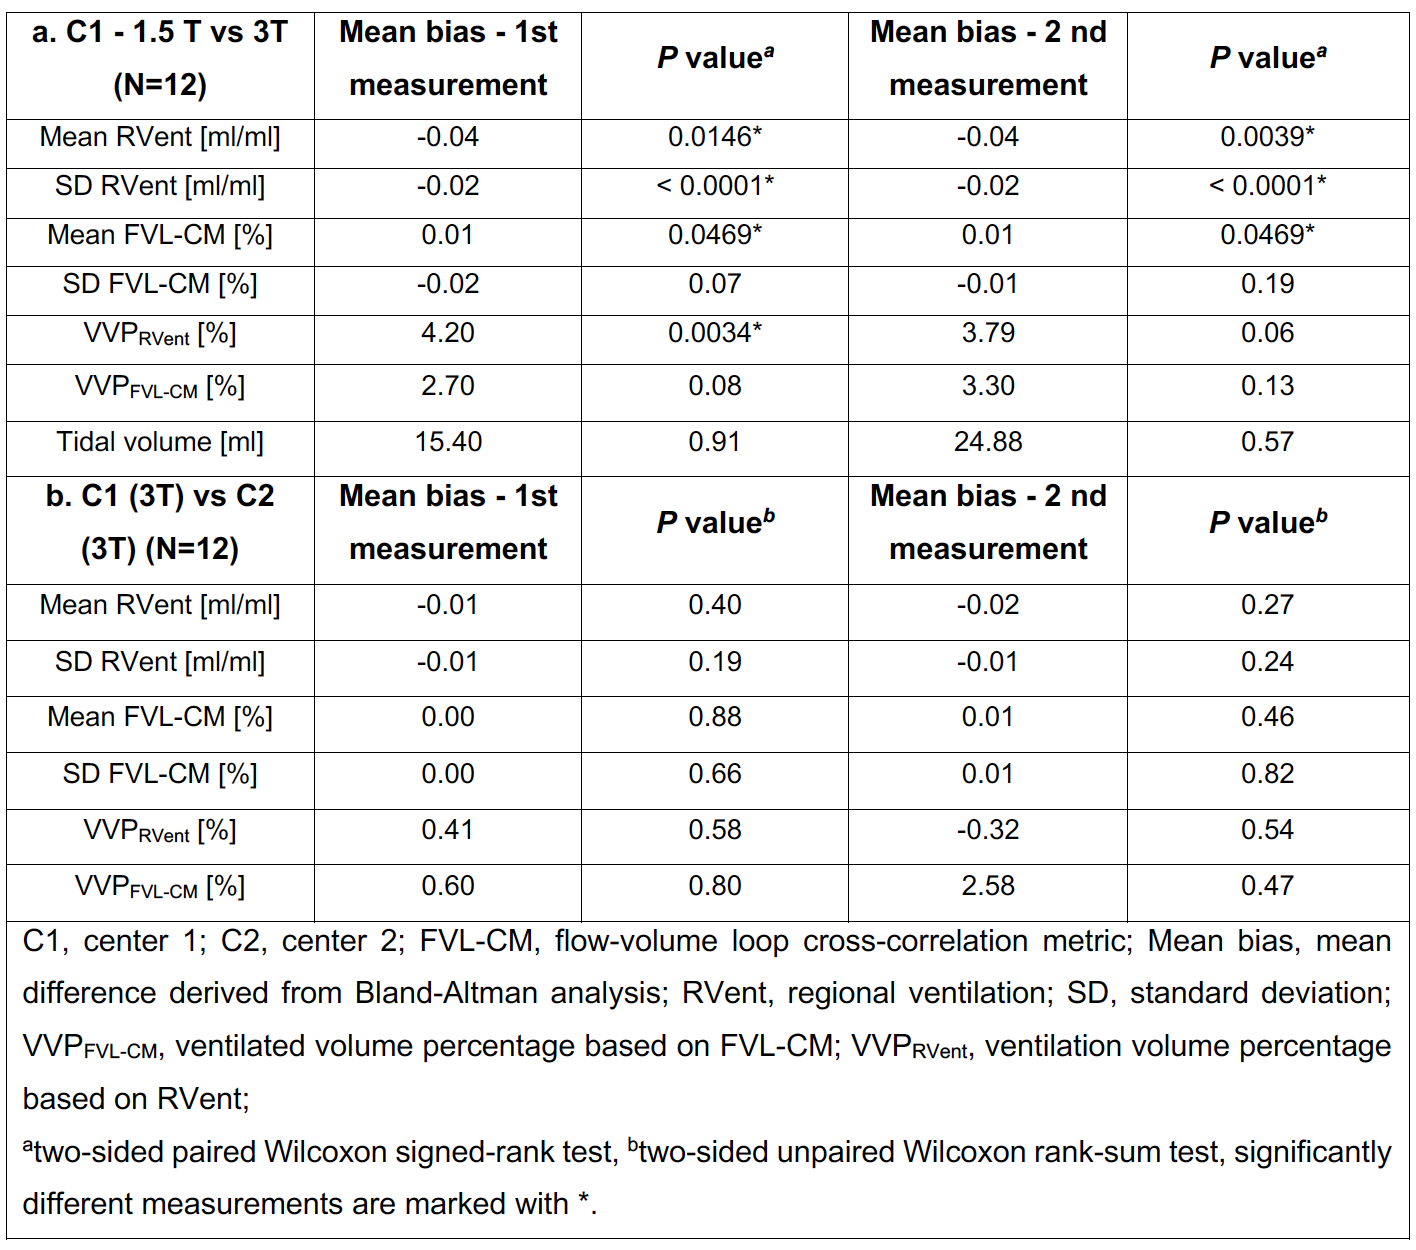
Table 3. Comparison of 3D PREFUL ventilation parameters across different fieldstrength (a) and centers (b). In (b) subjects of both centers were matched in relation to their age.
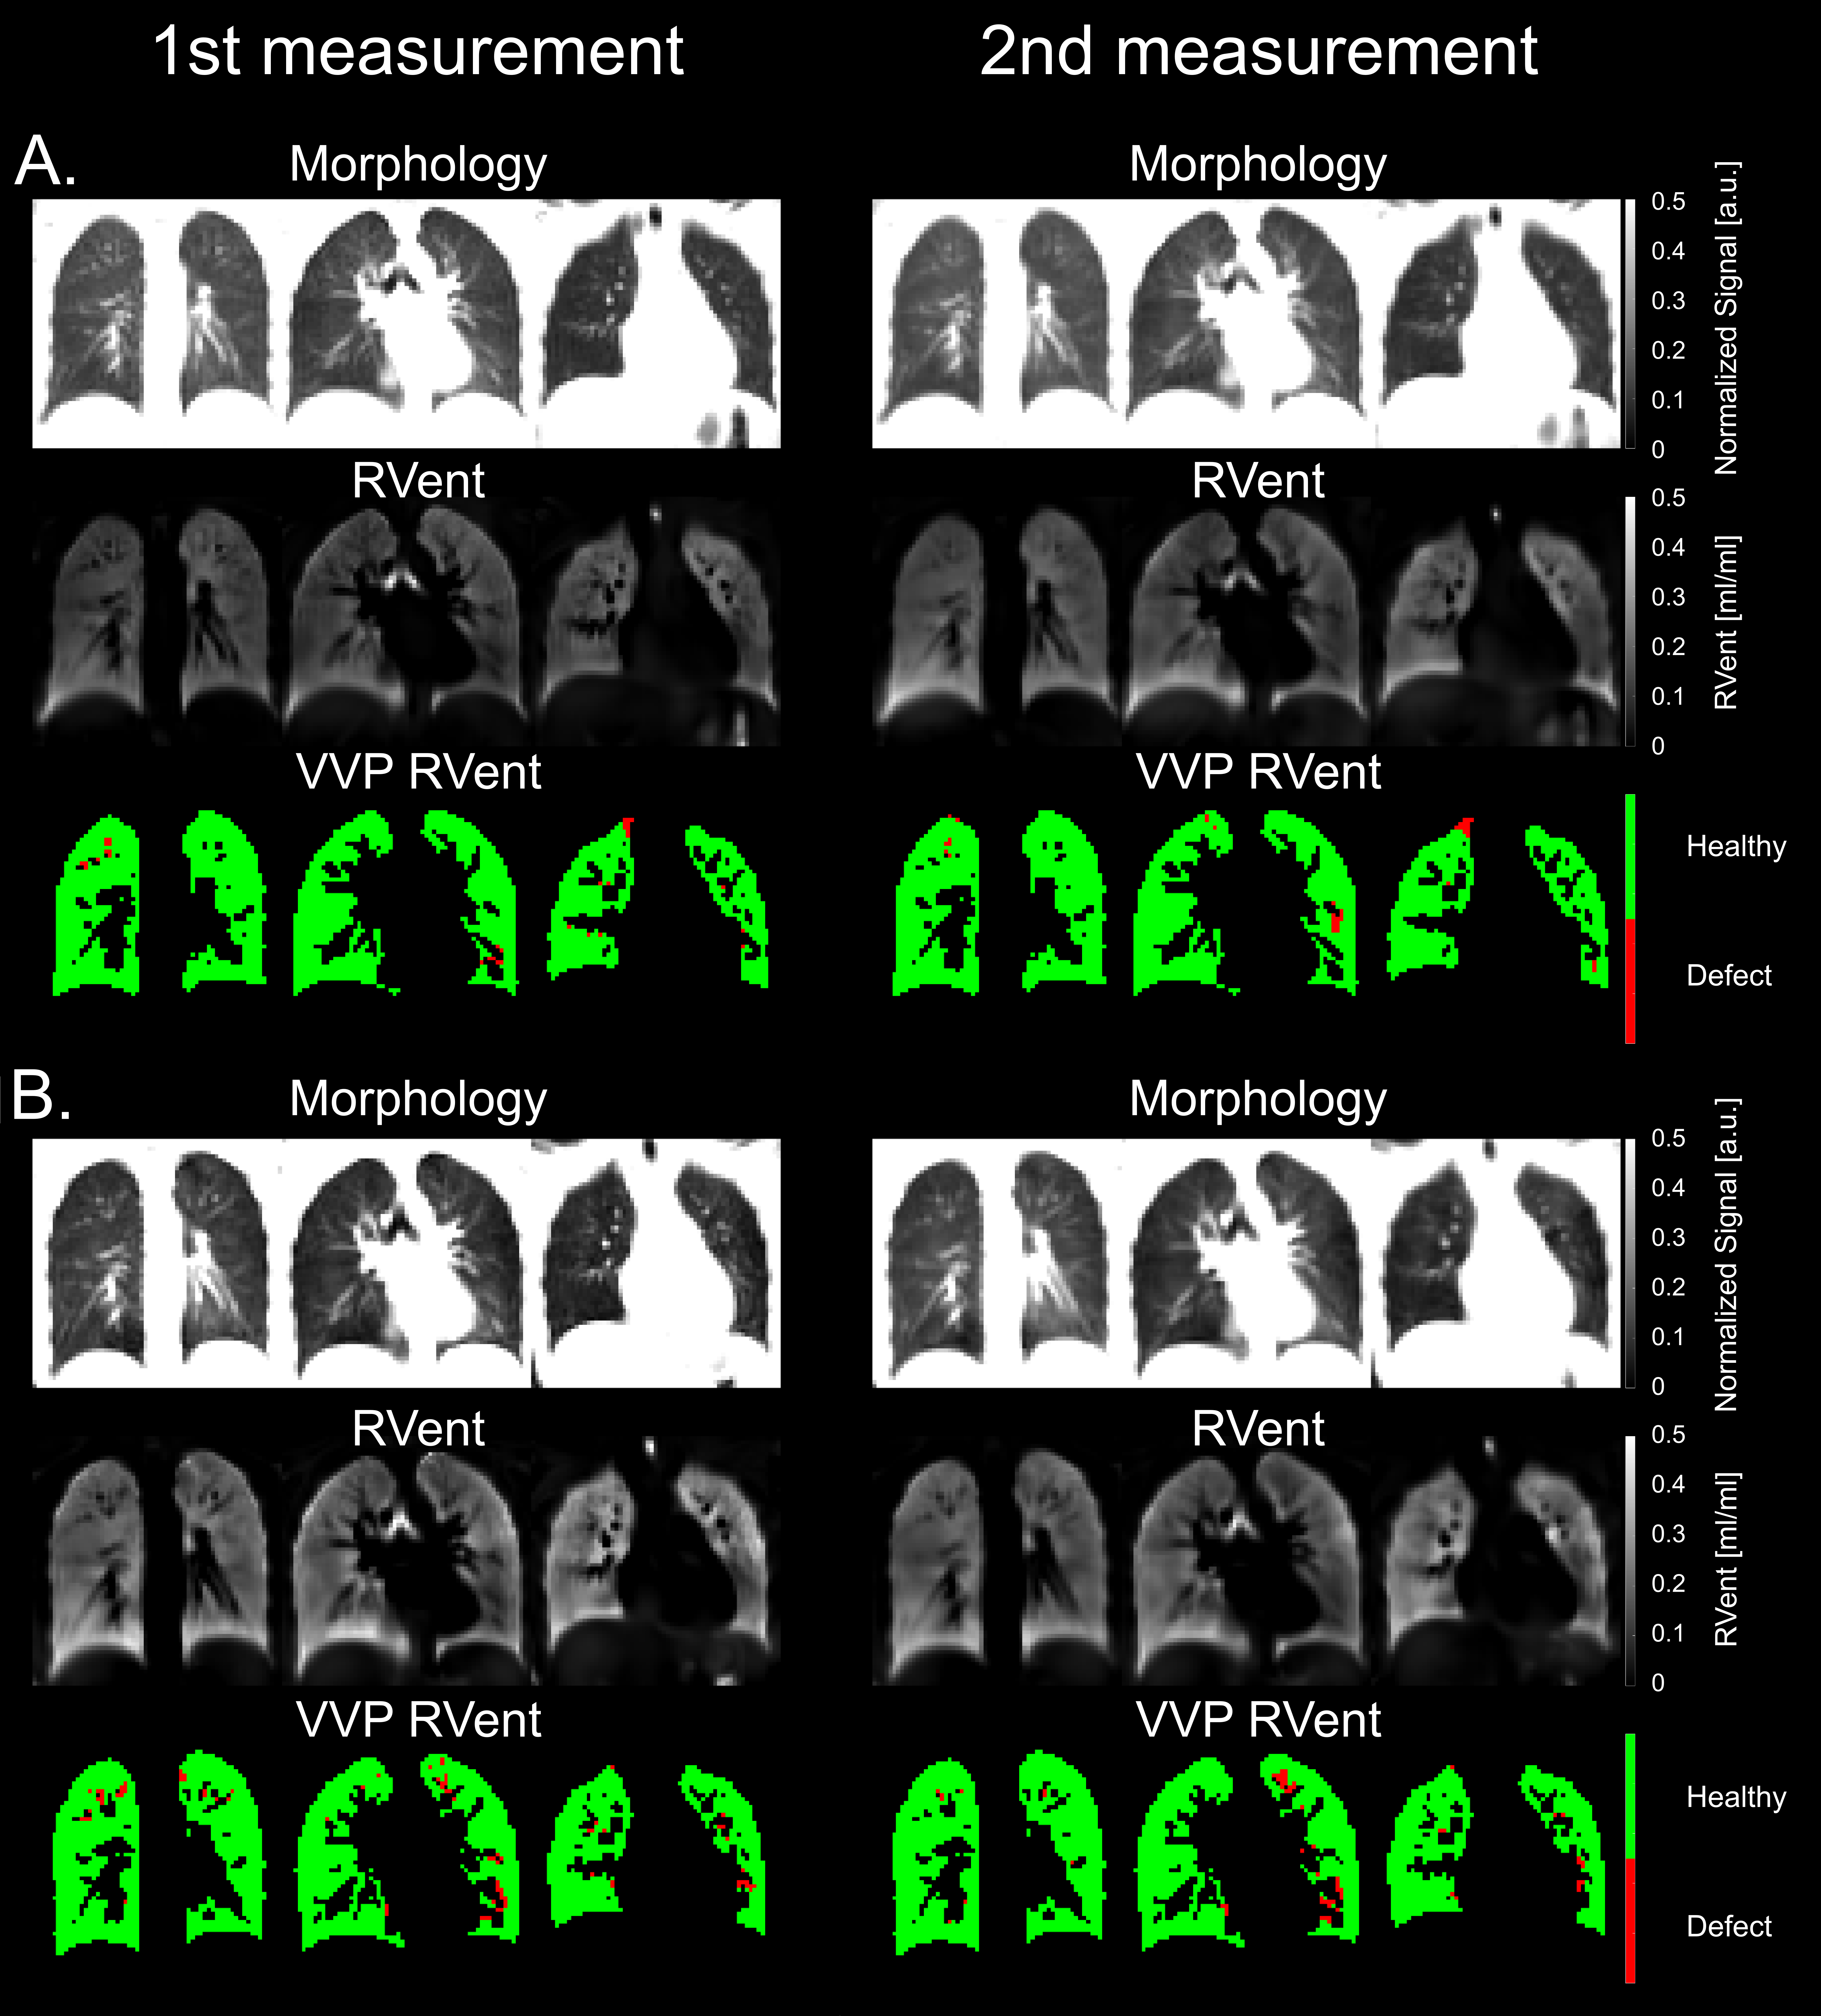
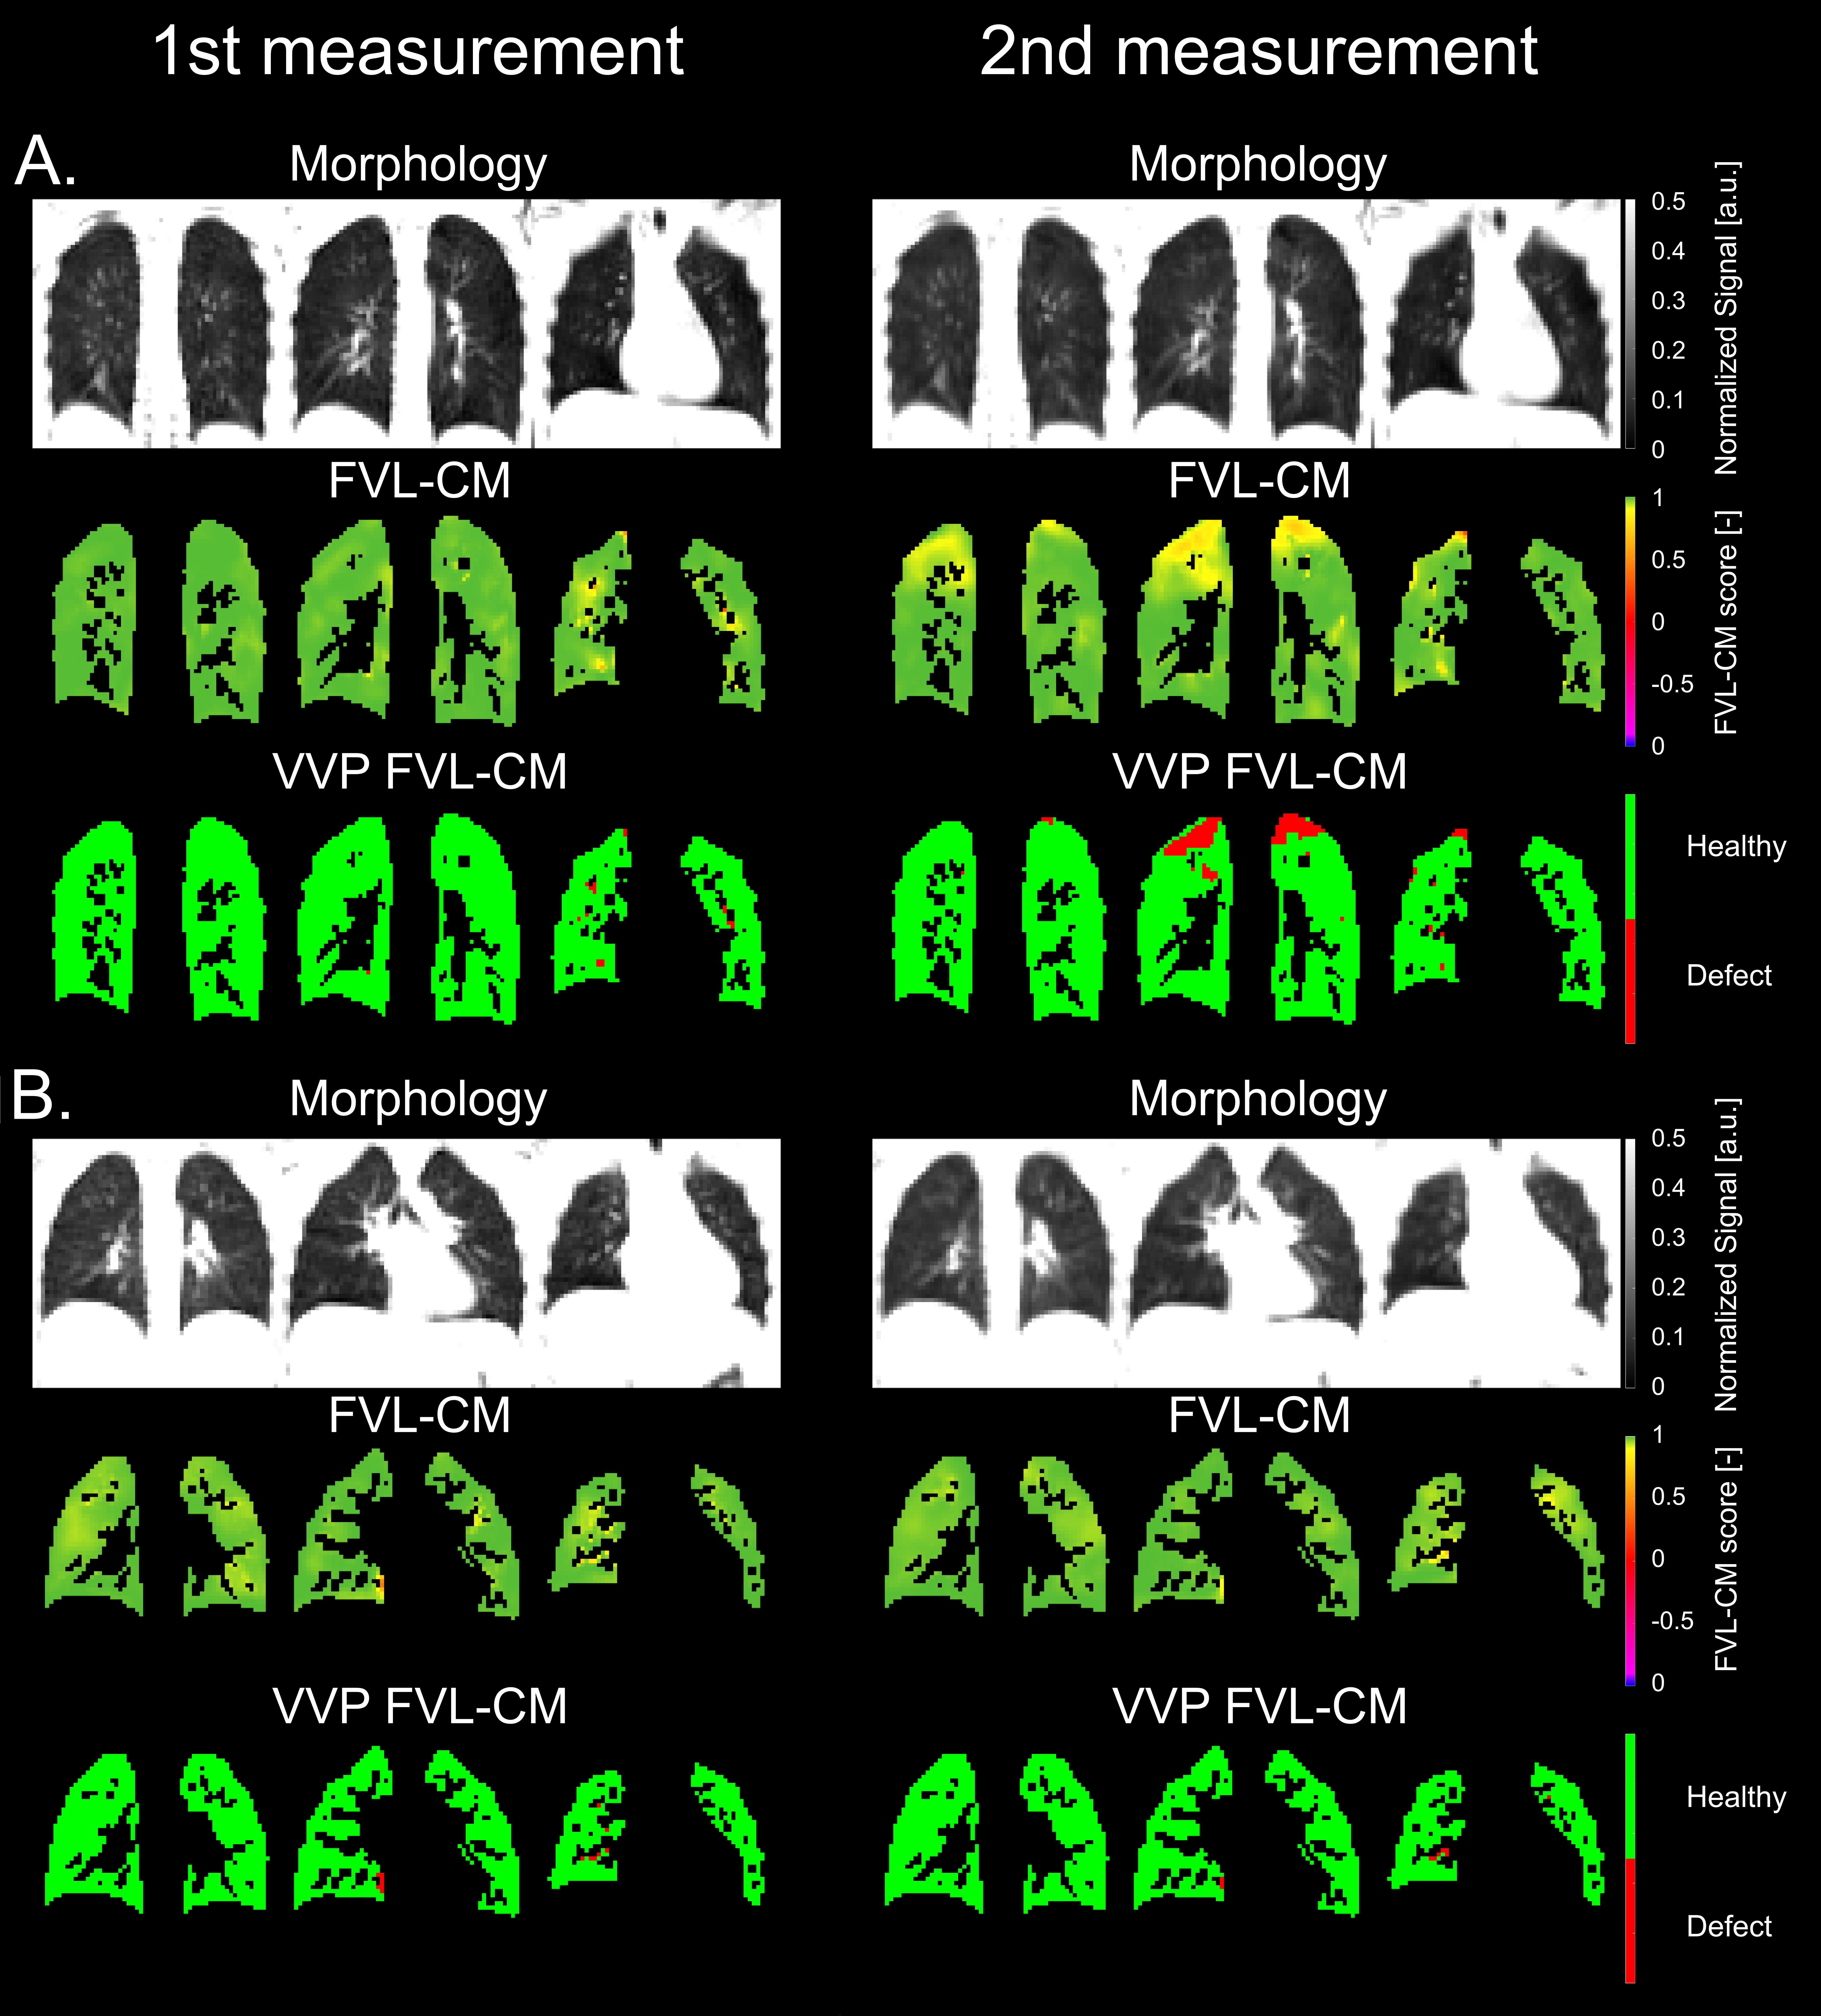
Figure 2: Representative results of the repeated experiment showing morphological, FVL-CM score maps and corresponding ventilation defect maps (A - 3T C1, B - 3T C2) for age-matched volunteers (20/22 years old females, FEV1 = 108/87 % pred. for C1 and C2, respectively). In all 3D PREFUL parameters across both centers, no significant differences were observed.