0058
Application of Voxel-wise Lung Ventilation (VOLVE) Assessment Utilising Cross-Correlation in Chronic Obstructive Pulmonary Disease (COPD)1Sir Peter Mansfield Imaging Centre, University of Nottingham, Nottingham, United Kingdom, 2NIHR Nottingham Biomedical Research Centre (BRC), Respiratory Medicine, School of Medicine, University of Nottingham, Nottingham, United Kingdom
Synopsis
Keywords: Lung, Quantitative Imaging, COPD
Motivation: To develop dynamic ventilation metrics that are robust to breathing behaviour and can identify nonlinear responses of MR signal to lung expansion.
Goal(s): To extend Voxel-wise Lung Ventilation (VOLVE) analysis by incorporating cross-correlation metrics to account for phase shifts between the navigator (global) and lung parenchyma (local) respiratory signal representing delays in ventilation.
Approach: Prospective pilot study using VOLVE analysis incorporating cross-correlation of navigator and lung parenchyma signals.
Results: Significant differences between healthy and COPD groups in the cross-correlation metrics, with both a reduction in amplitude indicating reduced signal linearity and increase in phase shift (lag) indicating delayed ventilation.
Impact: Voxel-wise Lung Ventilation (VOLVE) analysis incorporating cross-correlation and lag enables the distinction between lung regions with delayed ventilation from regions where ventilation signal is static. This additional insight into nonlinear ventilation dynamics will improve understanding of changes in lung function.
Introduction
The proliferation of personalised therapies in respiratory medicine has created the clinical need for new pulmonary diagnostics measuring ventilation and perfusion. Recently we proposed Voxel-wise Lung Ventilation (VOLVE) analysis[1], this provides a measure of ventilation by mapping the correlation coefficient and linear gradient of the proton density signal in lung parenchyma voxels against the lung-diaphragm navigator signal. VOLVE analysis uses the entire timeseries to compute dynamic ventilation metrics that have been shown to improve sensitivity[2]. Here we extend VOLVE analysis to account for phase shifts by incorporating cross-correlation (XCC) metrics.Methods
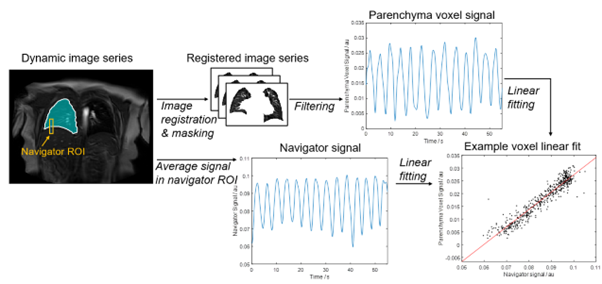
Healthy non-smokers (n=12), healthy smokers (>10 pack-years, no abnormal spirometry, n=4) and people with Chronic Obstructive Pulmonary Disease (COPD) (n=8) were recruited. Data was carried acquired on a 3 T Philips Ingenia scanner during free-breathing using a 2D fast field echo (FFE) sequence (TR/TE=1.9/0.57ms, α=18°, 4.37 images/second). A single coronal slice placed ~1 cm posterior to the heart was imaged, with 512 images collected in 117s. A repeat scan was collected ~15 minutes later.VOLVE image processing[1] was extended to incorporate the cross-correlation (Figure 1). Briefly, a lung-diaphragm navigator signal is determined from an automatic segmented ROI spanning the right hemidiaphragm. Lung parenchyma time courses are determined after non-rigid registration[3] and automatic segmentation[4]. The lung parenchyma signals across the entire time course are compared voxel-wise to the navigator signal, computing VOLVE maps of 1) XCCV and LagV - the maximum XCC and lag at which this cross-correlation occurs, where the lag is expressed as the number of images that need to be shifted to achieve maximal XCC converted to a percentage of the respiratory cycle, and 2) GradV - the gradient of linear regression via York regression[5].
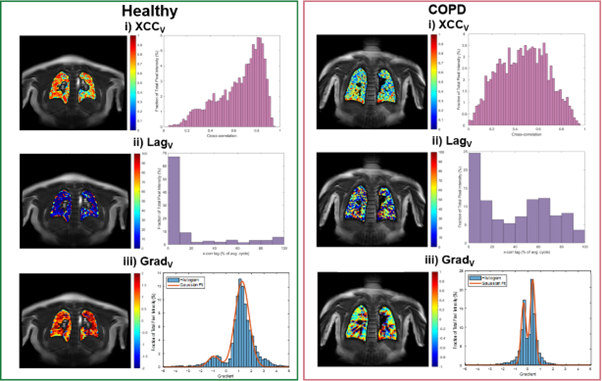
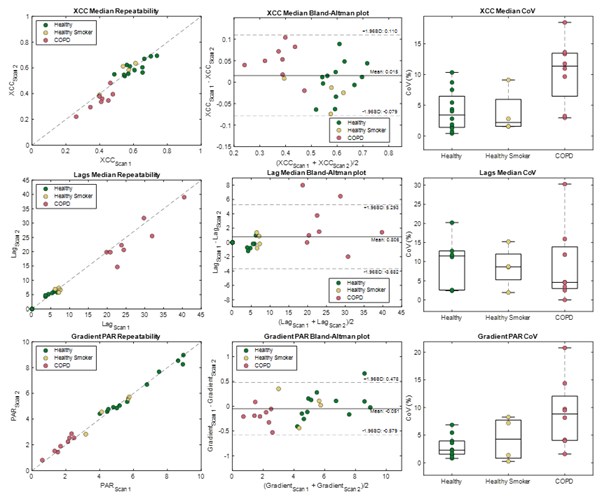
Histograms were created of the XCCV, LagV and GradV maps. Median XCCV and LagV were computed, and the bimodal GradV distribution was fit to a two-component Gaussian mixture model to determine the peak-area-ratio (PAR) (Figure 2). Repeatability was assessed via Bland-Altman analysis and Coefficient of Variation (CoV).
Results
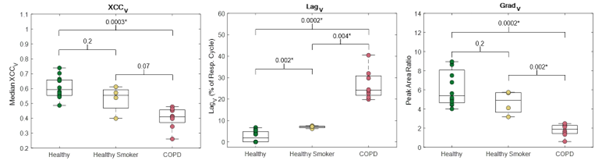
Example VOLVE maps are shown in Figure 2. For the healthy volunteer XCCV values are generally >0.4 and negatively skewed (skewness=-0.78) , whereas for COPD the XCCV is lower and more normally distributed (skewness=-0.02). The LagV map shows that compared to the healthy volunteer, in COPD many voxels are out of phase with a delay (between 40% - 70% of respiratory cycle). The histogram of the GradV map for the COPD participant shows a compressed distribution, with a higher proportion of zero values and an enlarged secondary/negative peak in comparison to the healthy volunteer.Figure 3 shows boxplots of the VOLVE parameters for each group. A significant difference is seen between the COPD group and both healthy groups for LagV and GradV metrics, and between COPD and healthy never-smokers for VOLVEXCC. LagV was also significantly different between the healthy groups.
Figure 4 shows the within-visit repeatability of the XCCV, LagV and GradV metrics. Bland-Altman analysis showed a mean difference of 0.015 (95% confidence interval (CI): ±0.095), 0.806 (95% CI: ±4.49) and -0.051 (95% CI: ±0.529), respectively. The median CoV values across the groups were 4.2%, 8.6% and 3.9%, respectively.
Discussion
We observed a significant reduction in the XCCV in COPD patients compared to a group of healthy never-smokers, indicating that the linearity of the signal response to lung expansion is reduced in COPD. The significantly longer LagV observed in healthy smokers and COPD indicates the presence of delayed ventilation of some regions. The increased negative peak in the Gradv histogram in COPD indicates more areas with signal increase (rather than the expected decrease) on inspiration possibly indicating collateral ventilation.Repeatability was good, although LagV was notably more variable in COPD. This may be due to the multiple peaks of the lag distribution being poorly characterised by the median. Further, the need to maintain a supine position and compression of the thorax by the MRI chest coil during scanning could lead to progressive dynamic hyperinflation.
We previously observed a significant difference in the VOLVE Pearson correlation coefficient (CC) between the groups[1], but were unable to distinguish between voxels with poor correlation due to a lag and those due to lack of linear response. The use of XCC and lag metrics addresses this and provides improved understanding of the negative CC values previously observed in COPD. Further work is needed to characterise nonlinear voxels more accurately.
Conclusion
VOLVE with cross correlation analysis provides XCCV, LagV and GradV metrics for improved understanding of changes in lung function.Acknowledgements
No acknowledgement found.References
1. Peggs et al. Functional Pulmonary Proton MRI: Voxel-wise Linear-fitting Ventilation (VOLVE) Assessment in Chronic Obstructive Pulmonary Disease (COPD) [abstract]. In: Proceedings of the 32nd Joint Annual Meeting of the ISMRM-ESMRMB & ISMRT; 2023 June 3-8; Toronto, CA. Abstract # 4662.
2. Alsady et al. MRI-derived regional flow-volume loop parameters detect early-stage chronic lung allograft dysfunction. Journal of Magnetic Resonance Imaging, vol. 50, no. 6, pp. 1873-1882 (2019)
3. Vercauteren et al. Diffeomorphic demons: Efficient non-parametric image registration. Neuroimage, vol. 45, no.1, pp. 61–72. (2009)
4. Kirby et al. Hyperpolarized 3He Magnetic Resonance Functional Imaging Semiautomated Segmentation. Academic Radiology, vol. 19, no. 2, pp141–152 (2012)
5. York et al. Unified Equations for the Slope, Intercept, and Standard Errors of the Best Straight Line. American Journal of Physics, vol. 72, no. 3, pp. 367 (2004).
Figures