0057
Regional ventilation measured by 3D phase-resolved functional lung MRI improves after dual bronchodilator treatment in patients with COPD1Institute of Diagnostic and Interventional Radiology, Hannover Medical School, Hannover, Germany, 2Biomedical Research in Endstage and Obstructive Lung Disease Hannover (BREATH), German Center for Lung Research (DZL), Hannover, Germany, 3MR Application Predevelopment, Siemens Healthineers AG, Erlangen, Germany, 4Department of Clinical Airway Research, Franhofer Institute for Toxicology and Experimental Medicine, Hannover, Germany, 5Department of Respiratory Medicine, Hannover Medical School, Hannover, Germany
Synopsis
Keywords: Lung, Lung, COPD, Dual bronchodilator, treatment
Motivation: Bronchodilators relieve the symptoms of respiratory conditions, such as chronic obstructive lung disease (COPD). 3D PREFUL MRI offers a non-invasive assessment of pulmonary ventilation. It is unclear whether 3D PREFUL parameters are sensitive to ventilation changes induced by bronchodilators.
Goal(s): To determine whether 3D PREFUL parameters enable to measure response to dual bronchodilator therapy in COPD.
Approach: 3D PREFUL MRI and spirometry at baseline and 2 weeks after initiation of therapy.
Results: Ventilation assessed by 3D PREFUL parameters significantly improved by bronchodilator therapy. Relative changes of 3D PREFUL ventilation defect percentage parameters were similar to relative change differences of FEV1.
Impact: 3D PREFUL MRI derived ventilation maps show significantly reduced ventilation defects in COPD patients after bronchodilator therapy. This positions 3D PREFUL MRI as a promising candidate for non-invasive monitoring of regional ventilation changes in future clinical studies.
Introduction
A combination of a long-acting ß2-agonist (LABA) and a long-acting muscarinic antagonist (LAMA) is well established treatment in chronic obstructive lung disease (COPD) and known to improve cardiopulmonary function1–3. However, limited evidence exists regarding LABA/LAMA treatment with olodaterol/tiotropium (OLO/TIO) and its impact on pulmonary ventilation derived by MRI. 3D phase-resolved functional lung (PREFUL) MRI is a contrast agent-free technique, which enables quantitative assessment of pulmonary ventilation under free breathing condition4. 3D PREFUL ventilation surrogates have been shown to correlate well with pulmonary function test (PFT) measurements and have demonstrated a good interscan repeatability in healthy volunteers and COPD patients5. Currently, it is unclear whether 3D PREFUL parameters are sensitive to changes induced by OLO/TIO therapy. This study aims to investigate if the ventilation parameters derived by 3D PREFUL enable to measure response to OLO/TIO therapy by comparison to PFT outcomes in COPD patients.Methods
27 COPD patients (14 female, age range: 40-73 years) underwent MRI at 1.5T (MAGNETOM Avanto, Siemens Healthineers, Erlangen, Germany) and PFT at baseline and 2 weeks after OLO/TIO therapy. An eight-minute 3D PREFUL MRI measurement4 based on a research pulse sequence and reconstruction was used to assess regional ventilation of the whole lung volume. Following sequence parameters were used for the stack-of stars acquisition with golden-angle increment: TE 0.81 ms, TR 1.9 ms, flip angle 3.5°, FOV 50 x 50 cm2, matrix size 128 x 128 interpolated to 256 x 256, 56-80 partitions, 6/8 partial Fourier along the partition dimension, pixel bandwidth 1500 Hz/pixel, slice thickness of 3.9 mm interpolated to 1.95 mm.Dynamic images resolving the respiratory cycle were registered towards end-inspiration image using the Forsberg toolbox6. Additionally, the follow-up 3D PREFUL measurement and the baseline measurement were coregistered. Using 3D PREFUL, ventilation defect (VD) maps derived from static regional ventilation (RVent)7 and dynamic flow-volume loop cross-correlation metric (FVL-CM)8 maps based on previously published thresholds were calculated for the baseline and follow-up scan 9,10. The treatment response maps (TRMs)11 were calculated by subtracting the VD map after therapy from the baseline VD map. Post-treatment improved ventilation volumes (IVVRVent and IVVFVL-CM) were determined by multiplying the number of voxels that exhibited positive changes in TRMs (representing the absolute count of ventilation defect voxels at baseline that resolved after OLO/TIO therapy in the follow-up measurement) by the lung volume in milliliters.
Absolute and relative changes were calculated for all MRI and PFT parameters. Differences between baseline and follow-up measurement were tested for significance using a paired Wilcoxon signed rank test. Post-treatment agreement between 3D PREFUL parameters and forced expiratory volume in one second (FEV1) was evaluated using Spearman correlation (r).
Results
Representative 3D PREFUL ventilation parameter maps at baseline and post OLO/TIO treatment are depicted in Figure 1.Therapy with OLO/TIO significantly improved all ventilation parameters derived by 3D PREFUL (all P < 0.0019, Table 1, Figure 2), excluding global mean RVent and standard deviation (SD) FVL-CM parameters.
The absolute and relative changes of 3D PREFUL parameters were not significantly correlated with changes in FEV1. The median values for improved ventilated volume were 392 (320-527) ml IVVRVent and 451 (280-682) ml for IVVFVL-CM, respectively.
In post-treatment analysis, 3D PREFUL derived values were significantly correlated to FEV1 (all r ≥ |0.42|, all P < 0.0284, Table 2), except mean and SD RVent parameters. Figure 3 shows exemplary TRMs for two study participants.
Discussion
3D PREFUL MRI derived VDP values were significantly reduced (21-24%) after OLO/TIO therapy.No significant correlations were observed in comparison of absolute and relative changes of 3D PREFUL and PFT parameters. This finding suggests that a more in-depth correlation with other spirometry outcomes should be investigated.
The median improvement in ventilated volumes, determined from TRMs of 390-450 ml is slightly less than the reported hyperinflation reduction of 750 ml observed in 56 COPD subjects after dual bronchodilation measured by PFT1. Beyond variations in study design, population characteristics, and medication, the observed difference could be attributed to variations in breathing maneuvers during the PFT and MRI examinations (forced vital capacity maneuver vs free-braething). Also, certain improvements in TRM calculation may be crucial before implementing 3D PREFUL in a clinical routine.
The significant correlations in post-treatment analysis with FEV1 suggest that 3D PREFUL MRI is sensitive to lung parenchyma ventilation changes induced by OLO/TIO therapy.
Conclusion
3D PREFUL ventilation MRI is a promising tool to monitor regional dynamic ventilation changes in COPD patients after OLO/TIO therapy.Acknowledgements
This work was funded by the German Center for Lung Research (DZL). The authors would like to express their gratitude to the radiographers Melanie Pfeifer, Frank Schröder and Svent Thiele from the Department of Radiology for their support with the MR measurements and patient care.References
1. Hohlfeld JM, Vogel-Claussen J, Biller H, et al. Effect of lung deflation with indacaterol plus glycopyrronium on ventricular filling in patients with hyperinflation and COPD (CLAIM): a double-blind, randomised, crossover, placebo-controlled, single-centre trial. Lancet Respir Med. 2018;6(5):368-378. doi:10.1016/S2213-2600(18)30054-7
2. Mummy DG, Coleman EM, Wang Z, et al. Regional Gas Exchange Measured by 129Xe Magnetic Resonance Imaging Before and After Combination Bronchodilators Treatment in Chronic Obstructive Pulmonary Disease. J Magn Reson Imaging. 2021;54(3):964-974. doi:10.1002/jmri.27662
3. Voskrebenzev A, Kaireit TF, Klimeš F, et al. PREFUL MRI Depicts Dual Bronchodilator Changes in COPD: A Retrospective Analysis of a Randomized Controlled Trial. Radiol Cardiothorac Imaging. 2022;4(2). doi:10.1148/ryct.210147
4. Klimeš F, Voskrebenzev A, Gutberlet M, et al. 3D phase‐resolved functional lung ventilation MR imaging in healthy volunteers and patients with chronic pulmonary disease. Magn Reson Med. 2021;85(2):912-925. doi:10.1002/mrm.28482
5. Klimeš F, Voskrebenzev A, Gutberlet M, et al. Repeatability of dynamic 3D phase-resolved functional lung (PREFUL) ventilation MR Imaging in patients with chronic obstructive pulmonary disease and healthy volunteers. J Magn Reson Imaging. 2021;54(2):618-629. doi:10.1002/jmri.27543
6. Forsberg D. fordanic/image-registration (https://github.com/fordanic/image-registration), GitHub. Retrieved September 8, 2021.
7. Klimeš F, Voskrebenzev A, Gutberlet M, et al. Free‐breathing quantification of regional ventilation derived by phase‐resolved functional lung (PREFUL) MRI. NMR Biomed. 2019;(February):e4088. doi:10.1002/nbm.4088
8. Voskrebenzev A, Gutberlet M, Klimeš F, et al. Feasibility of quantitative regional ventilation and perfusion mapping with phase-resolved functional lung (PREFUL) MRI in healthy volunteers and COPD, CTEPH, and CF patients. Magn Reson Med. 2018;79(4):2306-2314. doi:10.1002/mrm.26893
9. Pöhler GH, Löffler F, Klimeš F, et al. Validation of Phase-Resolved Functional Lung (PREFUL) Magnetic Resonance Imaging Pulse Wave Transit Time in Healthy Subjects and Chronic Obstructive Pulmonary Disease. J Magn Reson Imaging. 2021:1-11. doi:10.1002/jmri.28016
10. Moher Alsady T, Voskrebenzev A, Greer M, et al. MRI‐derived regional flow‐volume loop parameters detect early‐stage chronic lung allograft dysfunction. J Magn Reson Imaging. 2019;50(6):1873-1882. doi:10.1002/jmri.26799
11. Horn FC, Marshall H, Collier GJ, et al. Regional ventilation changes in the lung: Treatment response mapping by using hyperpolarized gas MR imaging as a quantitative biomarker. Radiology. 2017;284(3):854-861. doi:10.1148/radiol.2017160532
Figures
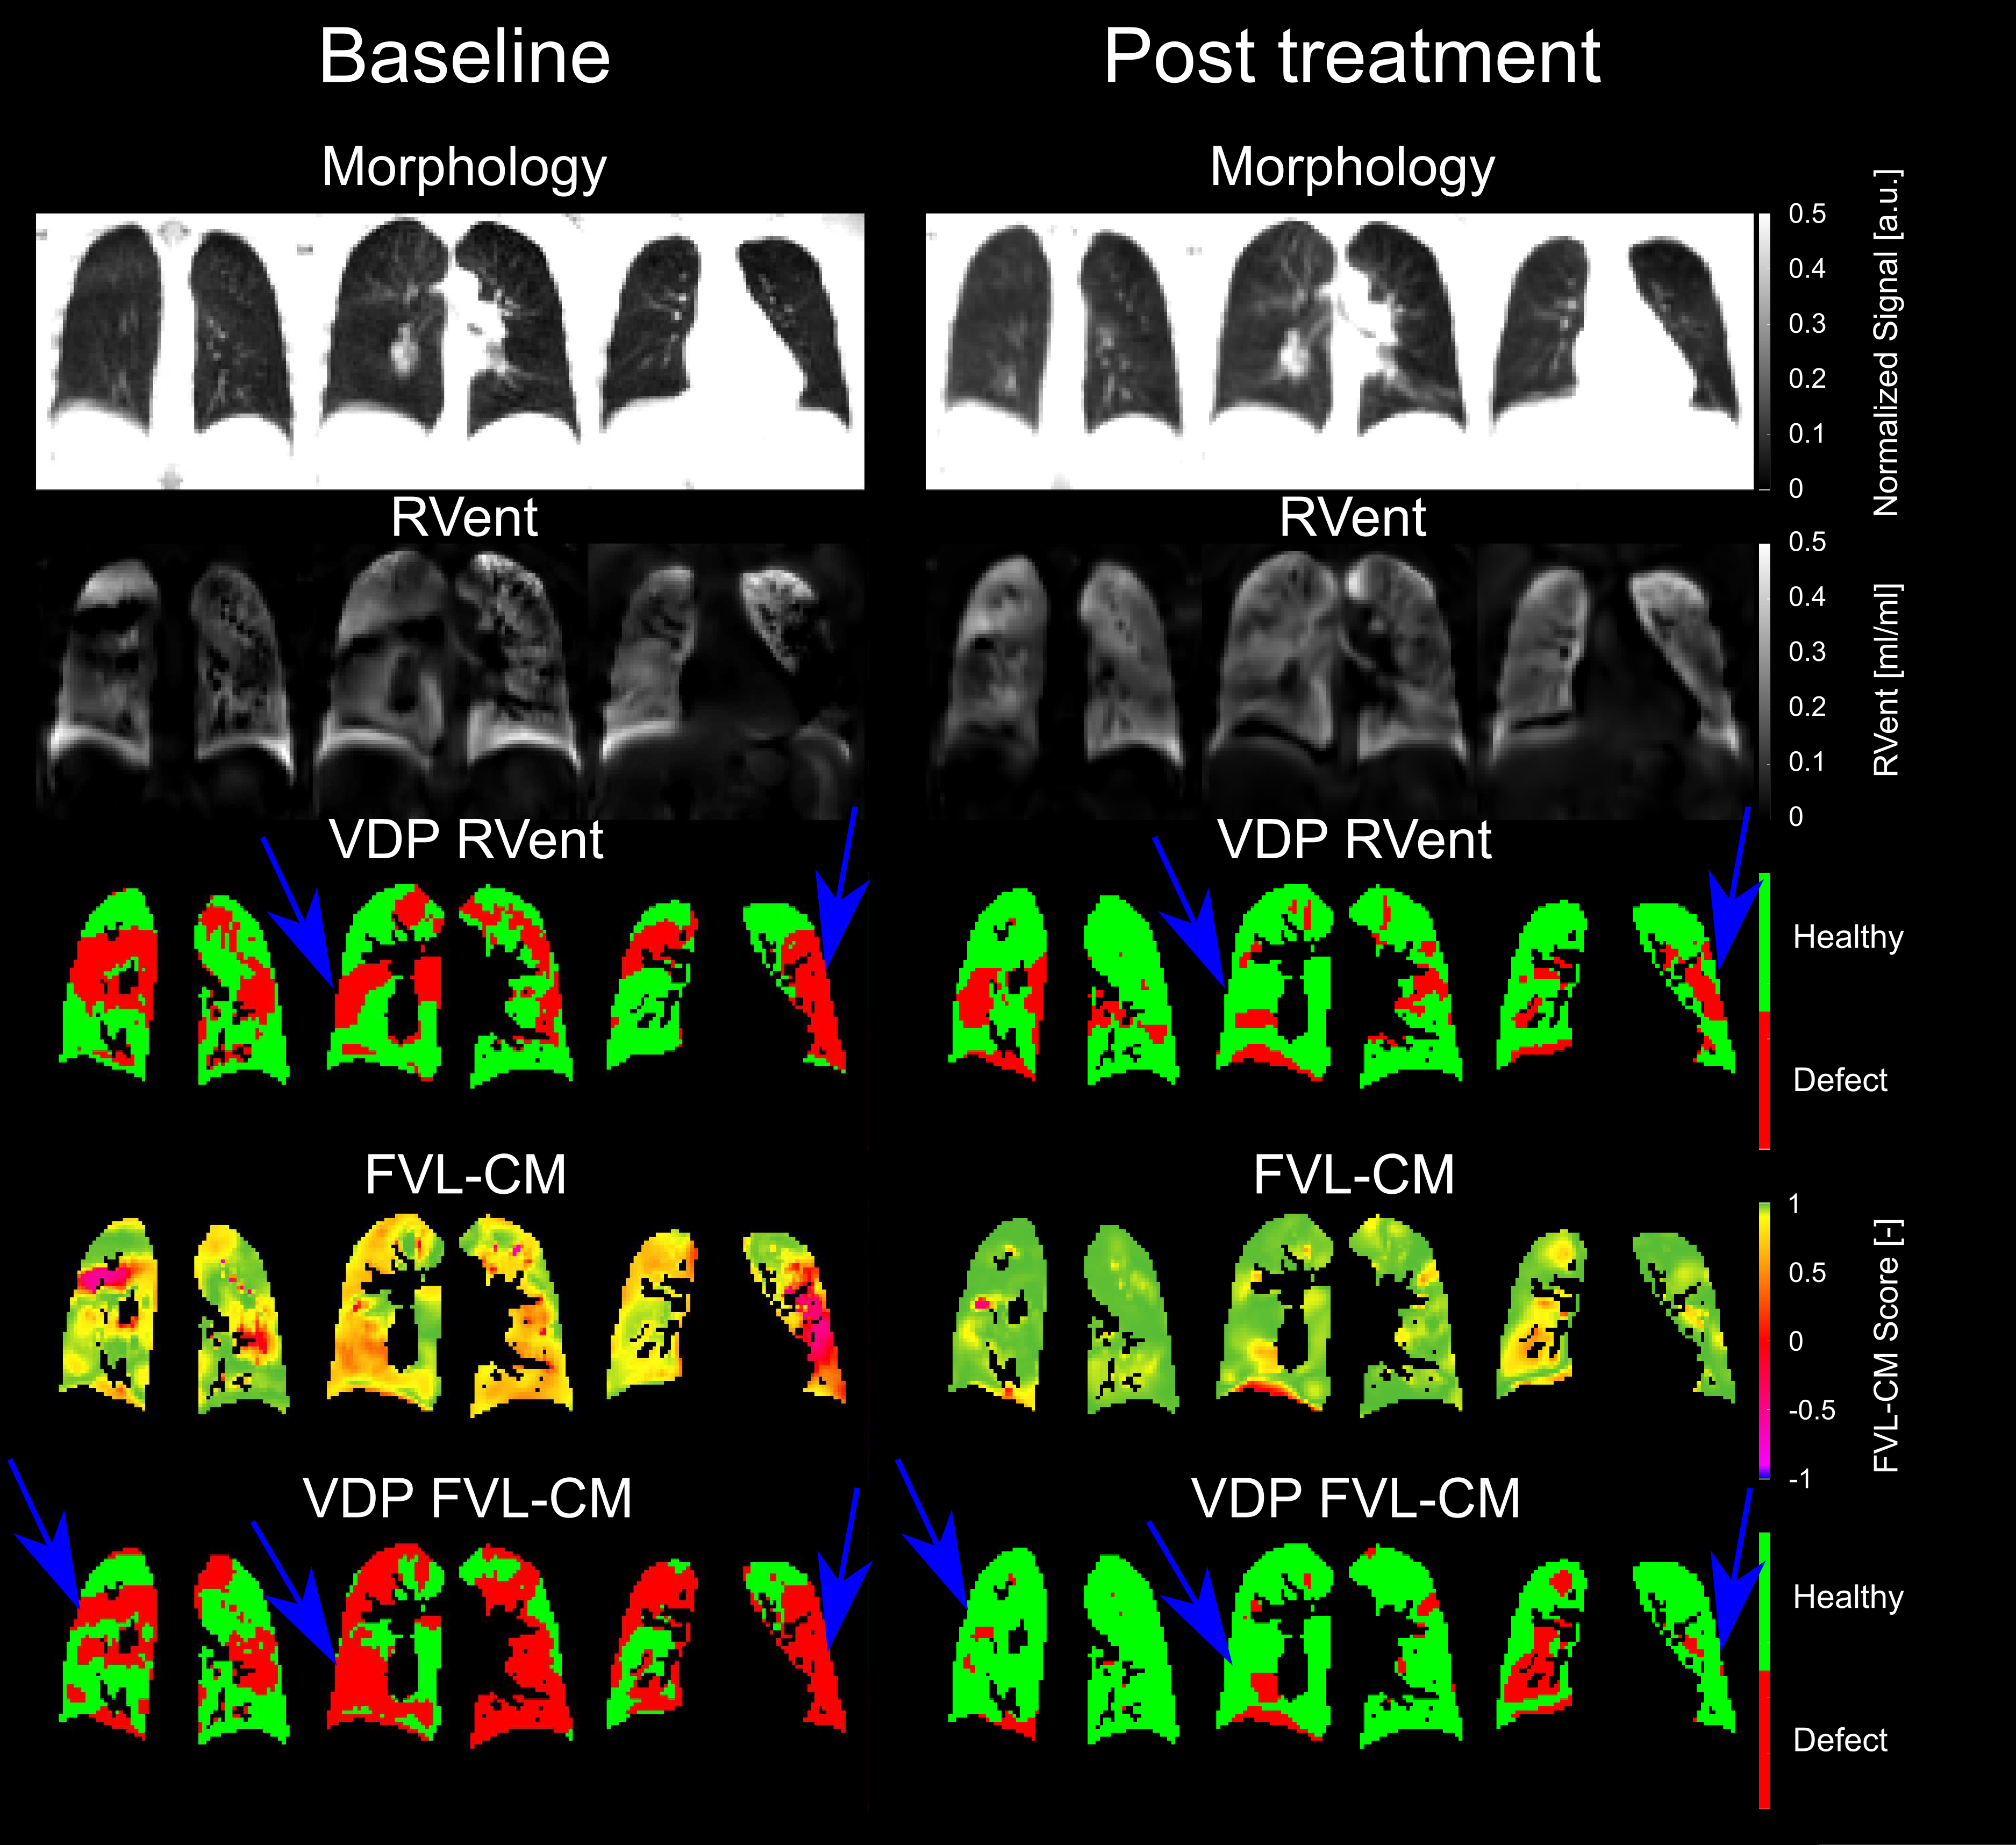
Figure 1. Exemplary ventilation marker maps of baseline (left) and post treatment (right) 3D PREFUL measurements of 60-year-old female COPD patient. VDPRVent decreased from 36.0% (baseline) to 18.9% (post treatment). VDPFVL-CM decreased from 41.0% (baseline) to 11.2% (post treatment). At baseline, the FEV1 was 0.86 l/s, corresponding to an FEV1 % predicted of 34%. After treatment, the FEV1 increased to 1.31 l/s, corresponding to an FEV1 % predicted of 54%.
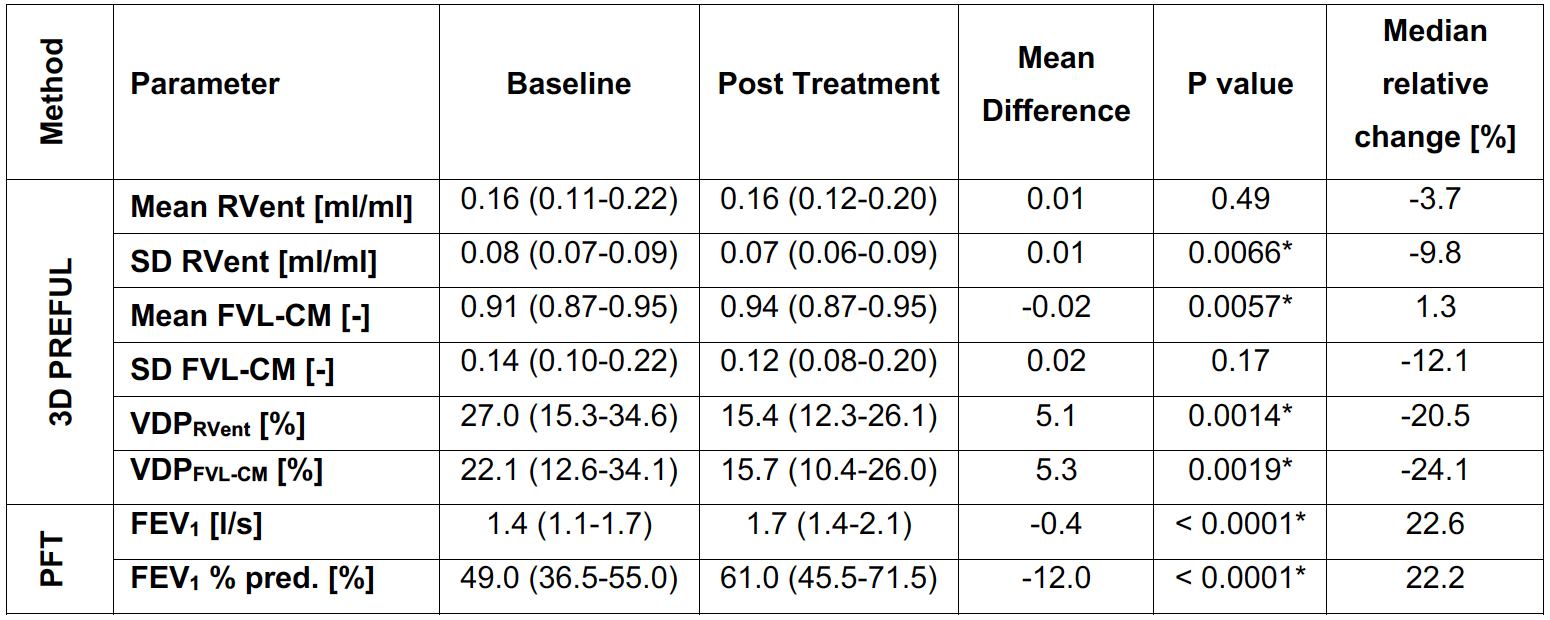
Table 1. Analysis of 3D PREFUL and PFT outcomes in response to OLO/TIO therapy. Baseline and post treatment ventilation values are expressed as a median with interquartile range in brackets. Statistically significant results are marked with *.
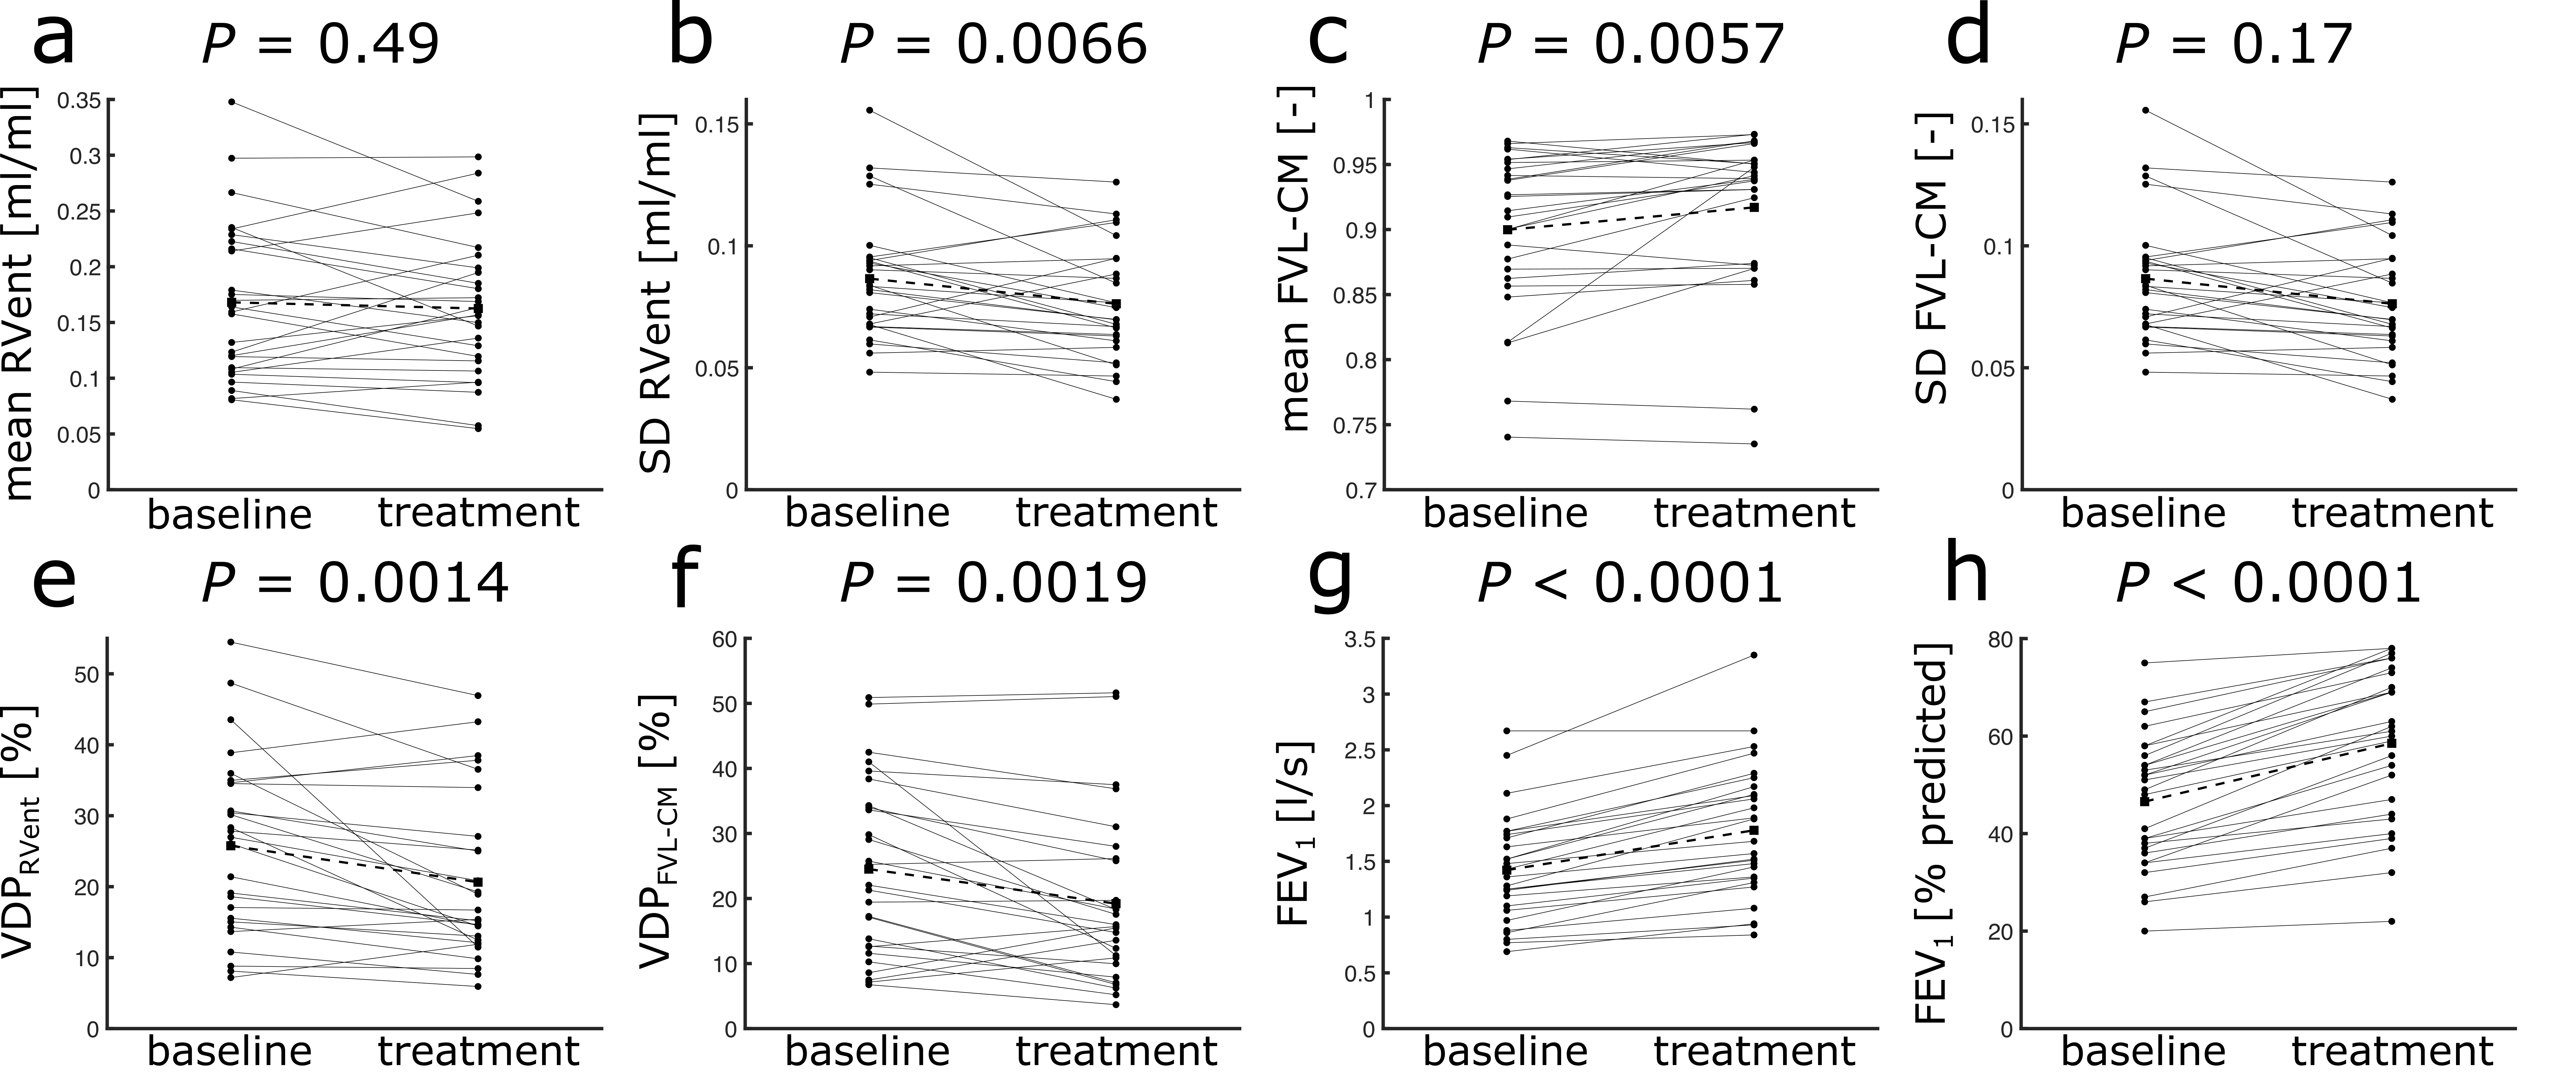
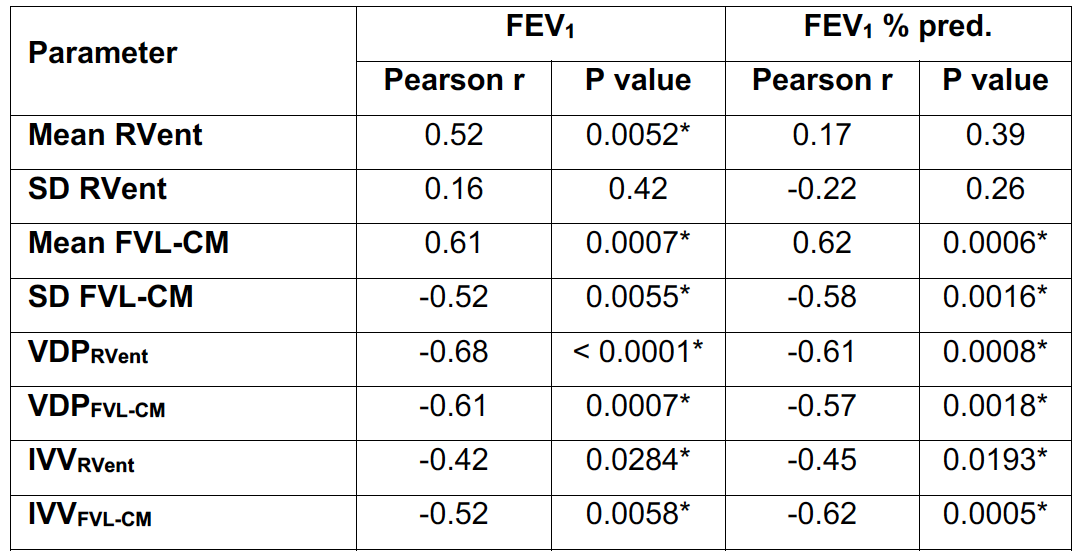
Table 2. Post treatment Spearman correlation analysis of 3D PREFUL ventilation parameters to spirometry outcomes. Statistically significant correlations are marked with *.
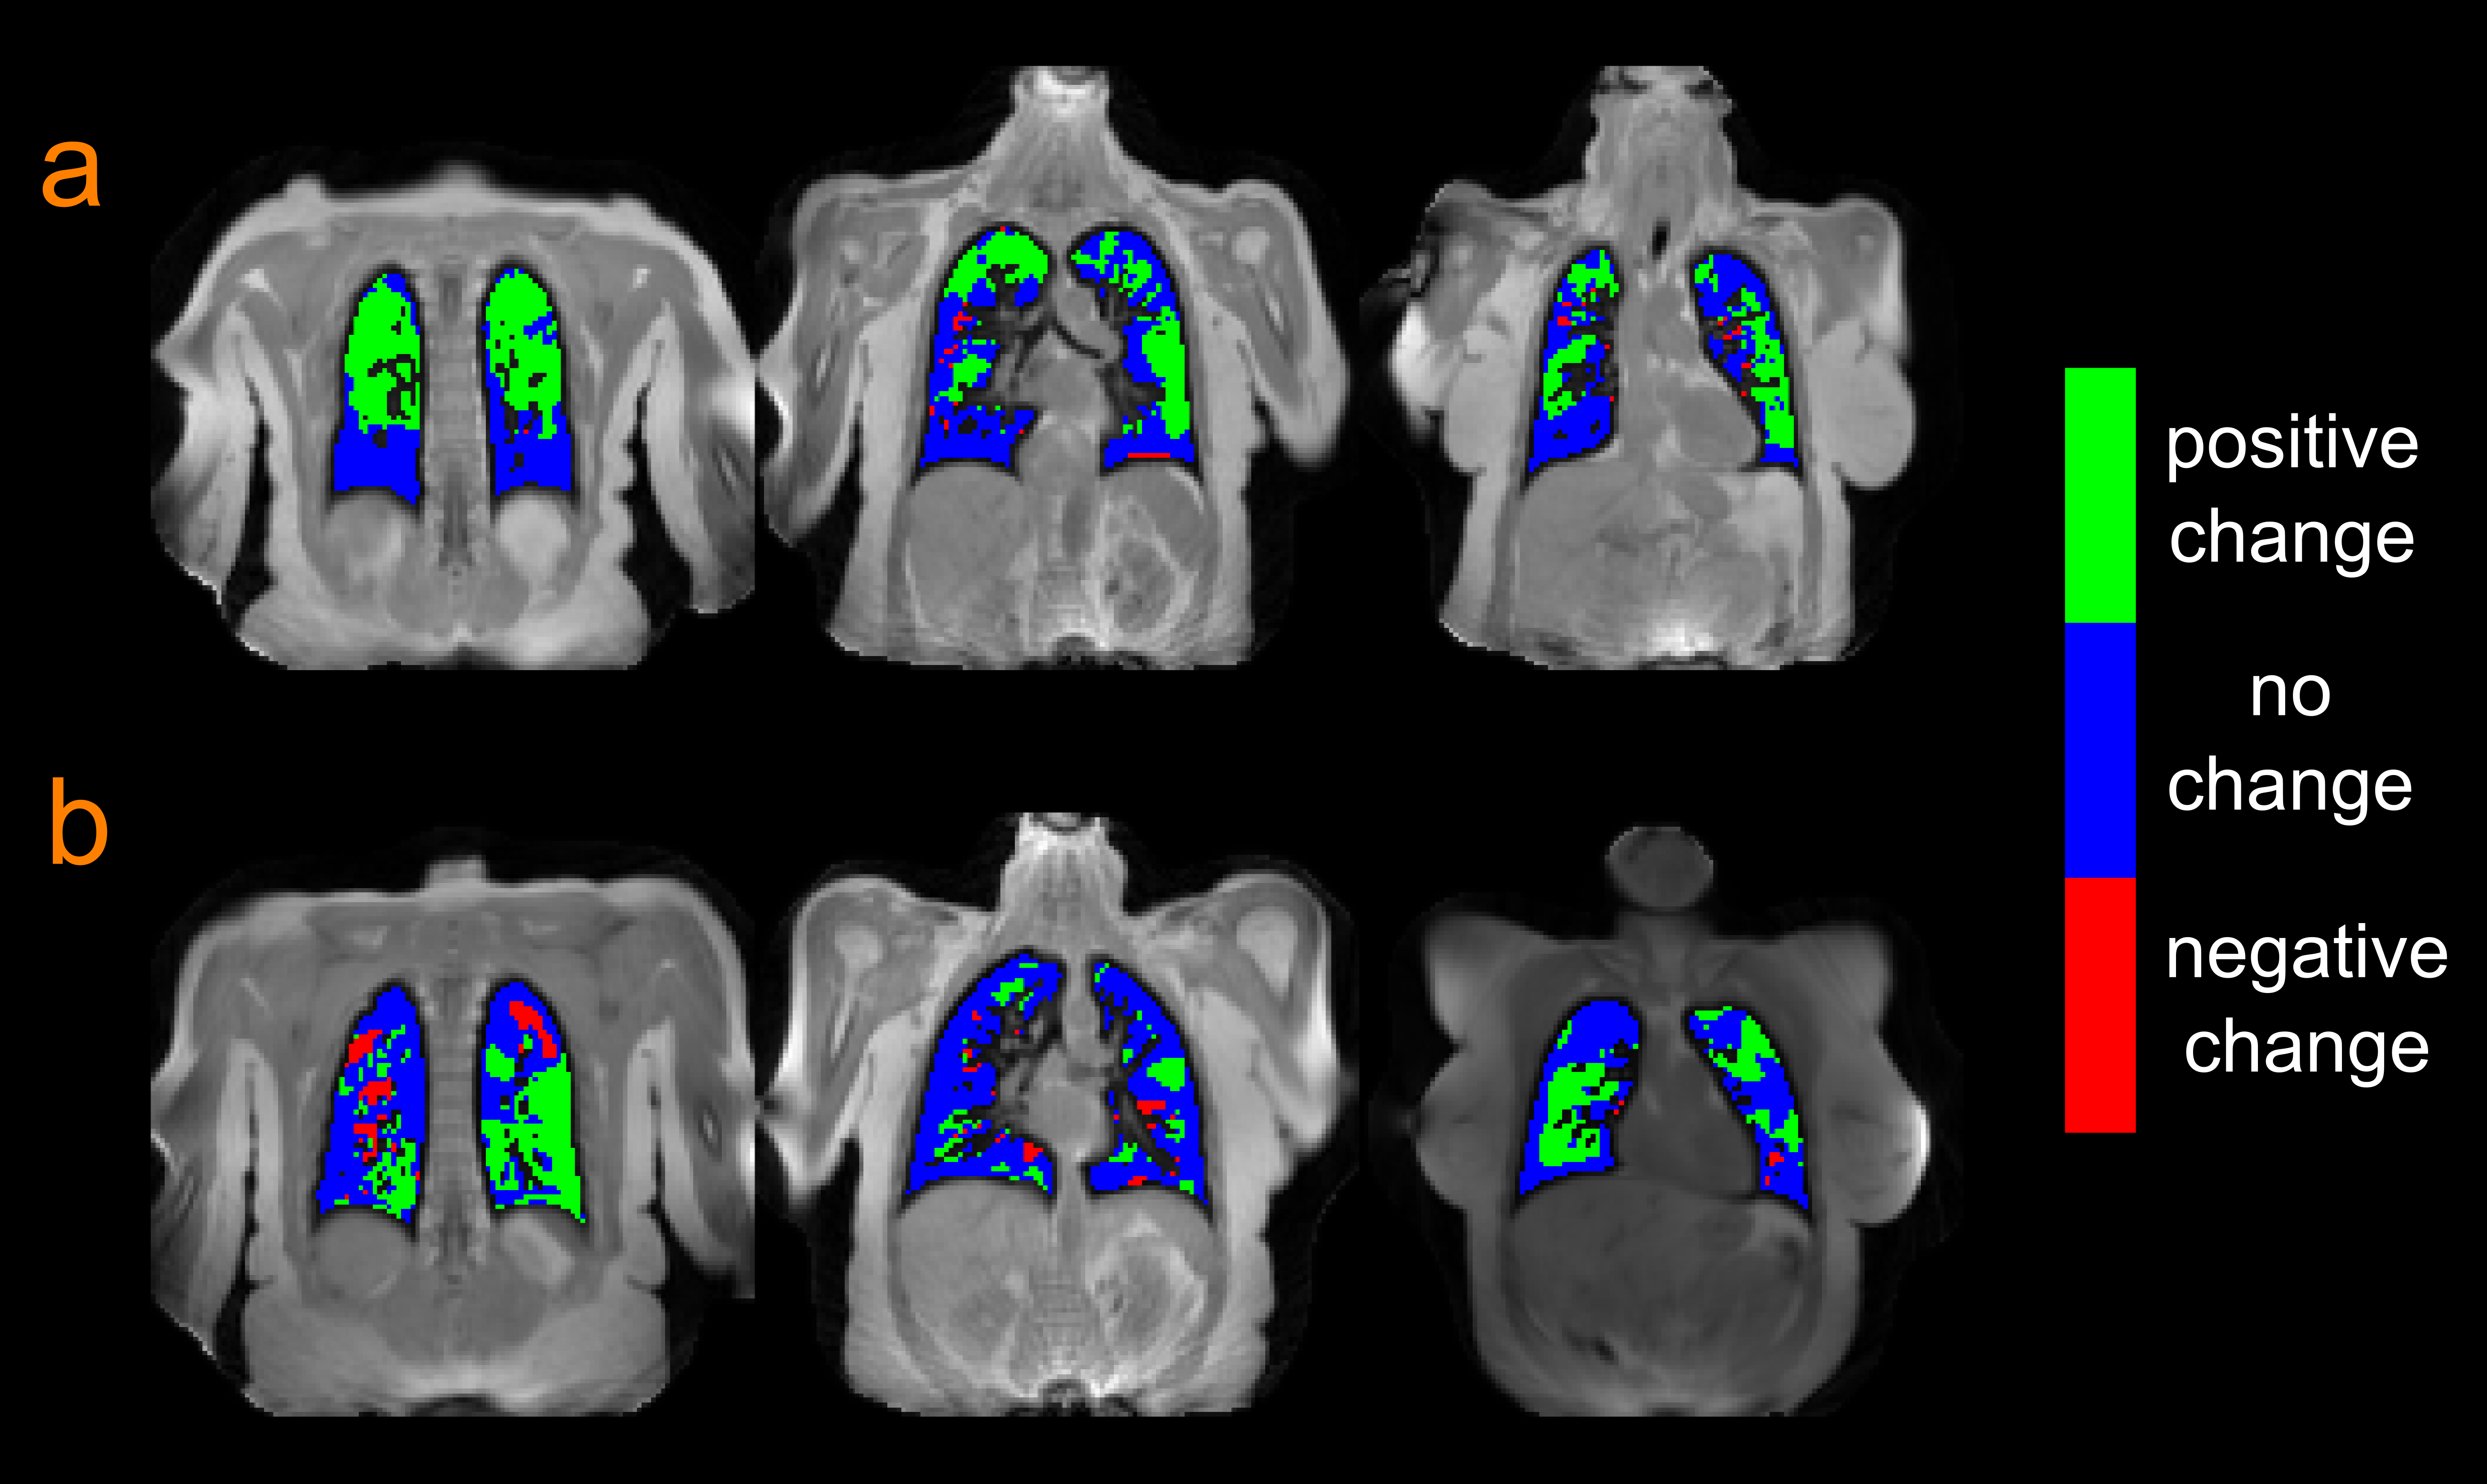
Figure 3. In (a) treatment response maps for a 67-year-old female derived from VDPRVent maps are observed. The positive change of 34.6% (IVVRVent = 800 ml) compared to the negative change of 2.6%, resulted in 32.0% improvement. FEV1 increased from 1.25 to 1.48 l/s, corresponding to an 18.4 % improvement. In (b) treatment response maps for a 54-year-old female derived from VDPFVL-CM maps are shown. Subtracting the negative change of 6.0 % from the positive change of 23.5 % (IVVFVL-CM = 623 ml) results in an improvement of 17.5%. FEV1 rose from 1.06 to 1.27 l/s, reflecting a 19.8 % improvement.