0056
Atlas-based Analysis and Deformation-Based Morphometry of Structural MRI to Study Effects of Hypertension on Rat Brain Structure1Department of Biomedical Engineering, The University of Arizona, Tucson, AZ, United States, 2James C. Wyant College of Optical Sciences, The University of Arizona, Tucson, AZ, United States, 3Evelyn F. McKnight Brain Institute, The University of Arizona, Tucson, AZ, United States, 4Department of Psychology, Neurology, and Neuroscience, The University of Arizona, Tucson, AZ, United States, 5Health Sciences Center, Tulane University, New Orleans, LA, United States, 6Division of Neural Systems, Memory, and Aging, The University of Arizona, Tucson, AZ, United States, 7Department of Medical Imaging, The University of Arizona, Tucson, AZ, United States
Synopsis
Keywords: Preclinical Image Analysis, Hypertension
Motivation: Hypertension (HTN) is a known risk factor for cardiovascular disease and cognitive decline, with a need to understand its effects on brain function and structure using animal models.
Goal(s): We aim to investigate impact of HTN on the brain of transgenic Cyp1a1-Ren2 rats through atlas-based and deformation-based analysis of high-resolution structural MRI.
Approach: Rats were divided into control and hypertensive groups. Structural MRI was carried out, upon which atlas-based analysis and deformation-based morphometry were performed.
Results: Induced HTN significantly affected peripheral organs but showed no significant brain volume changes or cognitive differences. This suggests potential brain protection mechanisms against HTN, warranting further investigation.
Impact: This research explores effects of hypertension on the brain using a rat model and structural MRI. Results show the brain appears resilient to induced hypertension compared to peripheral organs, highlighting need for investigation into protective mechanisms and their potential degradation.
Introduction
Hypertension (HTN) is a known risk factor of cardiovascular disease (CVD)1 and cognitive decline in aging individuals, typically manifesting around middle-age2. Previous studies have demonstrated a link between CVD and cognitive decline in the elderly3. Consequently, there is substantial need to investigate the intricate dynamics between HTN and cognition, specifically in exploration of the potential impact of this disease on brain function and structure. Transgenic Cyp1a1-Ren2 xenobiotic-inducible Fischer-344 (F344) rats are a valuable preclinical and translational animal model of HTN due to the reversible and dose-dependent magnitude of induced HTN via administration of Indole-3-Carbinol (I3C)4. Structural MRI provides the capability of quantifying neurological volumes at regional and subregional levels non-invasively to assess effects of pathology. Here, we investigate the effects of HTN on the F344 rat brain through atlas-based analysis (ABA) and deformation-based morphometry (DBM) of high-resolution, T2-weighted structural MRI.Methods
15-month-old transgenic male F344 rats (n=35) were randomly divided into two groups: a control group (n=15) and a hypertension group (n=20). The control group would receive a regular chow diet while the hypertensive group would receive an I3C-supplemented diet to induce hypertension. After a baseline behavioral battery of tests, structural brain MRI was carried out on a 7T Bruker Biospec (Bruker, Billerica, MA): 3D T2 RARE (TR=1500 ms, Echo Spacing=10 ms, ETL=8, TEeff=40 ms, 150 micron isotropic voxel resolution, Imaging time=76 min). Following baseline imaging, the hypertension group was administered I3C-supplemented chow to induce hypertension while the control group remained on regular chow. Behavior tests (weeks 4-10) and MRI (week 10) were repeated.Image Processing
3D T2 RARE anatomical brain images were bias-corrected using ANTS N4 algorithm5 and masked via semi-automated outlining techniques in MRIcron6. An F344 T2-weighted reference rat brain image and corresponding labeled atlas were obtained for subsequent processing 7.Using ANTS, the F344 reference image was registered to each masked, bias-corrected image in the study via rigid, affine, and symmetric diffeomorphic registration. Resulting transformations were applied to the F344 labeled atlas7 to obtain a labeled atlas in native space of each brain (Figure 1). In-house software calculated volumes of six regions of interest relevant to healthy cognition (the hippocampal subfields CA1,2,3, dentate gyrus, hippocampus plus dentate gyrus, fimbria, neocortex, and corpus callosum) and adjusted for total intracranial volume8,9. Region volume change scores were evaluated using a Student’s T-test and Bonferroni’s multiple comparisons correction (P < 0.0071).
For DBM analysis, a population template was created from all masked, bias-corrected T2 RARE images using the F344 T2 reference as a starting target. Two-level registration was performed to this population template, first registering within subjects at both time points, and second between subjects. The resulting transformation data (rigid, affine, and nonlinear) were post-processed using CoBraLab DBM software10 to generate voxel-wise Jacobian determinant maps for each brain in the study (Figure 2). Voxel-wise statistical analysis was performed using the Confixel11 and ModelArray12 R packages to analyze differences between groups at each time point.
Results
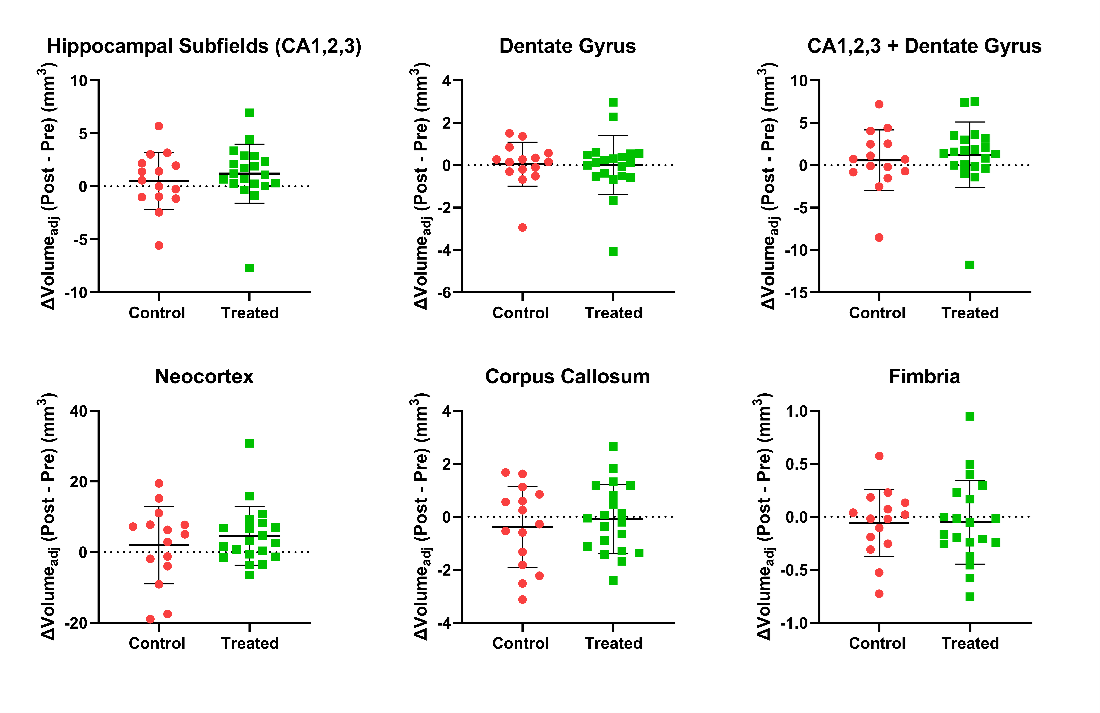
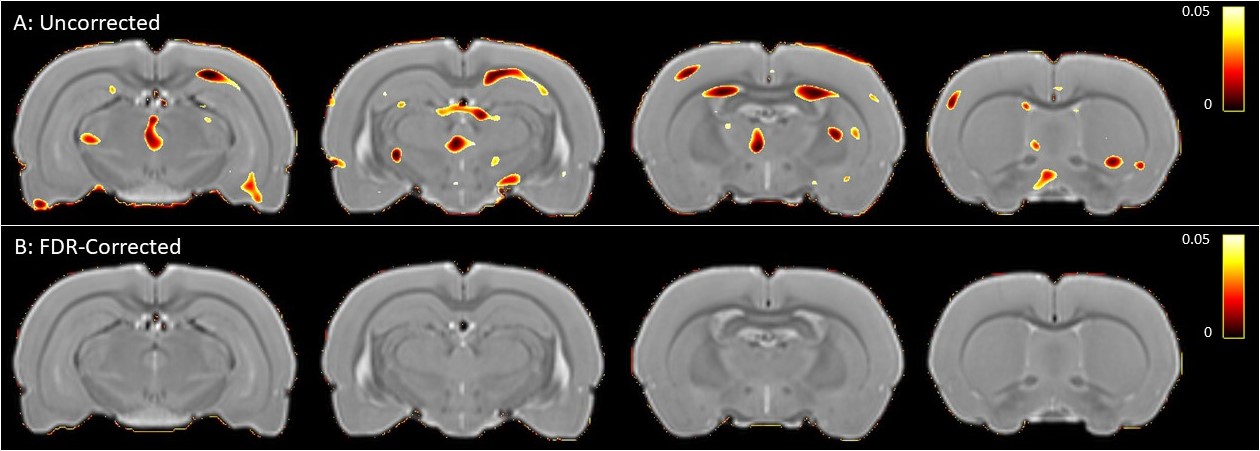
The hypertensive group had significantly higher mean systolic and diastolic blood pressures compared to controls after administration of I3C (Figure 3). After 10 weeks, induced HTN had a profound effect on peripheral organs, resulting in significant collagen fibrosis of the heart and kidney tissues (Figure 3). ABA of the anatomical MRI showed no significant difference in volume change between groups within the six brain regions (Figure 4). DBM analysis corroborates these findings, showing no areas of significant difference between control and hypertensive groups, at either time point, after false discovery rate correction (Figure 5).Discussion
In the presence of increased systolic and diastolic blood pressure over 10 weeks and significant collagen fibrosis of the heart and kidney tissues, behavioral testing showed no significant differences in cognition between control or hypertensive groups. Likewise, results of an ABA indicate no significant change in macrostructure of these six regions of interest. DBM analysis corroborates the findings of ABA on a voxel-wise level, indicating no significant difference between these groups after 10 weeks of induced HTN.Conclusion
Using atlas-based, ROI-specific analysis of volumetric changes and DBM for subregional investigation allows for multi-level quantification of volumetric changes to the brain and how pathologies such as HTN can affect these regions. Our results indicate that the brain is protected from the detrimental effects of HTN compared with peripheral organs such as the heart and kidneys. Future studies in this area may benefit from investigating how this protective mechanism may degrade with greater degree and duration of induced HTN.Acknowledgements
This experiment was supported by the McKnight Brain Research Foundation and R01 AG049465.
References
[1] Fuchs, F. D., & Whelton, P. K. (2020). High Blood Pressure and Cardiovascular Disease. Hypertension (Dallas, Tex. : 1979), 75(2), 285–292. https://doi.org/10.1161/HYPERTENSIONAHA.119.14240[2] Wilkie, F., & Eisdorfer, C. (1971). Intelligence and blood pressure in the aged. Science, 172(3986), 959–962. https://doi.org/10.1126/science.172.3986.959
[3] Haring, B., Leng, X., Robinson, J., Johnson, K. C., Jackson, R. D., Beyth, R., Wactawski-Wende, J., von Ballmoos, M. W., Goveas, J. S., Kuller, L. H., & Wassertheil-Smoller, S. (2013). Cardiovascular disease and cognitive decline in postmenopausal women: results from the Women's Health Initiative Memory Study. Journal of the American Heart Association, 2(6), e000369. https://doi.org/10.1161/JAHA.113.000369
[4] Leader, C. J., Clark, B. J., Hannah, A. R., Sammut, I. A., Wilkins, G. T., & Walker, R. J. (2018). Breeding Characteristics and Dose-dependent Blood Pressure Responses of Transgenic Cyp1a1-Ren2 Rats. Comparative medicine, 68(5), 360–366. https://doi.org/10.30802/AALAS-CM-17-18000026
[5] Avants, B. B., Tustison, N. J., Song, G., Cook, P. A., Klein, A., & Gee, J. C. (2011). A reproducible evaluation of ANTs similarity metric performance in brain image registration. NeuroImage, 54(3), 2033–2044. https://doi.org/10.1016/j.neuroimage.2010.09.025
[6] Rorden, C., & Brett, M. (2000). Stereotaxic display of brain lesions. Behavioural neurology, 12(4), 191–200. https://doi.org/10.1155/2000/421719
[7] Goerzen, D., Fowler, C., Devenyi, G. A., Germann, J., Madularu, D., Chakravarty, M. M., & Near, J. (2020). An MRI-derived neuroanatomical atlas of the fischer 344 rat brain. Scientific Reports, 10(1). https://doi.org/10.1038/s41598-020-63965-x
[8] Arndt S, Cohen G, Alliger RJ, Swayze VW, Andreasen NC. Problems with ratio and proportion measures of imaged cerebral structures. Psychiatry Res Neuroimaging. 1991;40(1):79–89.
[9] Mathalon DH, Sullivan EV, Rawles JM, Pfefferbaum A. Correction for head size in brain-imaging measurements. Psychiatry Res Neuroimaging. 1993; 50(2):121–39. 22. Sanfilipo MP, Benedict RHB, Zivadinov R, Bakshi R. Correction for intracranial volume in analysis of whole brain atrophy in multiple sclerosis: the proportion vs. residual method. Neuroimage. 2004;22(4):1732–43.
[10] Chakravarty M, Devenyi G, Haniff R, Desrosiers-Gregoire G. Optimized_antsMultivariateTemplateConstruction. 2018. https://github.com/CoBrALab/optimized_antsMultivariateTemplateConstruction
[11] PennLINC/ConFixel: Companion converter software for ModelArray for converting data back and forth from the HDF5 file format. https://github.com/PennLINC/ConFixel
[12] Zhao, C., Tapera, T. M., Bagautdinova, J., Bourque, J., Covitz, S., Gur, R. E., Gur, R. C., Larsen, B., Mehta, K., Meisler, S. L., Murtha, K., Muschelli, J., Roalf, D. R., Sydnor, V. J., Valcarcel, A. M., Shinohara, R. T., Cieslak, M. & Satterthwaite, T. D. (2023). ModelArray: an R package for statistical analysis of fixel-wise data, NeuroImage, In press. https://doi.org/10.1016/j.neuroimage.2023.120037
Figures
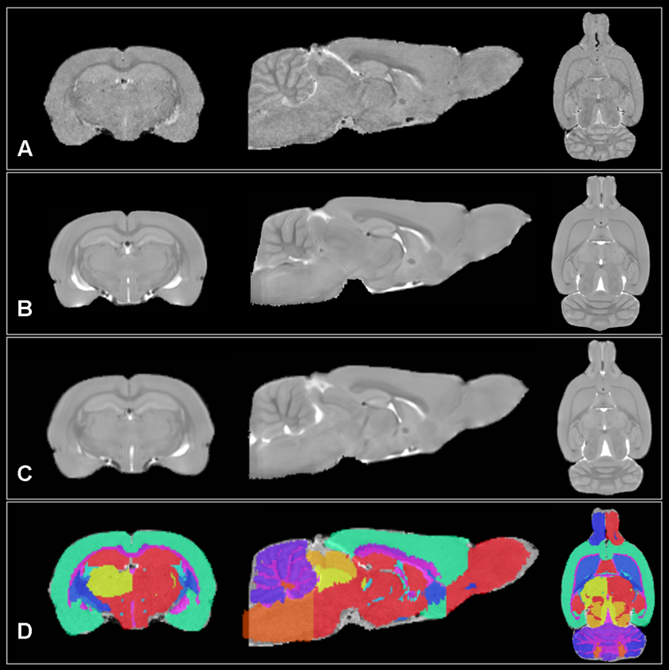
Figure 1. Steps in registering the F344 labeled atlas to the native space of a masked, bias-corrected T2 RARE image. A) A representative masked, bias-corrected T2 RARE image; B) the masked, F344 T2-weighted reference image; C) the F344 T2-weighted reference image resampled to the T2 RARE image space; D) the F344 labeled atlas resampled to and overlaid upon the T2 RARE in its native space.
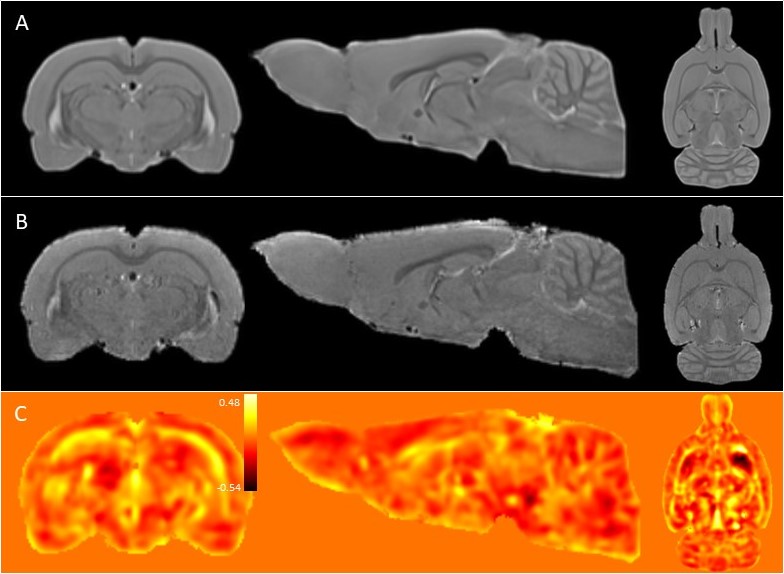
Figure 2. A) Population template generated from all study images at both imaging time points with the F344 T2-weighted reference image as a starting target. B) Representative T2-RARE image resampled to the population template space. C) Resulting Jacobian determinant map generated for the images in B.
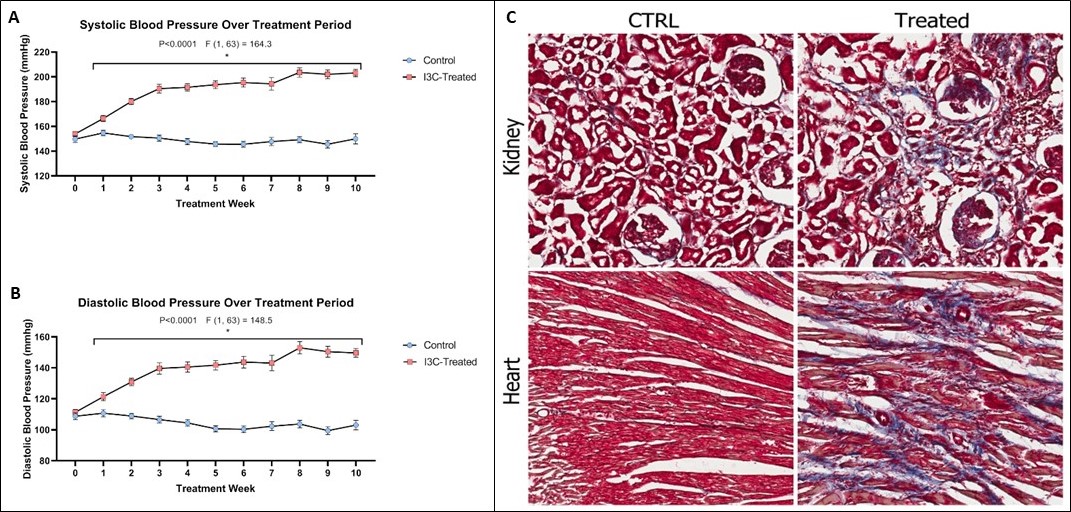
Figure 3. Mean systolic (A) and diastolic (B) blood pressures were significantly higher in hypertensive animals with I3C administration than control animals. C) Masson’s trichrome staining demonstrates collagen fibrosis of heart and kidney tissues in hypertensive animals after 10 weeks of induced HTN.