0047
Metabolic characterization of the rat motor cortex with fMRS upon chemogenetic excitation1DRCMR, Copenhagen University Hospital - Amager and Hvidovre, Hvidovre, Denmark, Denmark
Synopsis
Keywords: Biology, Models, Methods, Metabolism, Chemogenetics, fMRS
Motivation: To complement previous fMRI studies of interhemispheric pathways, we propose to characterize the interhemispheric metabolism using functional magnetic resonance spectroscopy (1H-fMRS).
Goal(s): To demonstrate the feasibility of chemogenetic 1H-fMRS in the rat brain at 7T.
Approach: DREADDs and Sham viruses were injected in the right motor cortex of rat. Neural activation was induced by a 1mg/kg IP bolus of Clozapine-N Oxide (CNO). Spectra were acquired continuously prior and following CNO injection and quantified with a temporal resolution of 5 minutes.
Results: Relative concentration changes were found for myo-Inositol, Taurine, Glutamate and NAA in the motor cortex of chemo-induced rats following CNO injection.
Impact: Functional metabolic findings will greatly complement our knowledge of interhemispheric pathway allowing a better understanding of long-distance circuits known to initiate both excitation and inhibition.
Introduction
It is well known that long- distance circuits such as the interhemispheric pathway initiate both excitation and inhibition (1). To investigate the modulation of the neurovascular coupling between the left and right hemispheres in rodents, optogenetics and chemogenetics tools have been used efficiently (1,2) bringing crucial insights into our understanding of the biological basis of functional signals (1). Here, we combined 1H-fMRS (3) with chemogenetics in the motor cortex (M1/M2) of rats to add specific metabolic interpretation to the concert of events ruling the interhemispheric circuitry.Materials and Methods
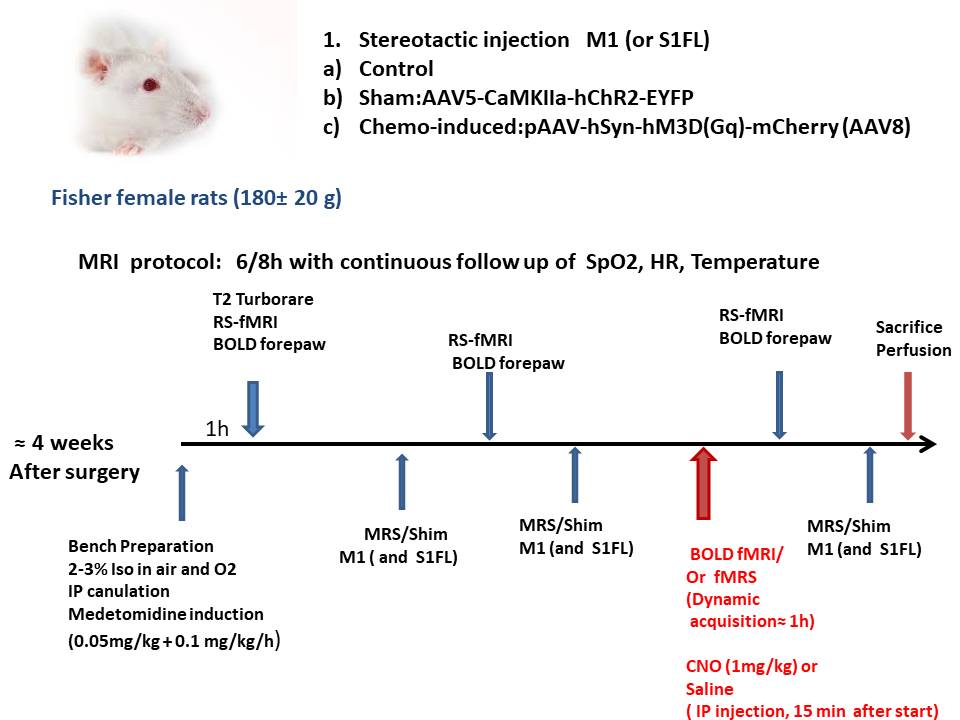
The expression of an DREADD in the right M1 of rats (Female Fisher rats (n=15,180 ±20 g) was induced by injecting AAV8-hSyn-hM3D(Gq)-mCherry for Clozapine-N-Oxide (CNO) –induced neural activation. A sham group expressing AAV5-CaMKIIa-hChR2-EYFP in M1(n=5) and a control group (n=4) were also used. One month after viral-injections, rats were scanned in a 7T small animal MRI scanner (Bruker, France). Each rat was installed under isoflurane (2-3%) with its head secured in a stereotactic frame. Respiration, temperature, heart-rate and SpO2 were monitored during scans. During MRI, the rats were sedated with a mixture of isoflurane (0.5%) and medetomidine following the protocol in Fig 1. Adjustments and structural images (T2 RARE) were performed after the start of Medetomidine infusion. Functional MRI was initiated 40 minutes after the stabilization of the respiration rate (50-65 bpm). RSfMRI forepaw and pharmacological BOLD fMRI (ph-BOLD-fMRI) were conducted using a single shot Gradient Echo EPI sequence (TR/TE=1500/11ms or 18ms; FOV= 20x 20 mm2; Matrix= 64x 64; 315 or 2400 repetitions). During ph-BOLD fMRI, an intraperitoneal bolus injection of Clozapine-N-Oxide (CNO) (1 mg/kg) or saline (Fig. 1) was performed 15 minutes after the start of the continuous acquisition and prolonged for 35 minutes after the CNO injection. MRS or fMRS were conducted using a LASER sequence (TR/TE=2000/24.5ms) in a 1.4 X 2.8 x2 mm3 VOI positioned over the viral injection site in M1. For fMRS, 200 fids (with 8 or 16 averages, 16s or 32s per time point) were acquired continuously with an IP injection of saline or CNO, 15 min (60 fids) after the start of acquisition. MAPShim was used for water shimming down to a linewidth of 10 ± 2Hz. Rs-fMRI and BOLD-fMRI were processed with SPM and Gift (Matlab. 2020). For fMRS, after Fourier transformation, spectra were 0th and 1st order corrected and realigned using matalb routines. 5 min timepoints were obtained by averaging 20 fids and transferred to LCModel were spectra were adjusted using a simulated basis-set including measured macromolecules and metabolite quantification was obtained using the unsuppressed water signal acquired in the same VOI. The water suppression was performed using VAPOR module. Neurochemicals quantified with Cramér-Rao lower bounds (CRLB) to estimate the errors of the neurochemical quantification under 20 % were considered reliable.Results
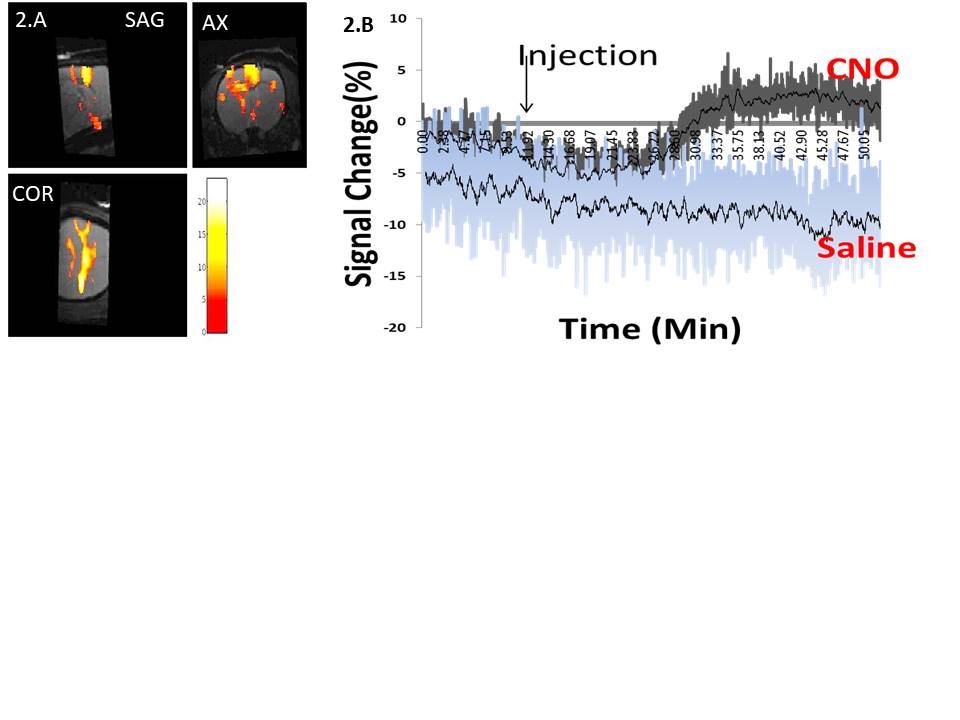
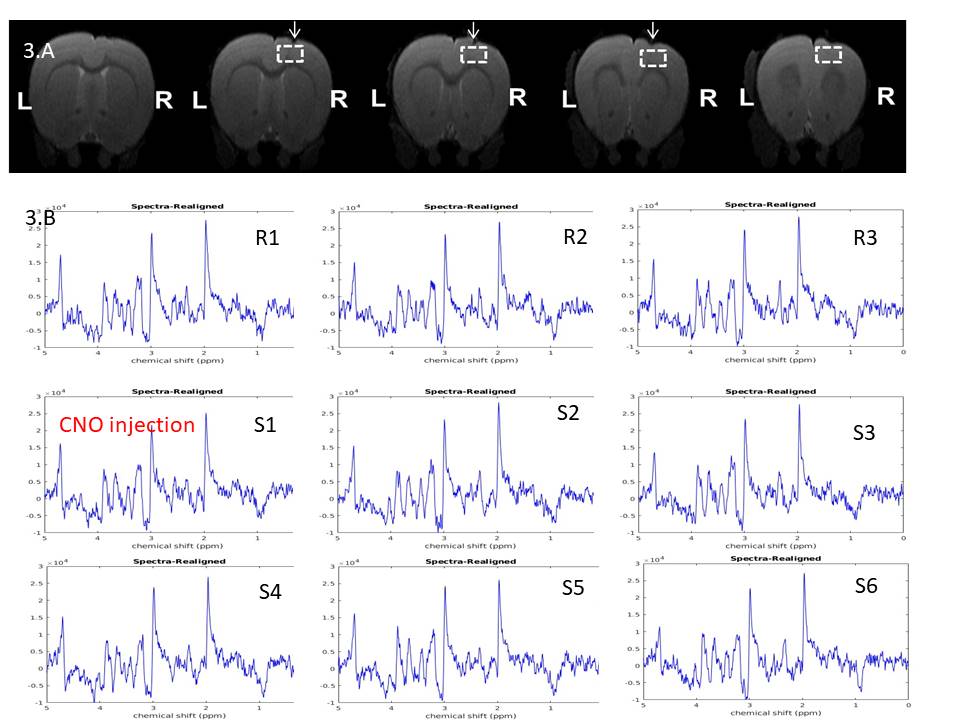
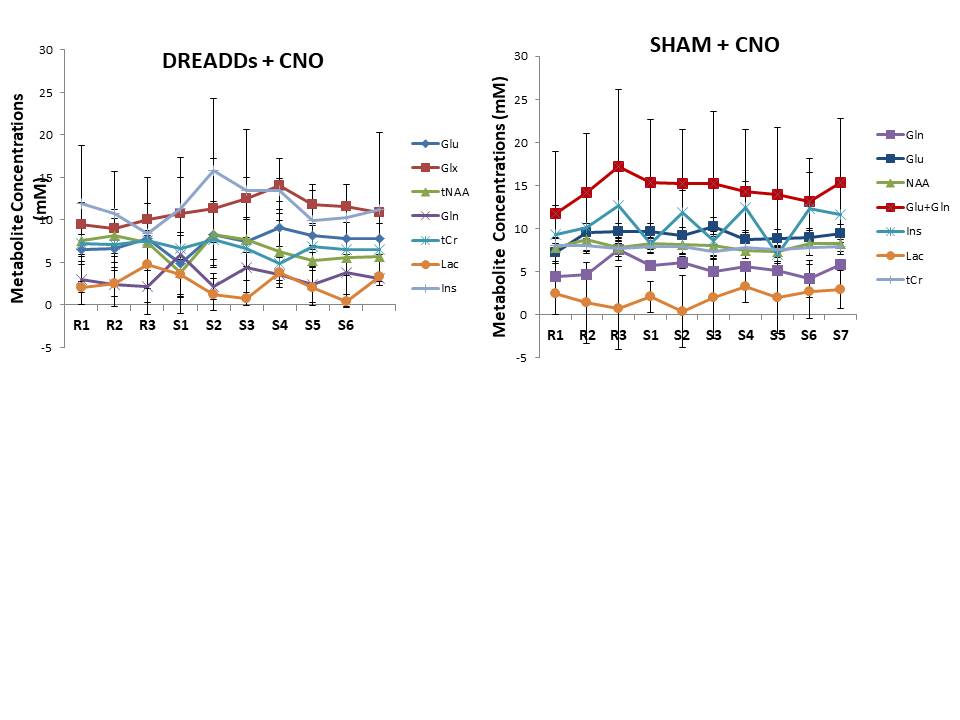
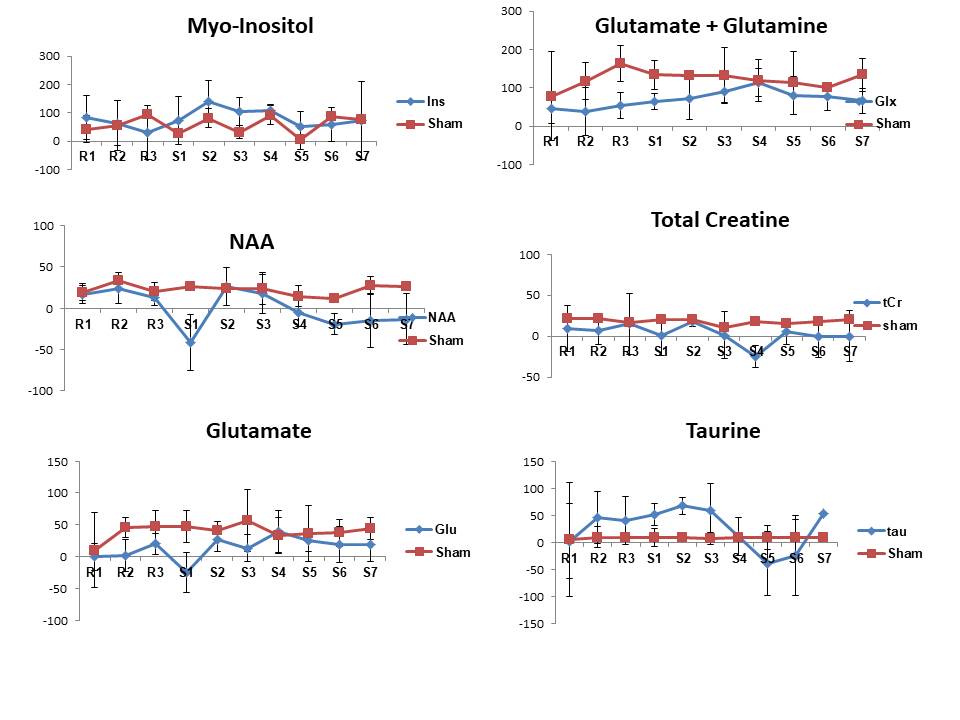
Upon CNO injection, the BOLD signal in M1 increased significantly (Fig.2A) in DREADDs rats (ΔS= 2.3± 1 %) in contrast to saline-injected control rats (Fig.2B) for which no BOLD activation was detected. A series of individual 1H-MR spectra each reconstructed from 20 successive fids (5min of acquisition) during CNO uptake is also depicted (Fig3B). Each spectrum was LCModel-fitted leading to the metabolite concentration time-courses in DREADDs-injected and sham rats (Fig 4). To evaluate functional metabolic changes upon chemogenetic activation, metabolite concentration timecourses in DREADDs and sham rats were normalized to metabolite concentrations in saline rats. Relative changes (± standard deviations) were compared (Fig 5). R1, R2, and R3 time points represent rest periods before CNO injection and S1-S7 stimulated time points after CNO injection. While relative metabolic changes in M1/M2 remained non-statistically significant (p>0.05) in sham rats for most metabolites, NAA and Glu timecourses were perturbed at the injection time point S1 in DREADDs rats. In these rats, myo-Inositol and Glu +Gln relative concentrations increased significantly after CNO injection (58 vs 118 %, p =0.03; 46 vs. 93%; p=0.042, respectively) while NAA and Tau relative concentrations decreased significantly after S4 (18 vs -13%, p=0.04; 46 vs. -17%, p=0.04) but Glu relative concentrations increased significantly (7 vs. 31%, p=0.012).Discussion and Conclusion
We show significant relative changes for myo-Ins, Tau, NAA and Glx in M1/M2 of chemo-induced rats after CNO injection but not in sham rats. Previous studies (2) described a transition phase lasting 15 minutes upon CNO injection followed by a longer active phase. Therefore, we attribute the metabolic changes 15 minutes after CNO injection (S1-S3) to changes in osmolarity. The significant changes in Glu at S4 can be attributed to chemogenetic activation. More work is required to interpret the decreases in Tau and NAA relative concentrations.Acknowledgements
This project was funded by the Lundbeck Foundation (Experiment grant, grant nr. R370-2021-402).References
1. Iordanova et al. Optogenetic investigation of the variable neurovascular coupling along the interhemispheric circuits.J Cereb Blood Flow Metab. 2018 Apr;38(4):627-640. doi: 10.1177/0271678X18755225
2. Rocchi et al. Increased FMRI connectivity upon chemogenetic inhibition of the mouse prefrontal cortex. Nature communications; 2022, 13:1056
3.Just N.Proton functional magnetic resonance spectroscopy in rodents. NMR Biomed. 2021 May;34(5):e4254. doi: 10.1002/nbm.4254.
Figures