0036
Fast imaging of intravenous Gadolinium-based contrast agents entrance into ventricular CSF via choroid plexus in healthy subjects1F.M. Kirby Research Center for Functional Brain Imaging, Kennedy Krieger Institute, Baltimore, MD, United States, 2Neurosection, Division of MRI Research, Russell H. Morgan Department of Radiology and Radiological Science, Johns Hopkins University School of Medicine, Baltimore, MD, United States, 3Department of Biomedical Engineering, Johns Hopkins University, Baltimore, MD, United States, 4Department of Neurosurgery, Johns Hopkins University School of Medicine, Baltimore, MD, United States, 5Division of Neuroradiology, Mayo Clinic College of Medicine and Science, Rochester, MN, United States, 6Department of Otolaryngology - Head and Neck Surgery, Johns Hopkins University School of Medicine, Baltimore, MD, United States, 7Department of Neurology, Johns Hopkins University School of Medicine, Baltimore, MD, United States, 8Department of Psychiatry and Behavioral Sciences, Johns Hopkins University School of Medicine, Baltimore, MD, United States
Synopsis
Keywords: Neurofluids, DSC & DCE Perfusion, lymphatic; CSF; ISF; GBCA
Motivation: Intravenously administered gadolinium-based-contrast-agents (GBCAs) can enter the lateral-ventricle (LV) via choroid-plexus (CP). However, systematic investigation of GBCA accumulation in ventricular CSF via CP in healthy subjects is limited.
Goal(s): To measure GBCA-induced signal changes in the LV and CSF around CP immediately and 4 hours after intravenous GBCA administration.
Approach: Dynamic-susceptibility-contrast-in-the-CSF (cDSC) MRI was performed in 25 healthy subjects.
Results: At ~20s post-GBCA, GBCA-induced signal changes were detected in the CSF around CP but not in the rest of LV. After 4 hours, GBCA-induced signal changes also became significant in the entire LV. GBCA-amount in the LV showed an age correlation.
Impact: These results provided direct imaging evidence that intravenous GBCA can pass the BCSFB in the CP and enter ventricular CSF in healthy subjects.
INTRODUCTION:
There is accumulating evidence from studies in animal models and patients that intravenously administered gadolinium-based-contrast-agents (GBCAs) can enter cerebrospinal fluid (CSF). One main site is the blood-CSF-barrier (BCSFB) in the choroid plexus (CP). Jost et al(1) demonstrated in a rat model that GBCA enters the ventricle via CP in <10minutes following intravenous GBCA administration. Intravenous GBCA has also been detected in the CP and ventricle in patients with an impaired blood-brain barrier (BBB)(2) and in healthy subjects(3-5). For reviews, see (6). Nevertheless, systematic investigation of GBCA distribution across the CP in healthy human subjects remains limited. Most existing human MRI studies on the topic have been performed with limited temporal resolution, and therefore, the dynamic phase immediately following intravenous GBCA administration has not been captured. More importantly, the MRI approaches employed in most existing studies have significant signal contributions from both blood and CSF. This is particularly problematic for intravenous GBCA as intravascular GBCA concentration is substantially greater than in CSF at early time points. Here, we applied the recently developed dynamic-susceptibility-contrast-in-the-CSF (cDSC)(7) MRI approach to measure GBCA-induced signal changes in CSF around the CP and in the lateral ventricle (LV) immediately and 4 hours after intravenous GBCA administration in healthy subjects. The cDSC-MRI method can track dynamic CSF signal changes with a temporal resolution of <10s, a sub-millimeter spatial resolution, and whole brain coverage. With a long TE (1312ms), the tissue and blood signals are effectively suppressed, and thus partial volume effects are minimal. The innovations of this study include: 1) GBCA spreading across the CP in healthy subjects; 2) GBCA distribution in the CSF during the bolus phase; and 3) purer CSF signals with minimal partial-volume effects from blood. Furthermore, the integrity of CP may have important implications for the clearance of abnormal proteins in the brain in aging and neurodegenerative diseases. Hence, the relationship between GBCA concentration and amount in the LV and age was studied in this healthy cohort.METHODS:
25 healthy volunteers (48.9±19.5yr, 20-85yr, 14females). MRI experiments were performed at 3T (Philips Ingenia). GBCA (Gadoteridol) was administered intravenously (0.1 mmol/kg). The following scans were performed: a) pre-GBCA FLAIR: 0.8mm iso; b) cDSC MRI continuously before and after GBCA injection: 0.8mm iso, 3D-TSE, TR/TE=10s/1312ms, 60volumes; c) post-GBCA FLAIR; d) 4-hour post-GBCA FLAIR; e) 4-hour post-GBCA cDSC. Data analysis: cDSC images were motion-corrected using SPM. FLAIR images were co-registered with cDSC images. Five ROIs were manually delineated on post-GBCA FLAIR images: CP, transition area between CP and CSF, the rest of LV excluding CP and transition area, occipital cortical GM (cGM), and corpus-callosum (CC). Relative-signal-change (∆S/S), GBCA concentration ([Gd]), time-to-onset (Tonset), and time-to-plateau (TTP) were calculated from cDSC images using established methods(7). These parameters ([Gd]/Tonset/TTP) cannot be estimated from FLAIR images. The CC signal was used to normalize other MR signals from different sessions, as GBCA leakage in WM in healthy subjects within 4hours post-GBCA is expected to be minimal(8,9).RESULTS:
Fig.1 shows important differences in GBCA-induced ∆S/S in CSF for cDSC and FLAIR. FLAIR has a positive GBCA-induced ∆S/S in CSF and cDSC a negative one. Furthermore, as partial-volume effects are minimal in cDSC but significant in FLAIR, in regions where blood signals are substantial, ∆S/S in FLAIR and cDSC may have opposite trends. For instance, an increased [Gd] in CSF but decreased [Gd] in blood may lead to a greater (more negative) cDSC ∆S/S but a smaller FLAIR ∆S/S overall. Figs.2-3 show representative ΔS/S results in CP and LV from cDSC and FLAIR, respectively. Following GBCA administration, significant cDSC ΔS/S were observed only in CSF around CP and transition area, but not in the rest of LV and CSF around cGM (Table 1). Tonset and TTP were approximately 20s and 30s, respectively. At 4-hour post-GBCA, cDSC showed significant ΔS/S in all ROIs, with greater magnitudes compared to the immediate post-GBCA period. The magnitudes of ΔS/S from FLAIR showed similar trends to cDSC, based on the simulations shown in Fig.1. Fig.4 demonstrates that the amount of GBCA ([Gd] x volume) but not concentration ([Gd]) positively correlated with age during the immediate post-GBCA period when controlling for GBCA dosage.DISCUSSION & CONCLUSION:
Our results showed that intravenous-GBCA can pass the BCSFB in CP and enter ventricular CSF in healthy subjects. Interestingly, no correlation between GBCA-concentration in the LV and age was found in this healthy cohort, suggesting that the CP’s permeability to this GBCA may be largely preserved in normal aging. The GBCA-amount in the LV was primarily determined by the LV volume after GBCA distribution reaches equilibrium.Acknowledgements
No acknowledgement found.References
(1)Jost, G, et al. Eur Radiol 2017;27:2877.
(2)Deike-Hofmann, K, et al. Invest Radiol 2019;54:229.
(3)Richmond, SB, et al. Eur J Neurosci 2023;57:1689.
(4)Berger, F, et al. Radiology 2018;288:703.
(5)Nehra, AK, et al. Radiology 2018;288:416.
(6)Verheggen, ICM, et al. Neurosci Biobehav Rev 2021;127:171.
(7)Cao, D, et al. Magn Reson Med 2020;84:3256.
(8)Taoka, T, et al. Jpn J Radiol 2017;35:172.
(9)Mestre, H, et al. Clin Sci (Lond) 2017;131:2257.
Figures
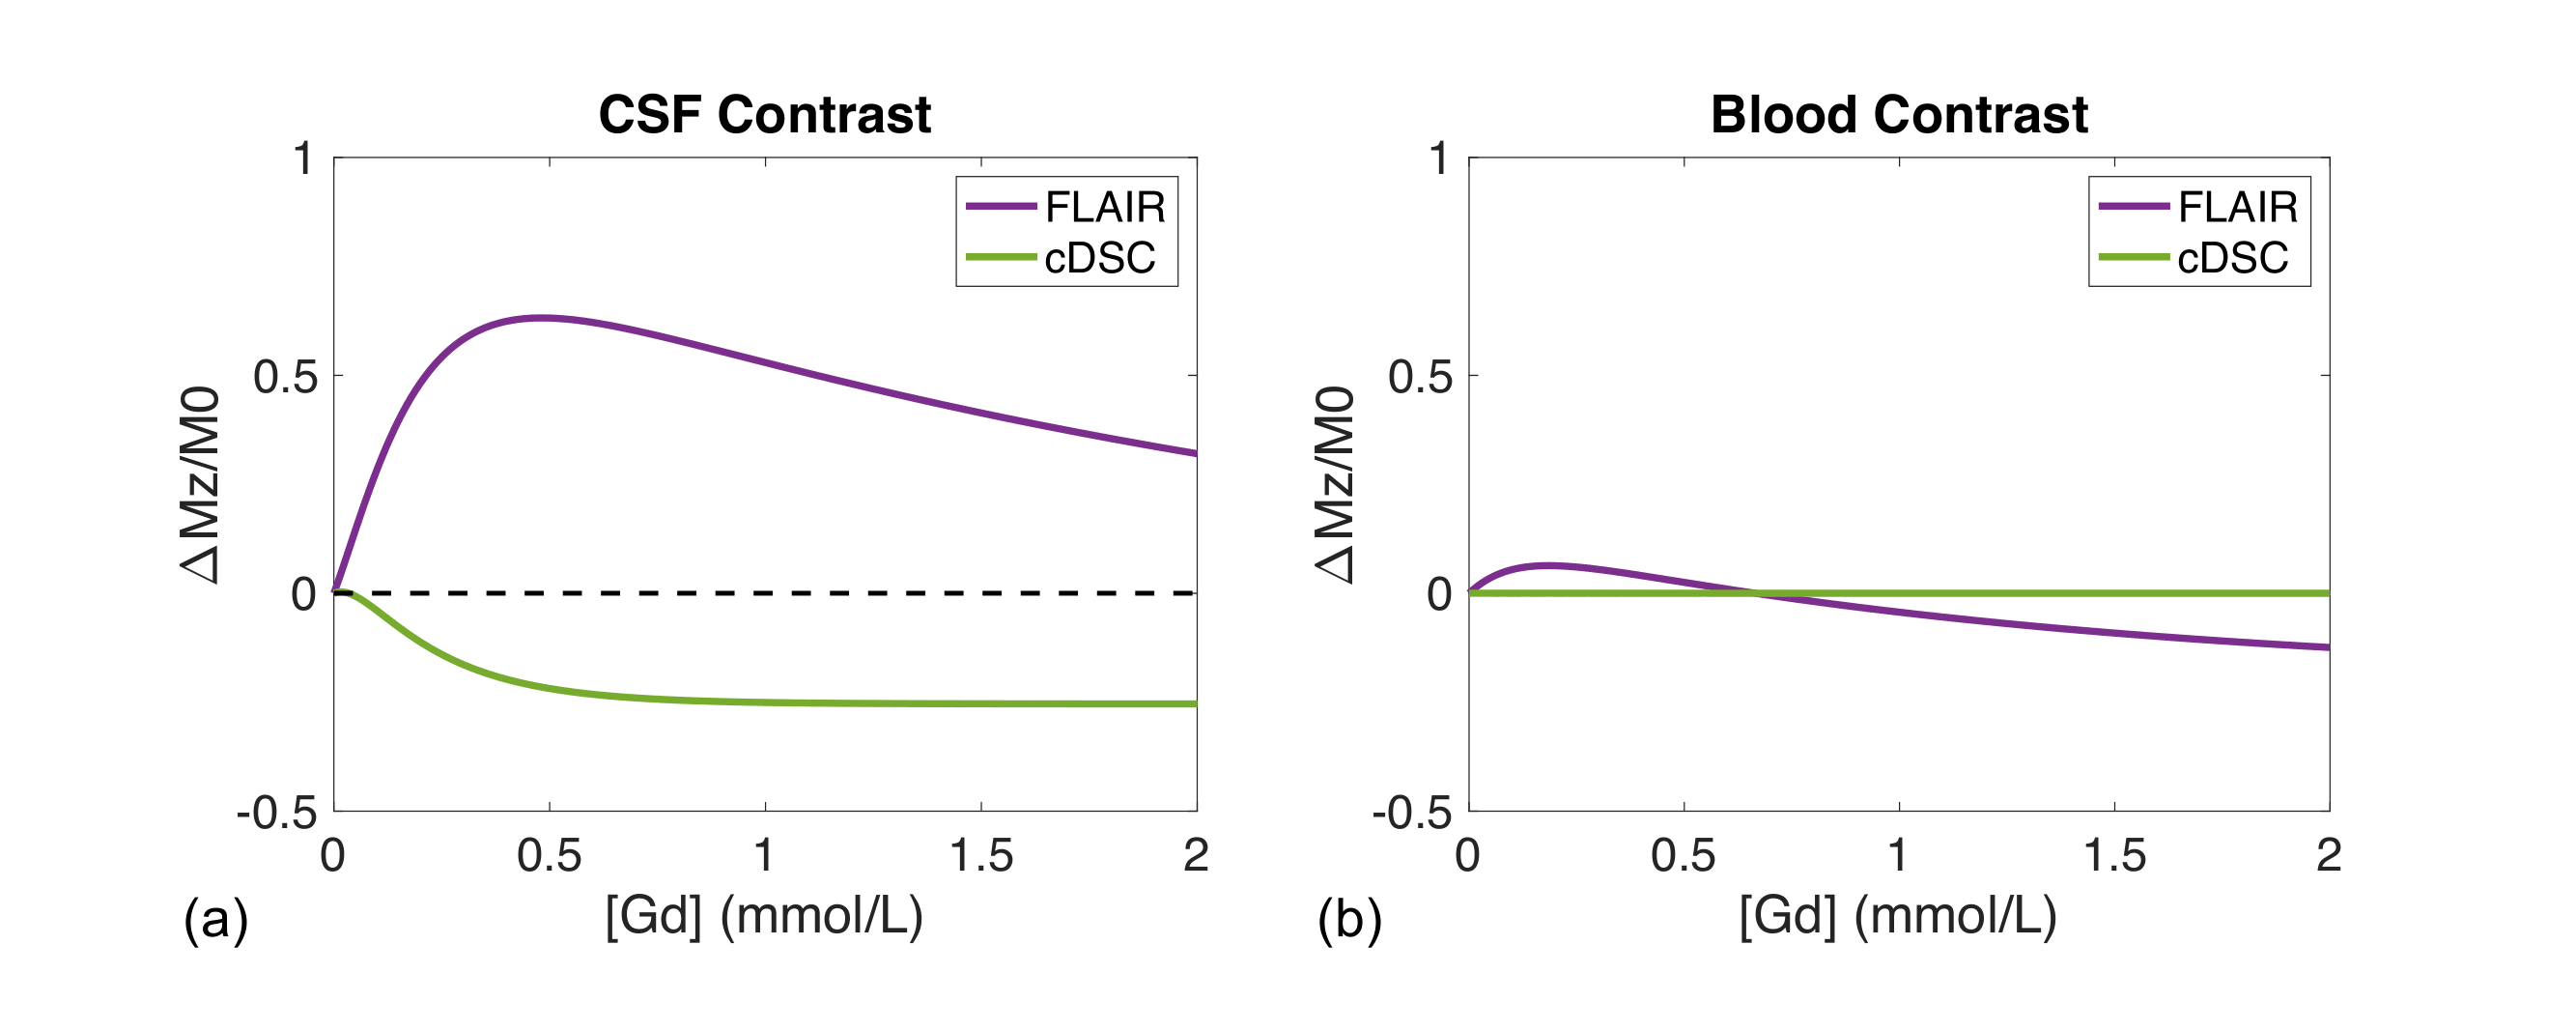
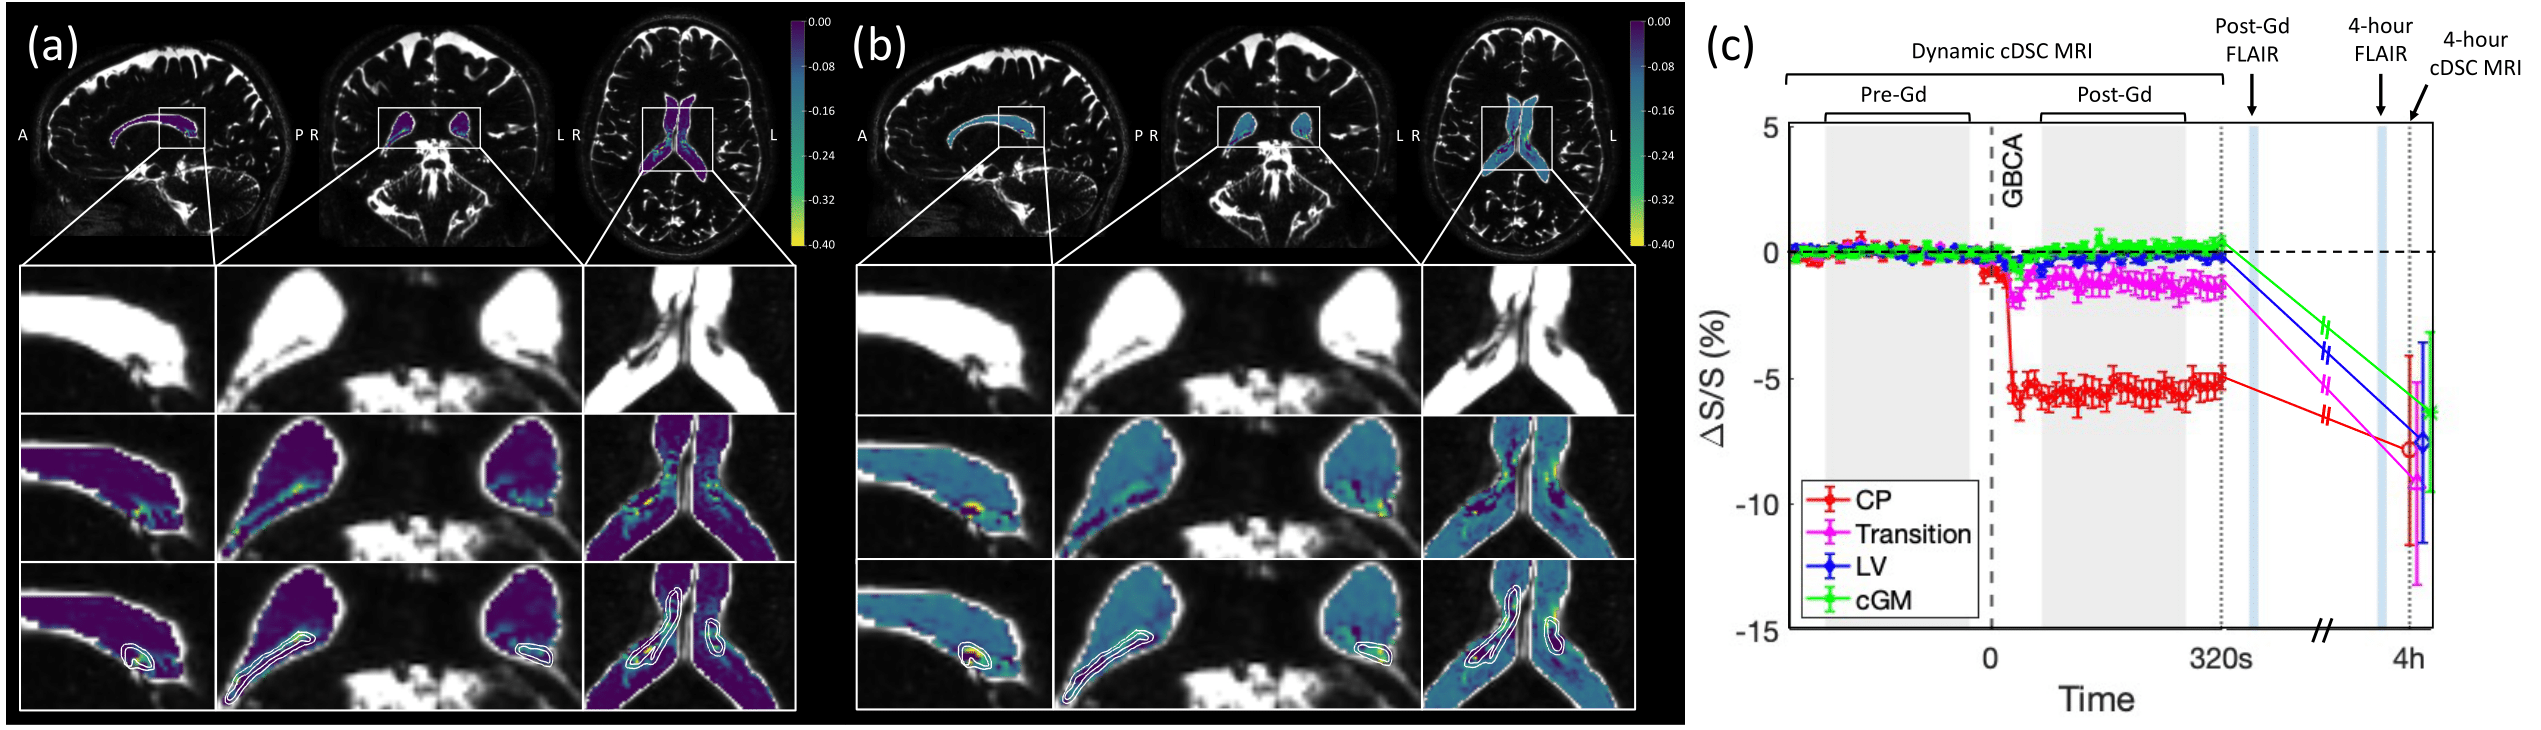
Figure 2. cDSC MRI. (a) Representative ΔS/S maps after GBCA administration in the lateral ventricle (including the CP) from a healthy human subject. Second row: pre-GBCA cDSC images. Third row: cDSC images overlaid with ΔS/S in the lateral ventricle. Fourth row: the CP and transition area are outlined with white contours. (b) 4-hours post-GBCA maps. (c) Average ΔS/S time courses from all healthy subjects.
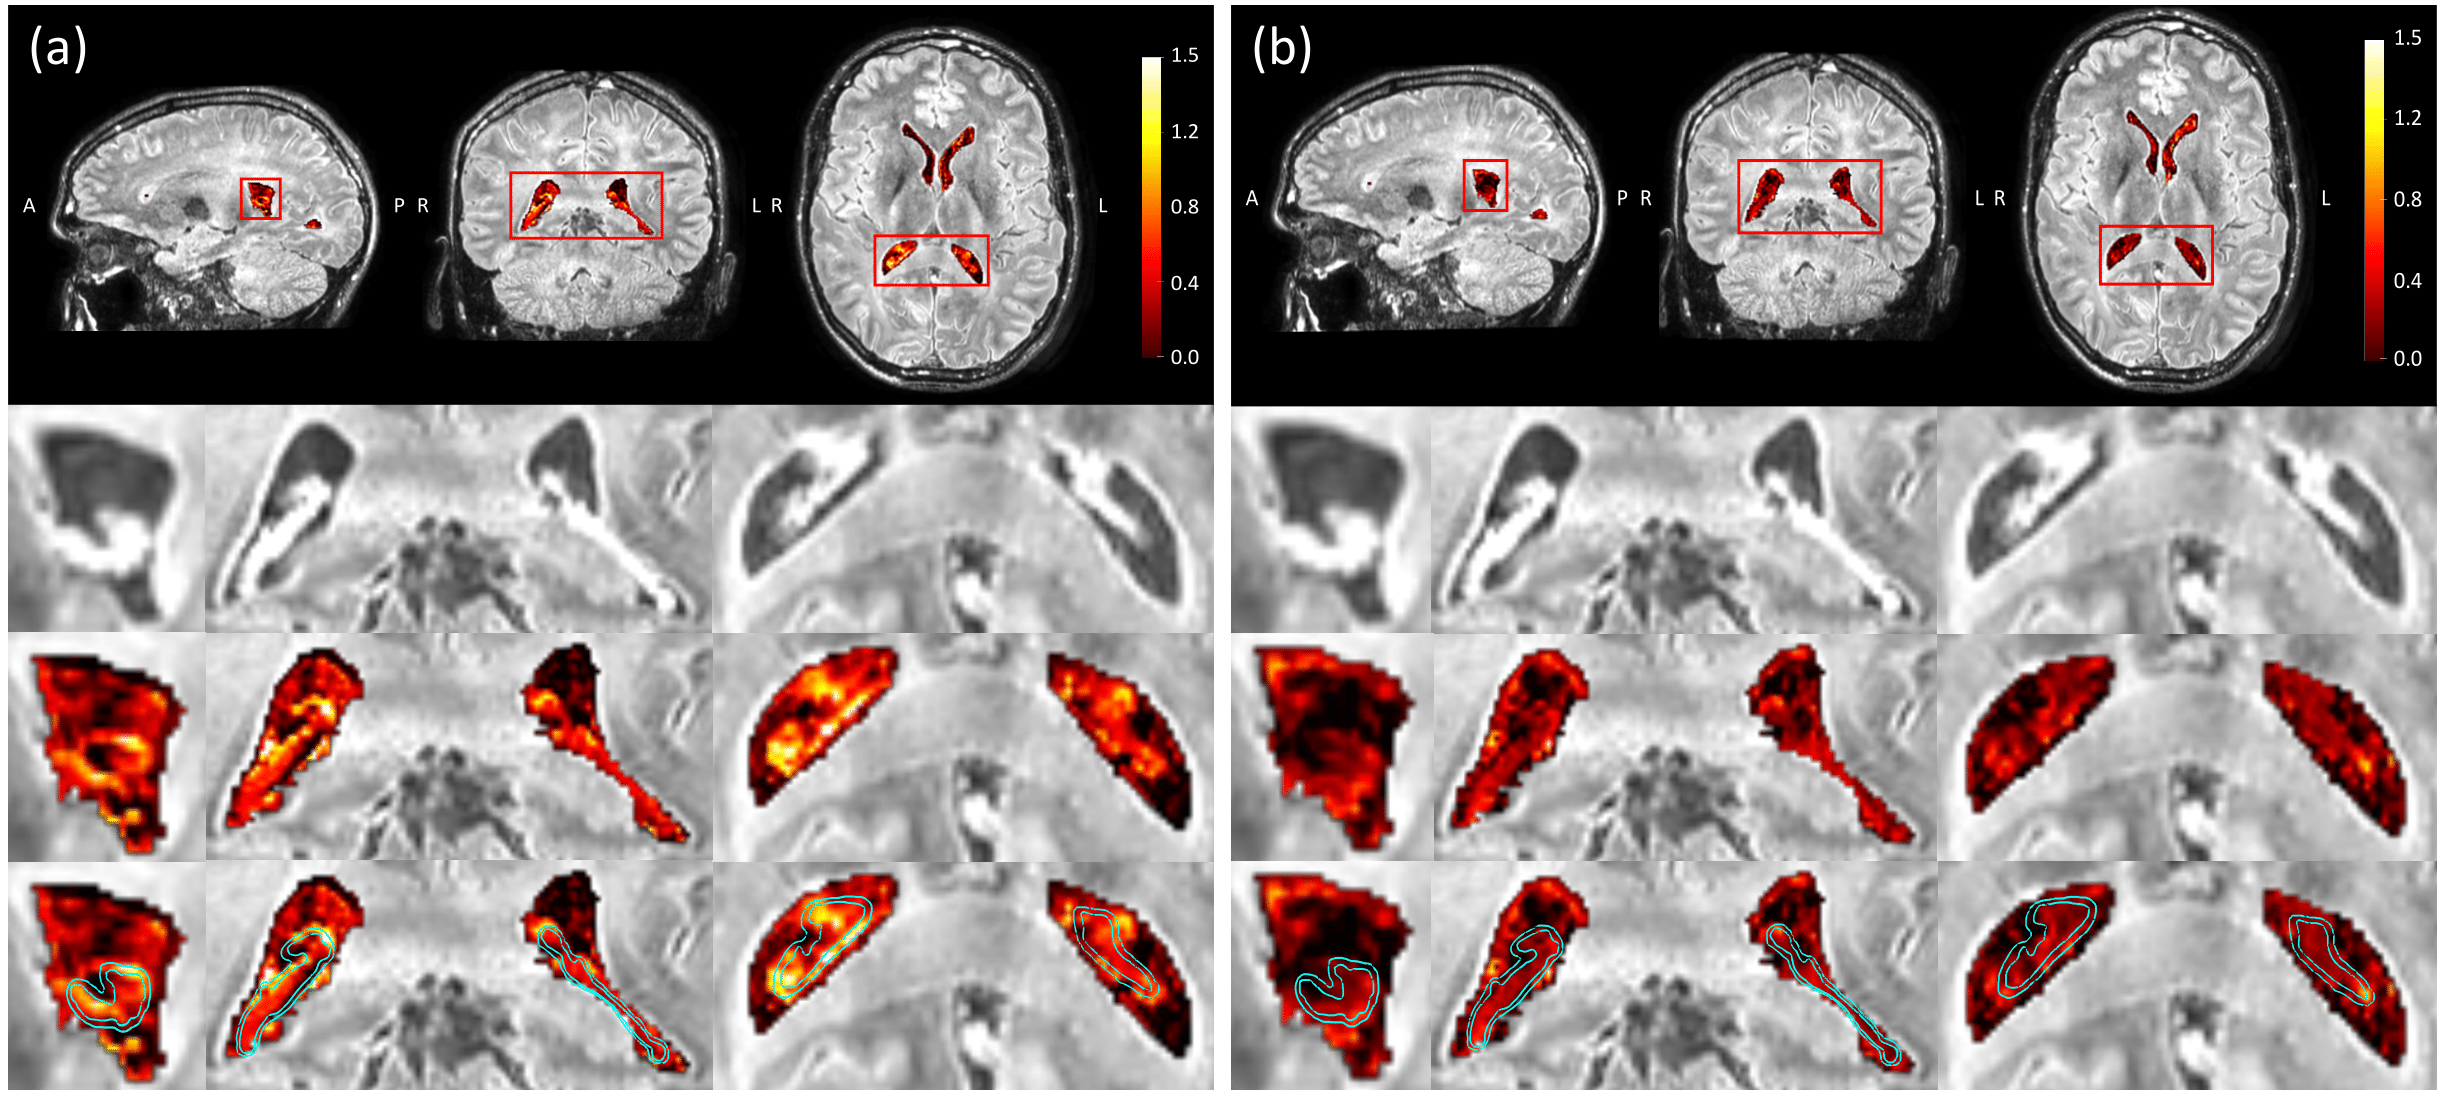
Figure 3. FLAIR MRI. (a) Representative ΔS/S maps after GBCA administration in the lateral ventricle (including the CP) from a healthy human subject. Second row: post-GBCA FLAIR images. Third row: FLAIR images overlaid with ΔS/S in the lateral ventricle. Fourth row: the CP and transition area were outlined with cyan contours. (b) 4-hours post-GBCA maps.
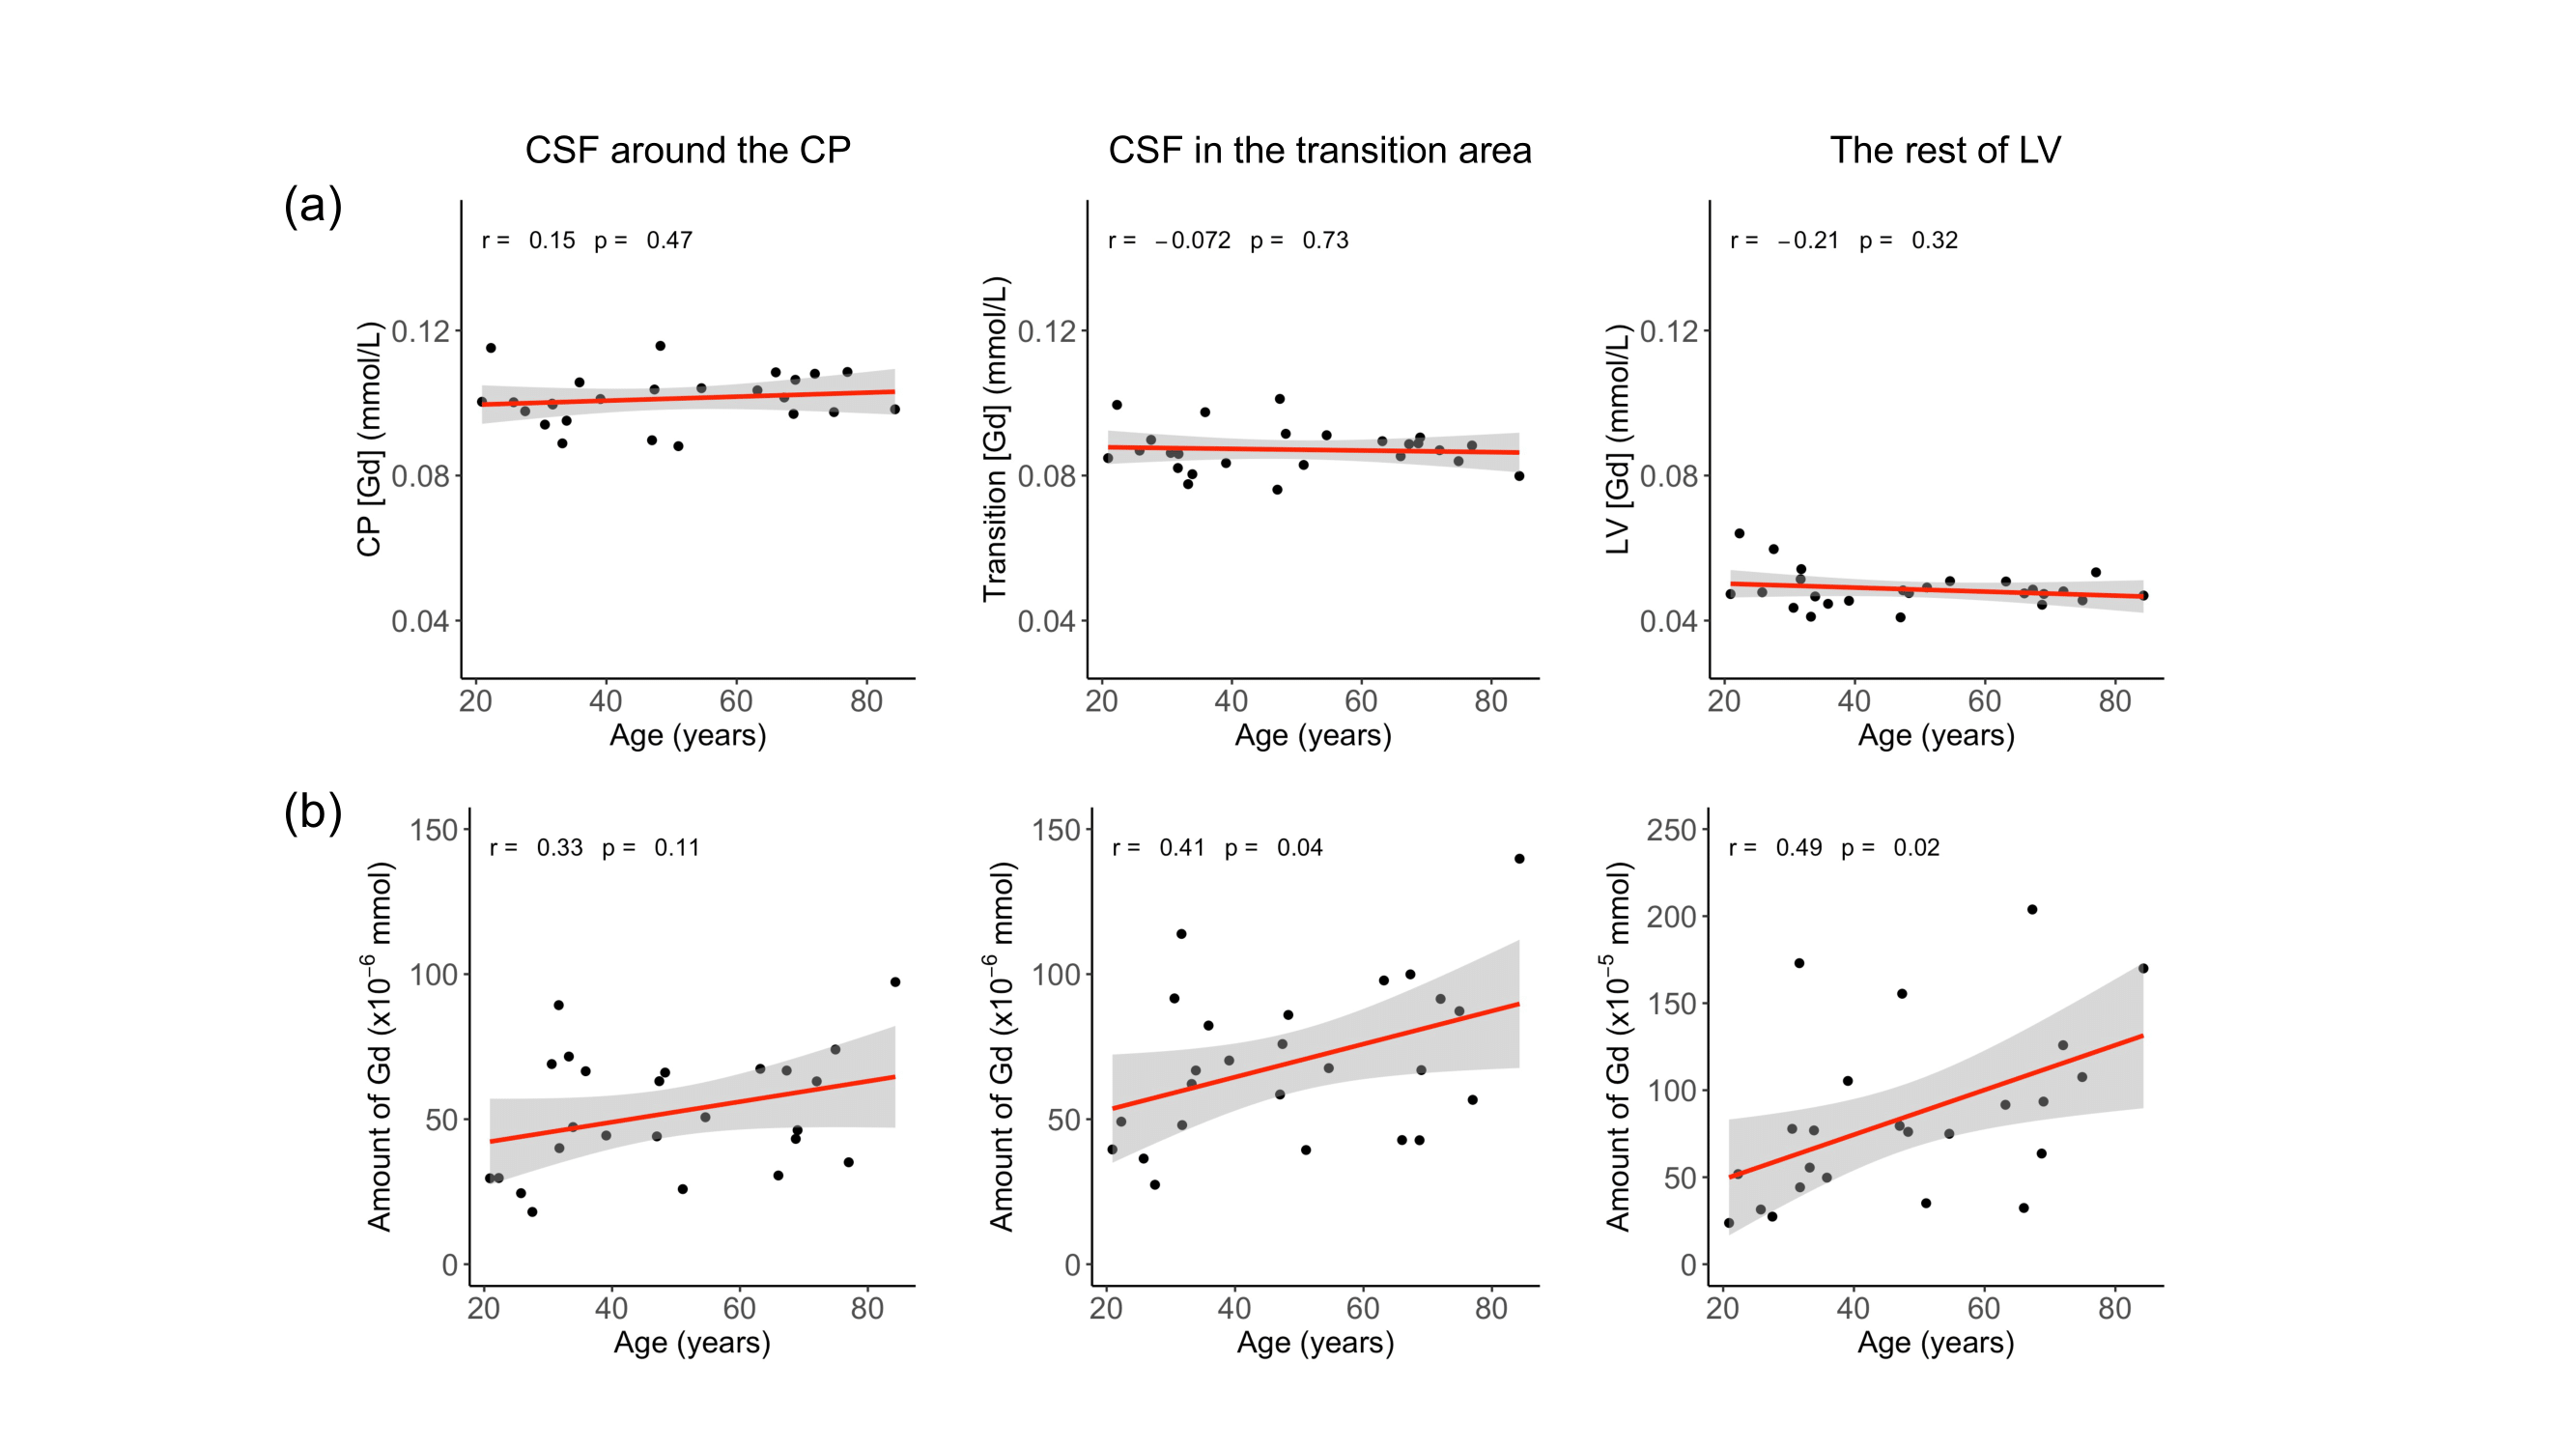
Figure 4. Correlation between GBCA concentration and age during immediate post-GBCA period in all subjects (n = 25) while controlling for GBCA dosage in each subject (based on body weight). (a) The GBCA concentration ([Gd], mmol/L) estimated from cDSC MRI images did not show significant correlation with age. (b) The product of [Gd] and CSF volume, which represents the amount of GBCA in the region (mmol) showed a significant positive correlation with age.
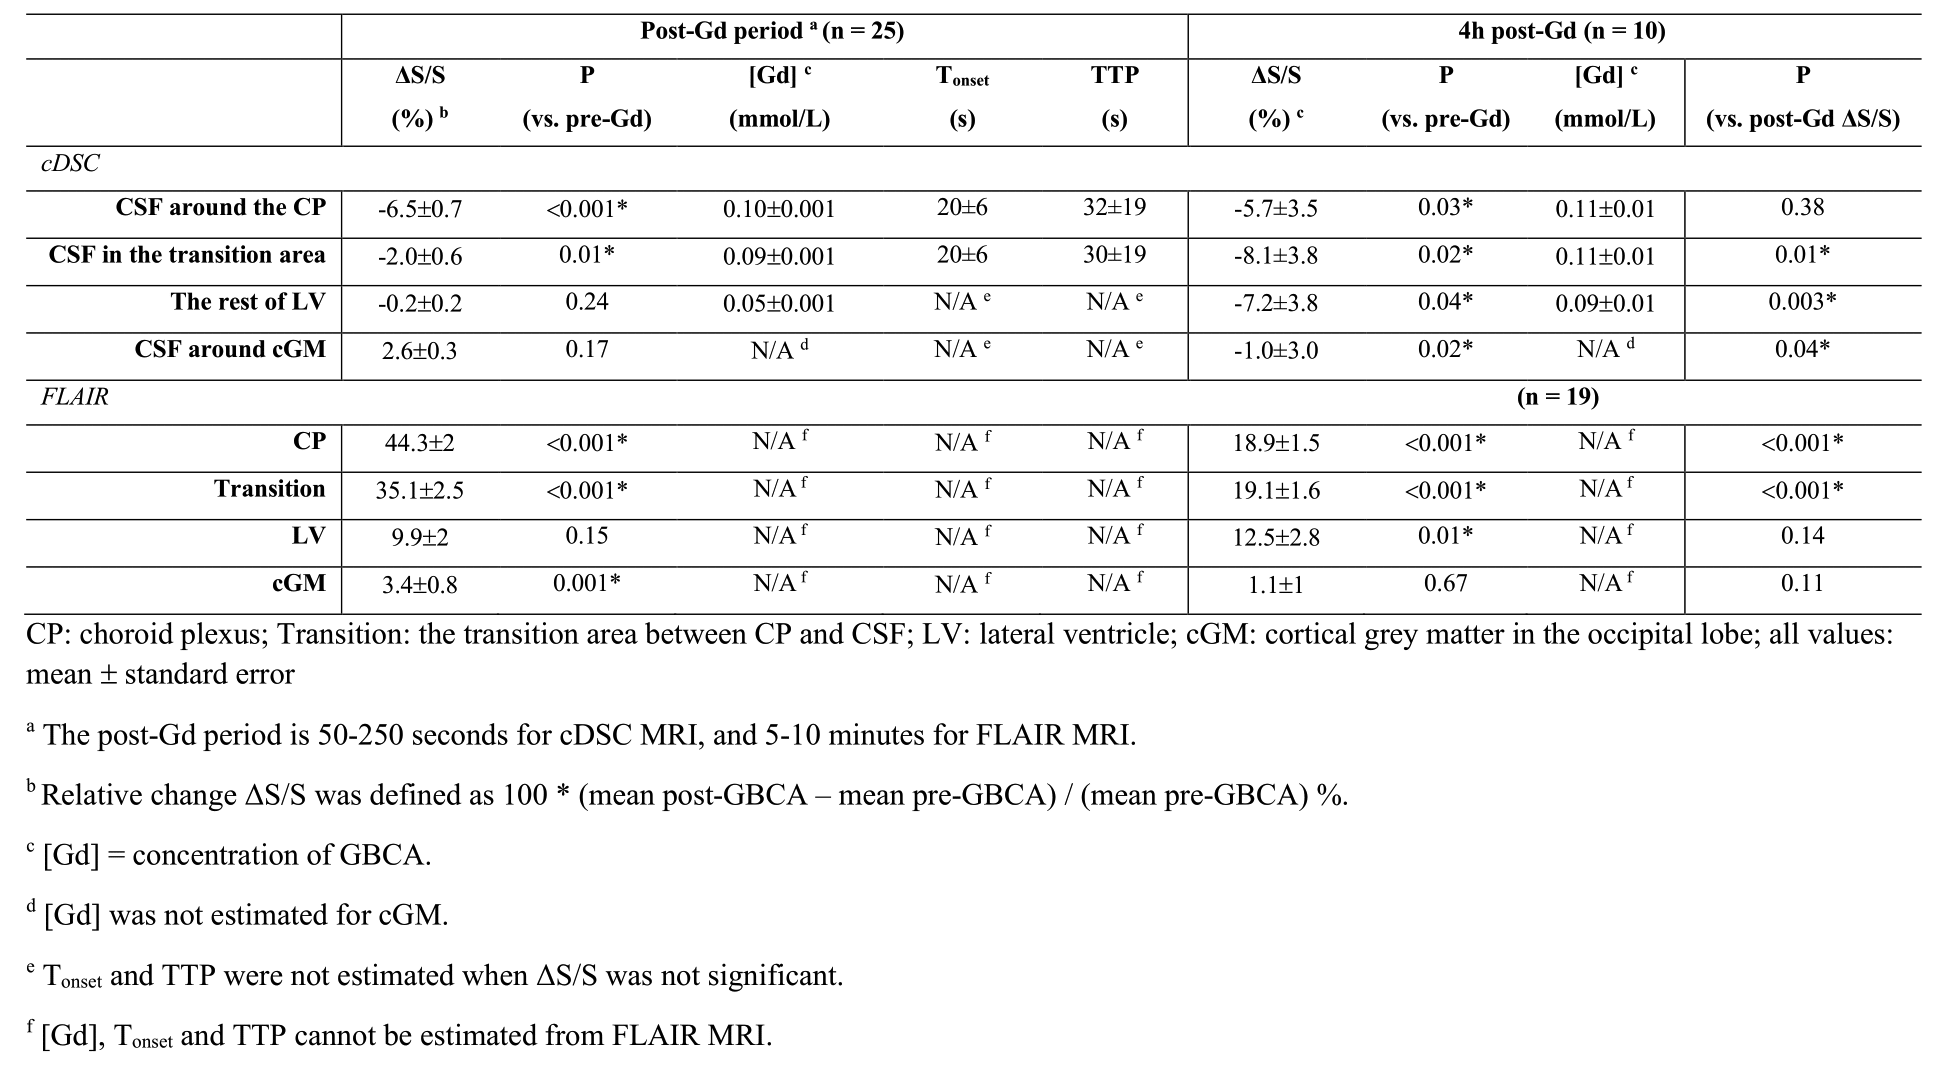
Table 1: Quantitative results measured by cDSC and FLAIR MRI from all healthy human subjects.