0033
MRI study of enlarged choroid plexus in patients with spinocerebellar ataxia type 3.1Department of Radiology, Southwest Hospital, Army Medical University (Third Military Medical University), Chongqing 400038, China., Chongqing, China, 27T Magnetic Resonance Imaging Translational Medical Center, Southwest Hospital, Army Medical University (Third Military Medical University), Chongqing 400038, China., Chongqing, China, 3MR Research Collaboration Team, Siemens Healthineers Ltd., Wuhan 430000, China, Wuhan, China, 4State Key Laboratory of Brain and Cognitive Science, Beijing MR Center for Brain Research, Institute of Biophysics, Chinese Academy of Sciences, Beijing 100000, China, Beijing, China
Synopsis
Keywords: Other Neurodegeneration, Brain, spinocerebellar ataxia type 3
Motivation: The role of cerebral immune and homeostatic structures of choroid plexus (CP) in SCA3 patients remains elusive.
Goal(s): The objective of this study is to investigate the volumetric changes in the choroid plexus.
Approach: Whole brain of SCA3 patients was imaged using a 3T MRI scanner and the volume of CP was analyzed.
Results: The findings revealed that CP volume was significantly larger in the SCA3 group compared to normal control group, exhibiting a positive correlation with both the number of ATXN3 repeats and scores of motor function abnormalities.
Impact: The abnormal change of CP volume may serve as a new marker for distinguishing SCA3 patients
Introduction
Spinocerebellar ataxia type 3/Machado-Joseph disease (SCA3/MJD), also known as Machado-Joseph disease (MJD), is the most common hereditary ataxia disease around world [1]. The pathogenic cause of this disease lies in the expansion of the ATXN3 gene fragment (encoding ataxin-3 protein) in exon 10 of the long arm of chromosome 14 and affects approximately one in a hundred thousand patients. In traditional studies, morphological measurements based on MRI voxels have demonstrated significant atrophy of the cerebellum, brainstem, thalamus, and basal ganglia in SCA3 patients [2]. However, the role of cerebral immune and homeostatic structures like choroid plexus (CP) in SCA3 patients remains unknown. It is well-established that CP plays an important role in the cerebrospinal fluid (CSF) function, which approximately 70% of human brain CSF is secreted by the CP, and the CSF abnormal function exhibits a strong correlation with SCA3 patients. Thus, this study aims to investigate the potential abnormal change of CP in the SCA3 patients and its correlation with both the number of ATXN3 repeats and the clinical manifestations.Methods
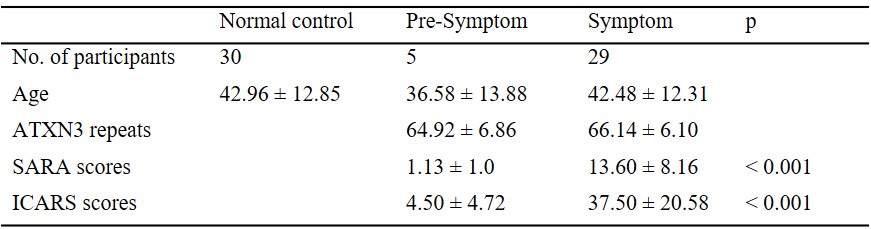
This study recruited 64 confirmed SCA3 patients (the ATXN3 fragment repeat numbers ranging from 52 to 91) and 50 matched normal controls. All participants underwent scale assessments conducted by professional neuropsychologists. The Scale for the Assessment and Rating of Ataxia (SARA) was utilized to evaluate the level of ataxia in SCA3 patients, with a score below 3 indicating pre-symptom and a score of 3 or higher indicating symptom. Additionally, the International Cooperative Ataxia Rating Scale (ICARS) was also employed to assess the severity of ataxia in SCA3 patients; higher scores indicate more severe symptoms. Since normal controls did not exhibit any symptoms of ataxia, they were not subjected to SARA and ICARS testing. Table 1 listed the comprehensive information, including SARA and ICATS results of all participants. All participants underwent a three-dimensional magnetization-prepared rapid acquisition gradient-echo (MPRAGE) sequence scan at 3T MAGNETOM Trio scanner (Siemens Healthcare Erlangen, Germany) to obtain high-resolution sagittal T1-weighted anatomical images. The scanning parameters were as follows: TR 1900 ms, TE 2.52 ms, flip angle 9º, slice thickness 1 mm, matrix size 256×256, voxel size 1 mm × 1 mm × 1 mm, and total number of 176 slices. The entire brain structure was extracted based on the Destrieux-atlas. The CP structure segmentation and volume measurements were performed using Freesurfer 6.0 software, and the whole-brain volume was also computed and utilized as a covariate in all analysis. Two-sample t-tests were employed to compare differences in CP volume among the normal control, pre-symptom, and symptom groups. Partial correlation analysis was performed to examine the relationship between gene repeat number, SARA score, ICARS score, and CP volume in SCA3 patientsResults
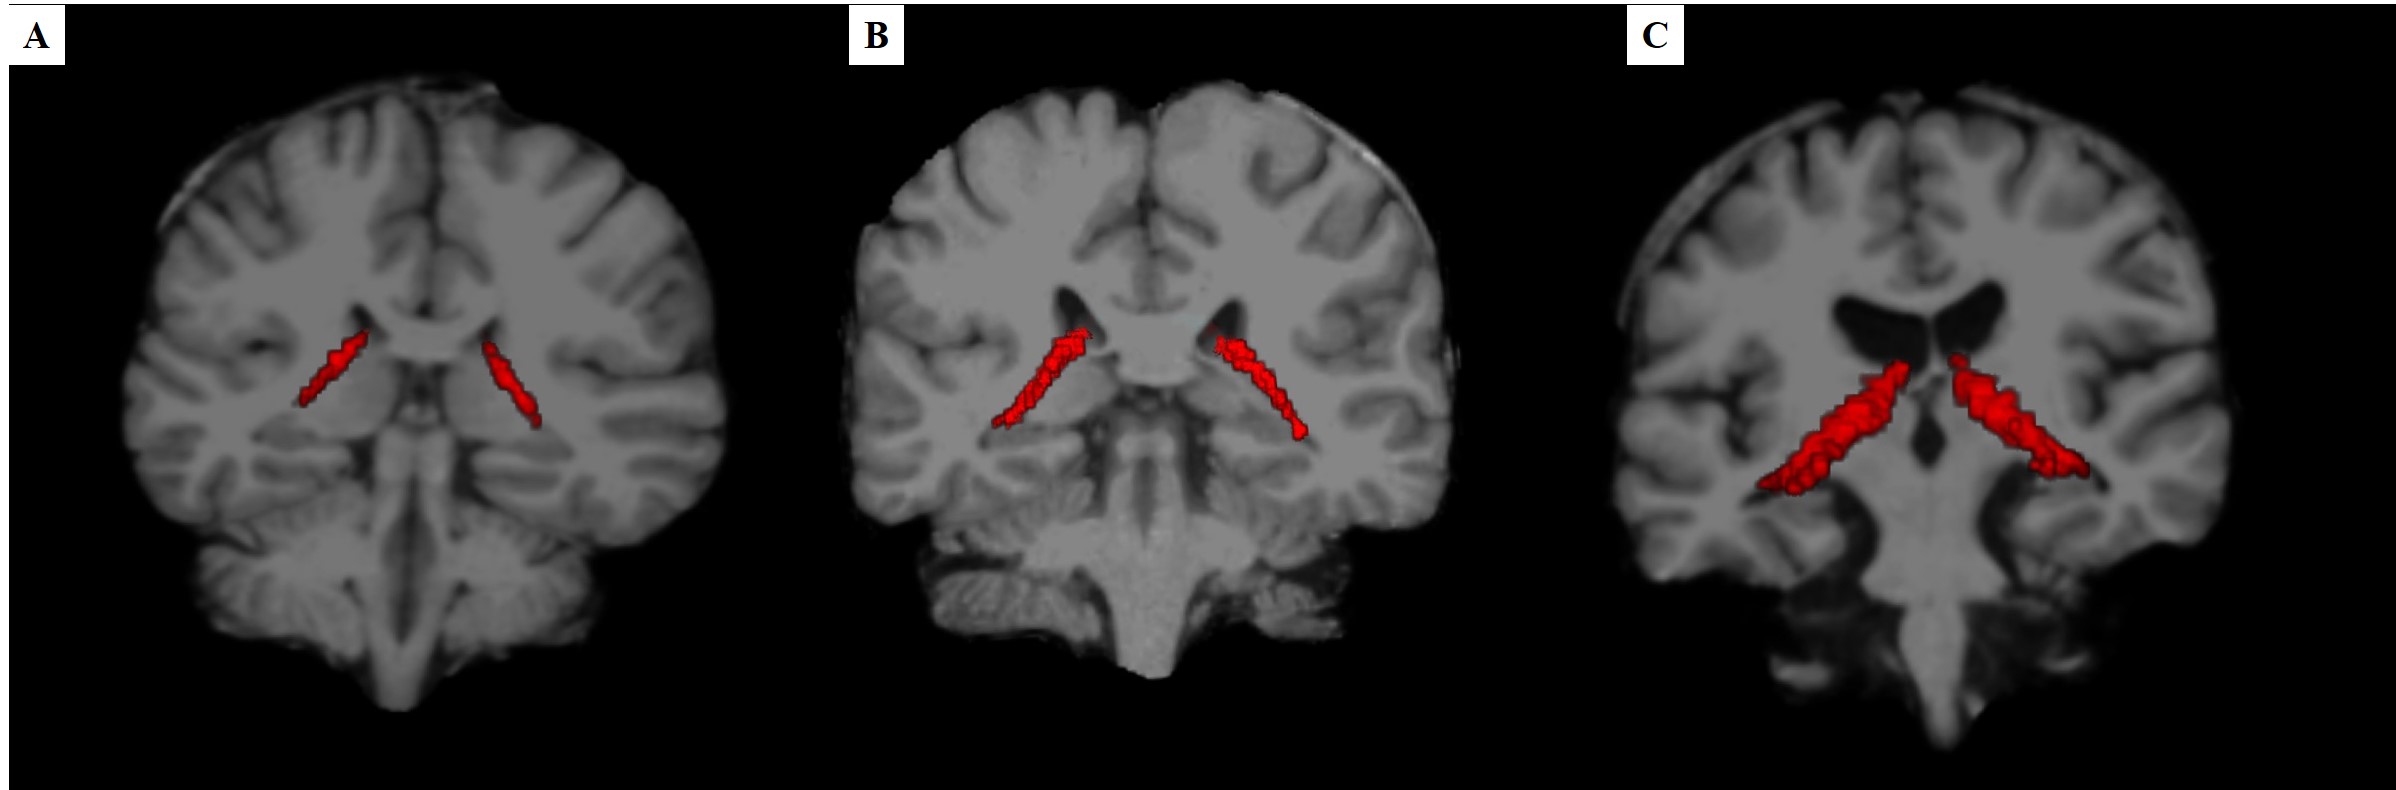
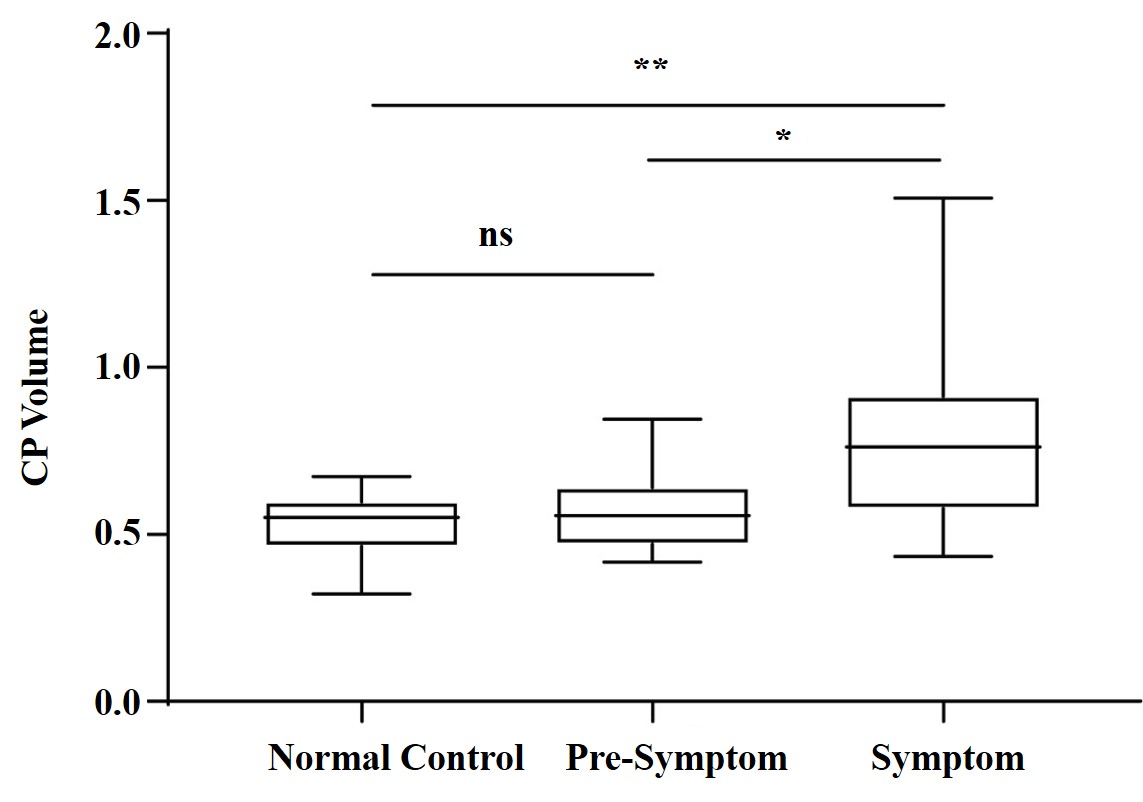
T1-weighted images and segmented CP regions were presented in Figure 1. The volume of CP regions was computed and analyzed based on the segmented results. Figure 2 demonstrates a significant increase of CP volume in the symptom group (0.75 ± 0.21) compared to the normal control group (0.53 ± 0.09). Moreover, the CP volume in the symptom group also exhibited a significant increase when compared to the pre-symptom group. The partial correlation analysis demonstrated that CP volume in SCA3 patients was positively correlated with the ATXN3 repeat number (r = 0.36, p = 0.007), SARA score (r = 0.40, p = 0.003), and ICARS score (r = 0.37, p = 0.005).Discussion/Conclusion
For the first time, we have demonstrated an increase of the CP volume in SCA3 patients using magnetic resonance imaging. Additionally, the SCA3 symptom group exhibited a significantly larger CP volume compared to the pre-symptom group. The observed increased CP volume was also found to be associated with a higher number of ATXN3 repeat lengths, as well as SARA and ICARS scores, indicating that greater abnormality in clinical motor symptoms is correlated with larger CP volume. These findings suggest that changes in CP volume may serve as a sensitive marker for distinguishing between pre-symptom and symptom groups of SCA3 patients, thereby contributing to our understanding of cerebrovascular alterations patterns in this condition. In the future, we believe that targeting the CP system holds promise for diagnosing, monitoring, and treating neurodegeneration associated with SCA3.Acknowledgements
NoReferences
1. Paulino, R. and C. Nóbrega, Autophagy in Spinocerebellar Ataxia Type 3: From Pathogenesis to Therapeutics. Int J Mol Sci, 2023. 24(8)
2. Guo, J., et al., Gray matter atrophy patterns within the cerebellum-neostriatum-cortical network in SCA3. Neurology, 2020. 95(22)
Figures