0028
The Correlation between Choroid Plexus and Protein Biomarkers in the Alzheimer’s Disease1College of Biomedical Engineering & Instrument Science, Zhejiang University, Hangzhou, China, 2Psychology, Beijing Normal University, Beijing, China, 3Biomedical Engineering, University of Virginia, Charlottesville, VA, United States
Synopsis
Keywords: Alzheimer's Disease, Alzheimer's Disease, choroid plexus
Motivation: Dysfunction of the glymphatic system is one of the possible causes of Alzheimer’s disease (AD). We hypothesize that the choroid plexus (CP), the major site of CSF secretion, is associated with the hallmarks of AD, Aβ and tau protein deposition.
Goal(s): to investigate the association between CP and hallmark proteins in the AD.
Approach: Based on the proposed CP segmentation pipeline, univariate regression and stepwise regression models were employed to analyse correlations between CP and AD.
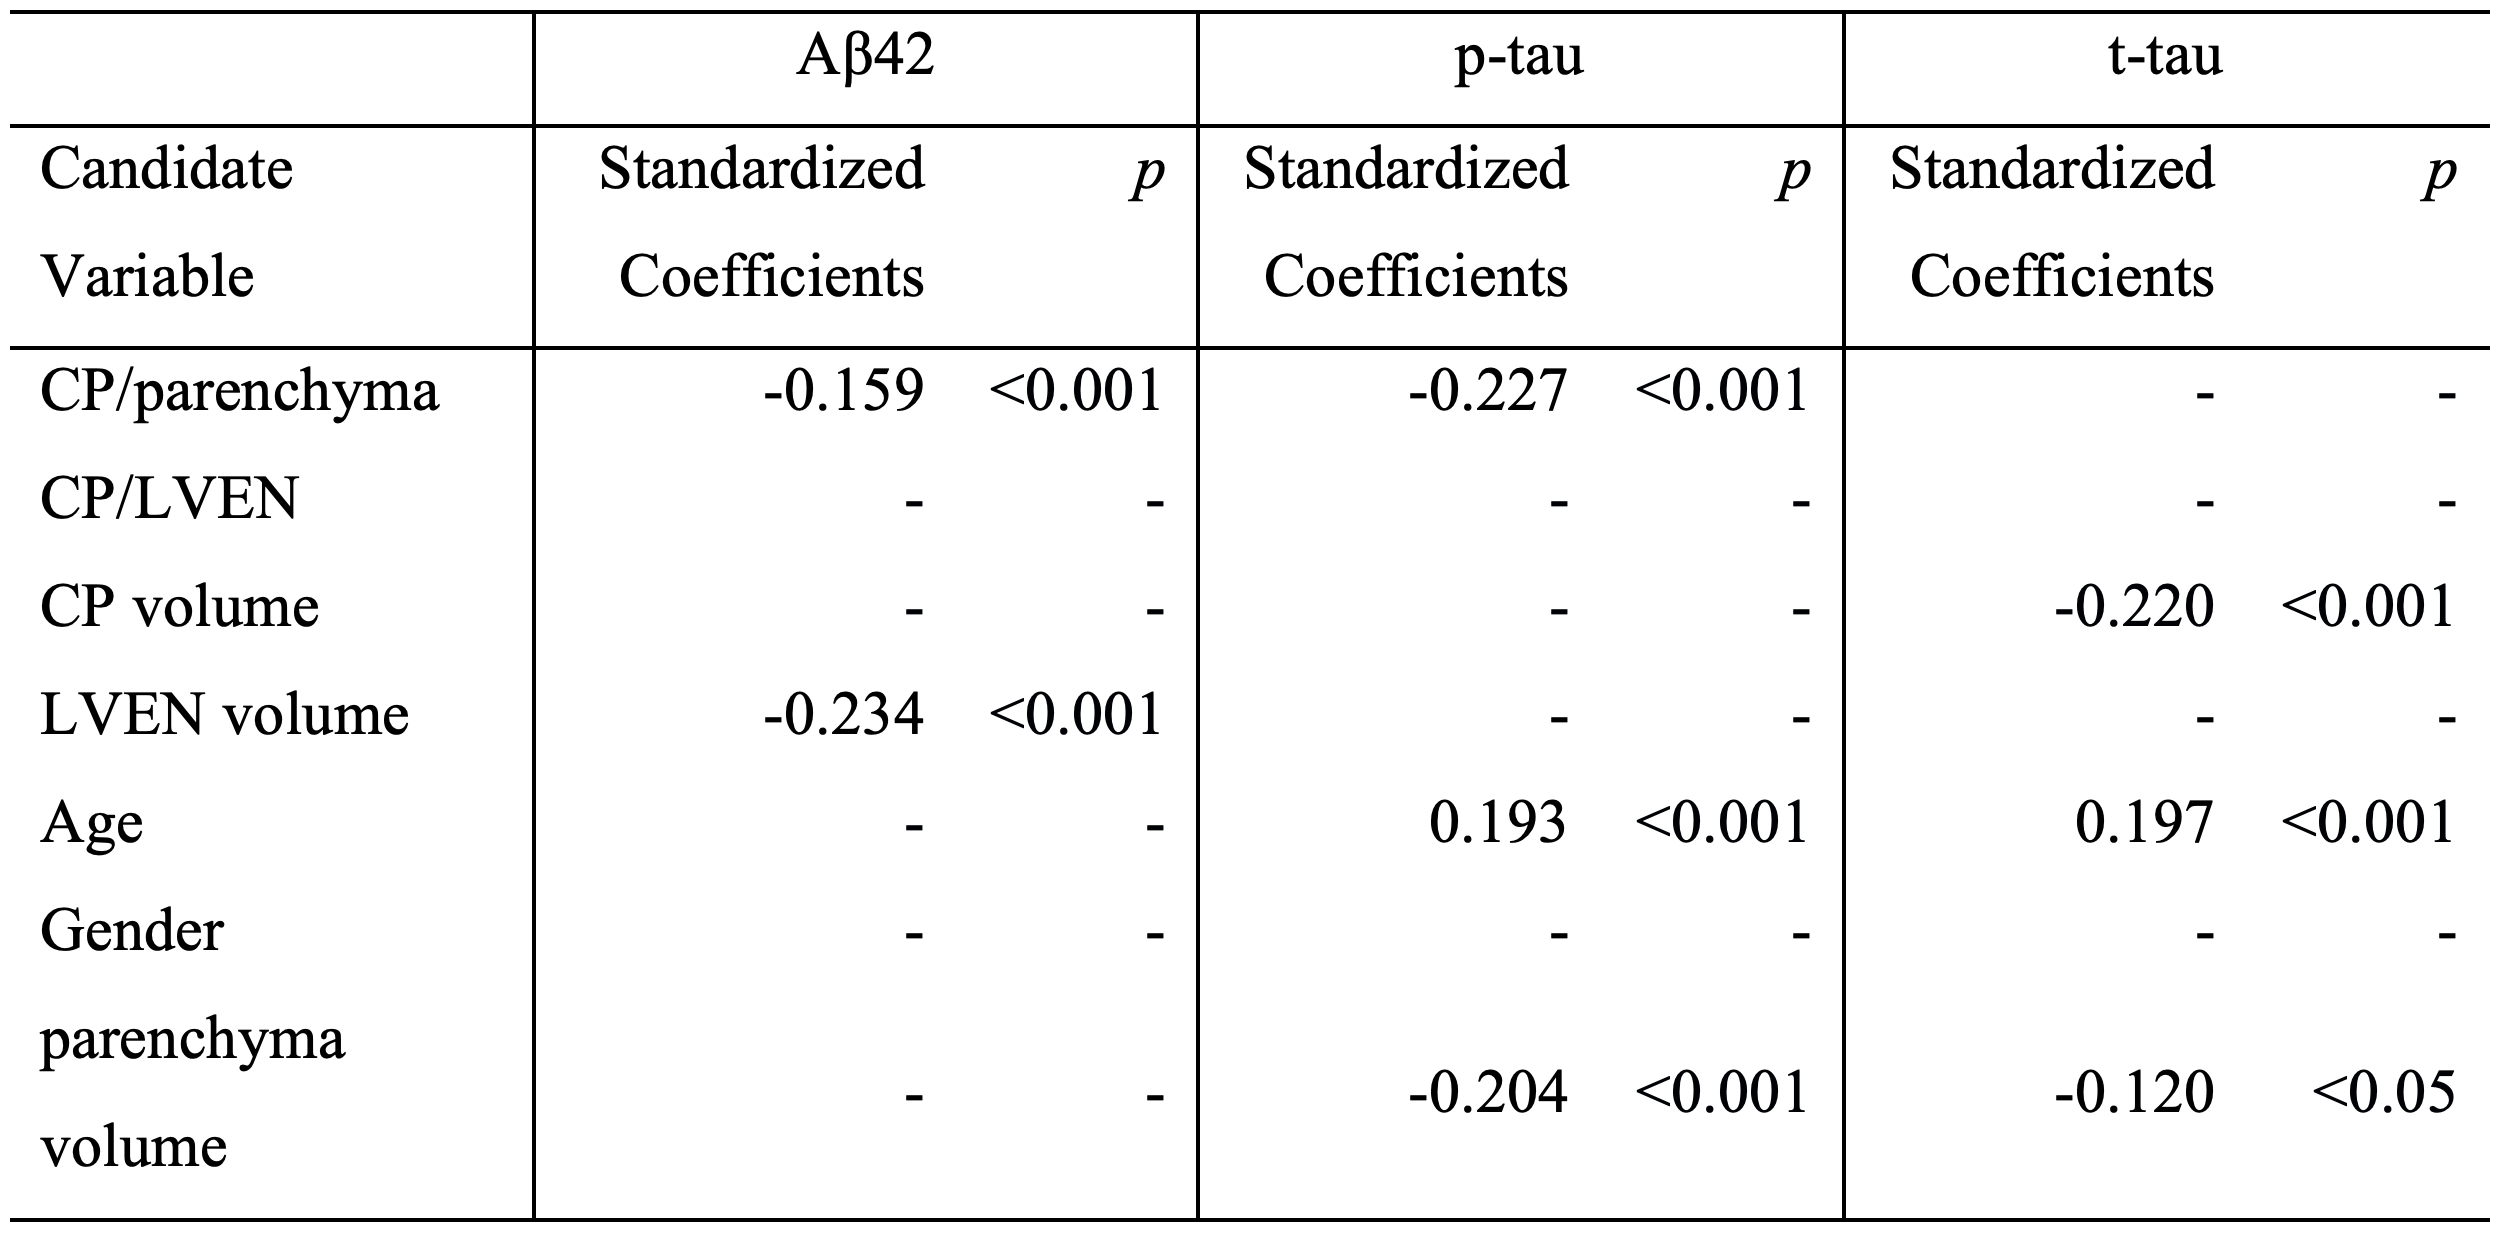
Results: Our work shows that the ratio between CP and parenchyma is correlated with Aβ42 and p-tau (p<0.001) and the CP volume is correlated with t-tau (p<0.001).
Impact: The proposed CP segmentation pipeline provided improved sensitivity to detect the correlations between CP/parenchyma ratio and Aβ42 and p-tau. This work may indicate the choroid plexus a possbile biomarker for AD.
Introduction
The hallmark of AD is amyloid-beta and tau protein depositions, which can be cleaned through the CSF circulation in the glymphatic system [1,2]. Meanwhile, the choroid plexus (CP), the major organ of CSF secretion, has been reported to be relevant to AD [3,4,5]. However, most CP studies relied on the FreeSurfer toolbox to measure the CP volume [4,5], which has been proven to be inaccurate. Consequently, the above studies may fail to detect relations between CP volume and AD protein biomarkers. In this study, we proposed a more accurate CP segmentation pipeline and demonstrated significant correlations between the CP and AD protein biomarkers.Methods
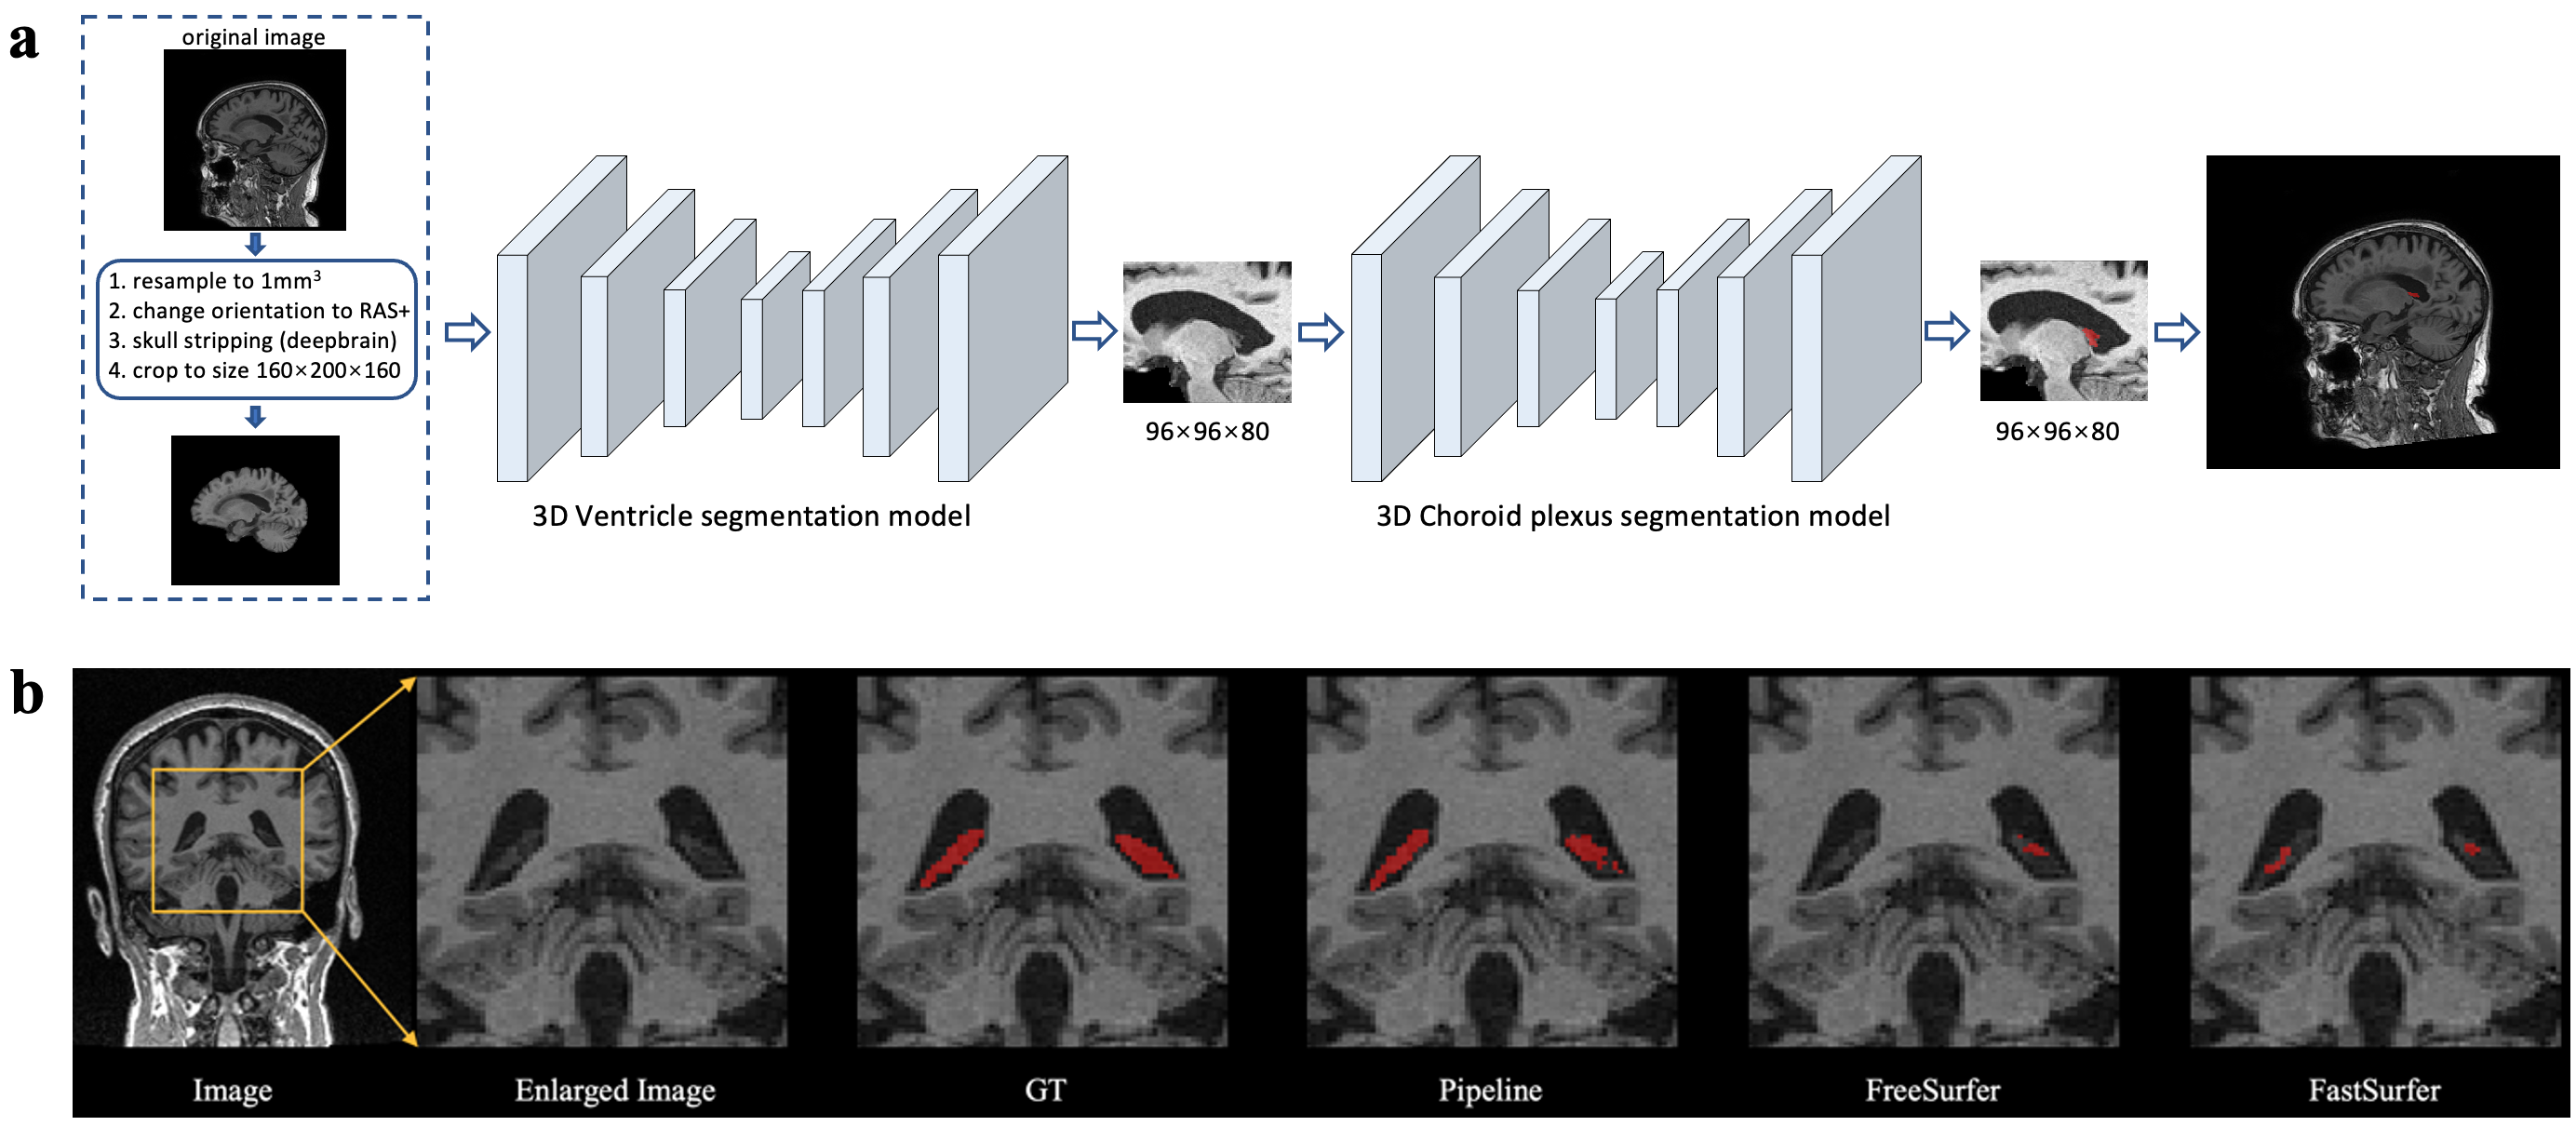
A total of 806 subjects (156 cognitively normal (CN), 95 significant memory concern (SMC), 272 early-mild cognitive impairment (EMCI), 155 late-mild cognitive impairment (LMCI), and 128 AD) were selected from the Alzheimer’s Disease Neuroimaging Initiative (ADNI) database. Baseline diagnostic records with 3T T1W MR images and complete CSF protein biomarker values (Aβ42, t-tau, and p-tau) were extracted.A CP segmentation pipeline was proposed, including image standardization, skull stripping, lateral ventricle (LVEN) segmentation, and CP segmentation (Figure 1a). T1W images were reoriented to the RAS coordinate system and resampled to 1 mm3 isotropic. Then the deepbrain toolbox [6] was employed for skull stripping using a threshold of 0.5 and a brain region patch of 160×200×160 voxels was extracted.
The LVEN and CP segmentation was implemented based on a refined 3D U-Net [7,8]. A residual connection and a PReLU activation function were adopted in the convolution block. The deep learning models’ parameters were updated by the dice loss function. The LVEN model was trained and validated on the MICCAI 2012 challenge dataset [9] and 15 in-house labeled ADNI images. The CP segmentation model was trained and validated on 50 manually labeled ADNI images. In addition, the proposed model was tested on a separate test dataset, which consisted of 20 subjects with each subject labeled by 5 radiologists manually. As benchmarks, FreeSurfer and FastSurfer [10] were employed. The parenchyma volume of the brain was computed by the FreeSurfer which excludes cerebellum, brain stem, CSF, ventricle, and CP.
The mean values of CP volume of the CN, SMC, EMCI, LMCI, and AD groups were compared with the one-way ANOVA test. The relationship between the CP and the levels of proteins (Aβ42, t-tau, and p-tau) was analyzed by linear regression. A univariate linear regression model was established, in which the protein level and CP volume were the dependent variables and independent variable respectively. Furthermore, CP volume, CP/parenchyma ratio, CP/LVEN ratio, LVEN volume, age, gender, and parenchyma volume were chosen as candidate variables to construct a stepwise regression model to find the most significant model for each protein.
Results
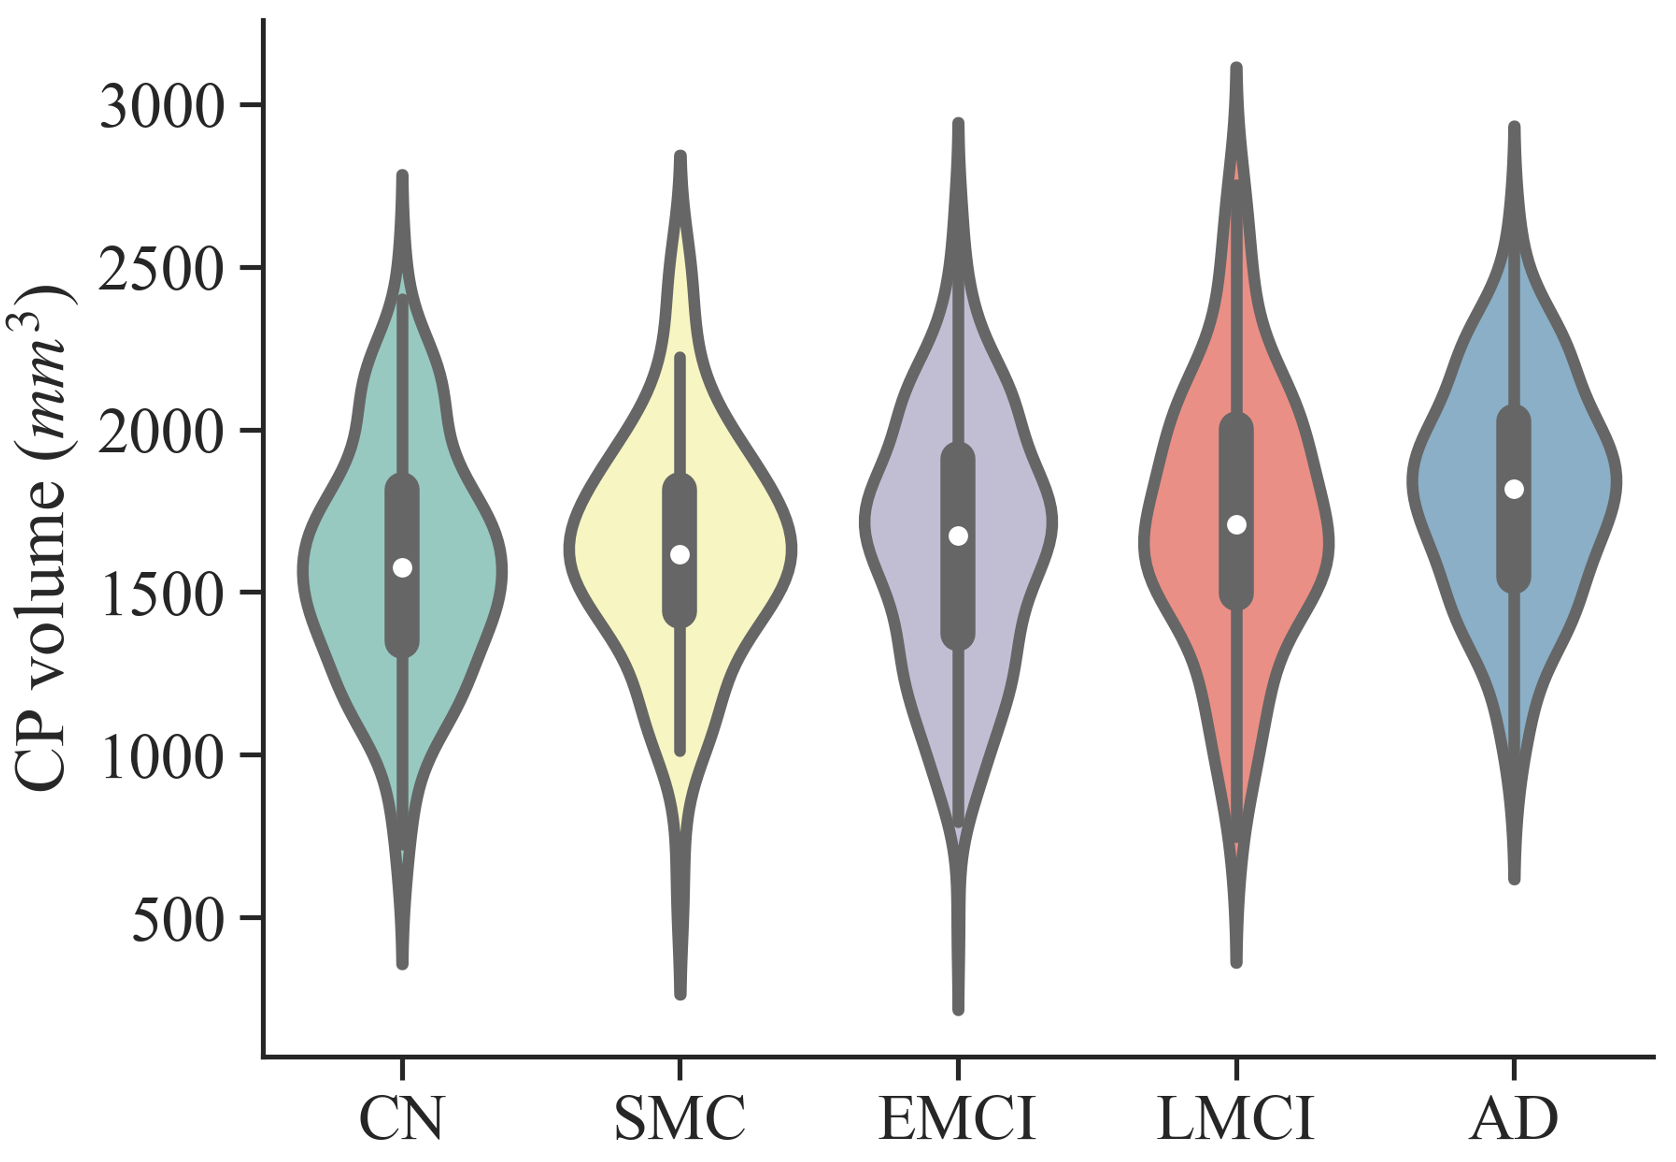
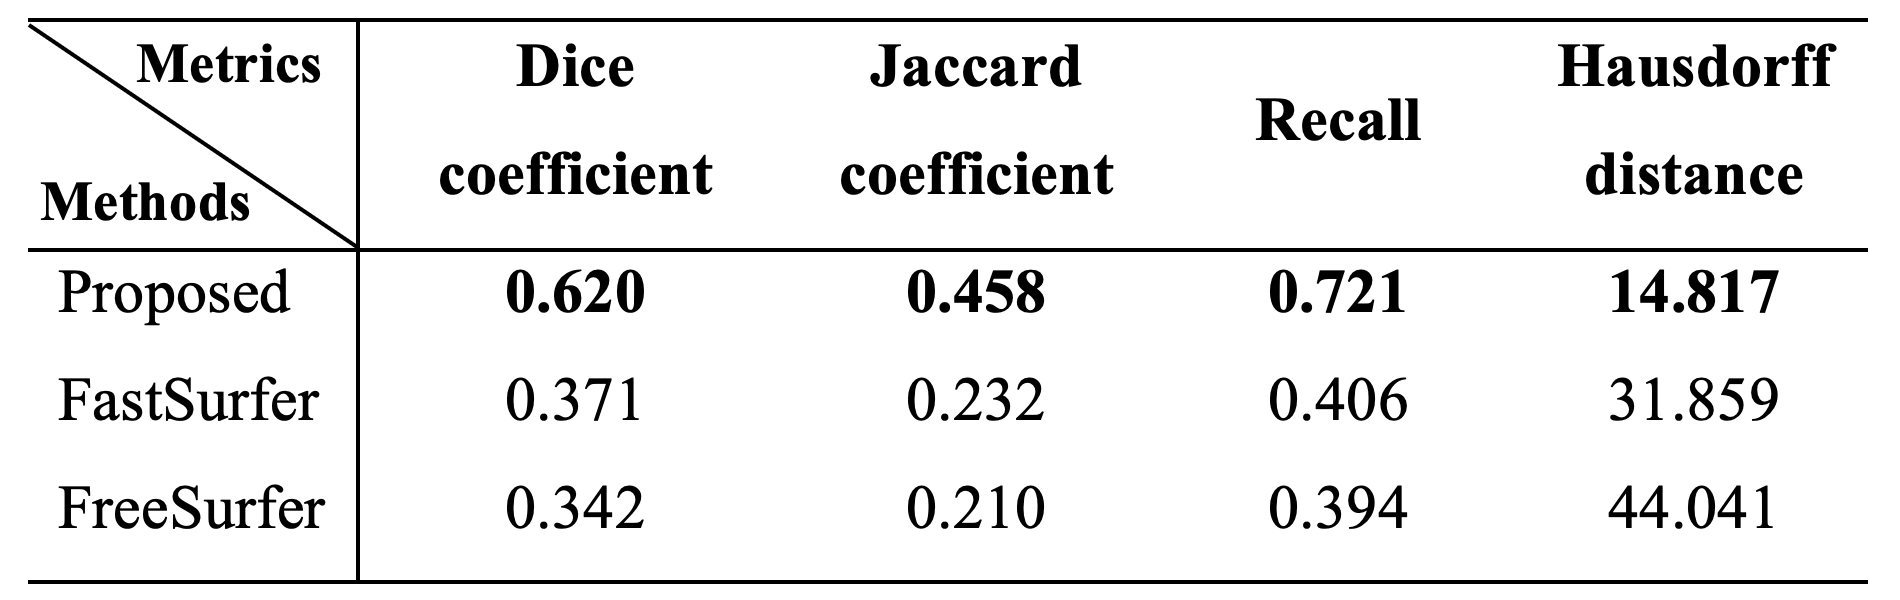
The dice coefficients of our LVEN and CP segmentation models on five-fold cross-validation reached an average of 0.825 and 0.739, respectively. On the test dataset, average dice coefficients were 0.620, 0.371, and 0.342 in the proposed segmentation pipeline, FastSurfer, and FreeSurfer compared to the ground truth voted by 5 radiologists (Table 1 and Figure 1b).The CP volumes of CN volunteers, SMC patients, EMCI patients, LMCI patients, and AD patients are 1583.9 ± 362.3 mm3, 1629.3 ± 355.9 mm3, 1652.5 ± 391.7 mm3, 1724.4 ± 414.7 mm3 and 1800.2 ± 343.0 mm3. Means of 5 groups were significantly different (F=6.973, p<0.001) and AD patients had significantly larger CP volume than CN, SMC, and EMCI in the Tukey post hoc test. The distribution of the CP volume for 5 groups is shown in Figure 2.
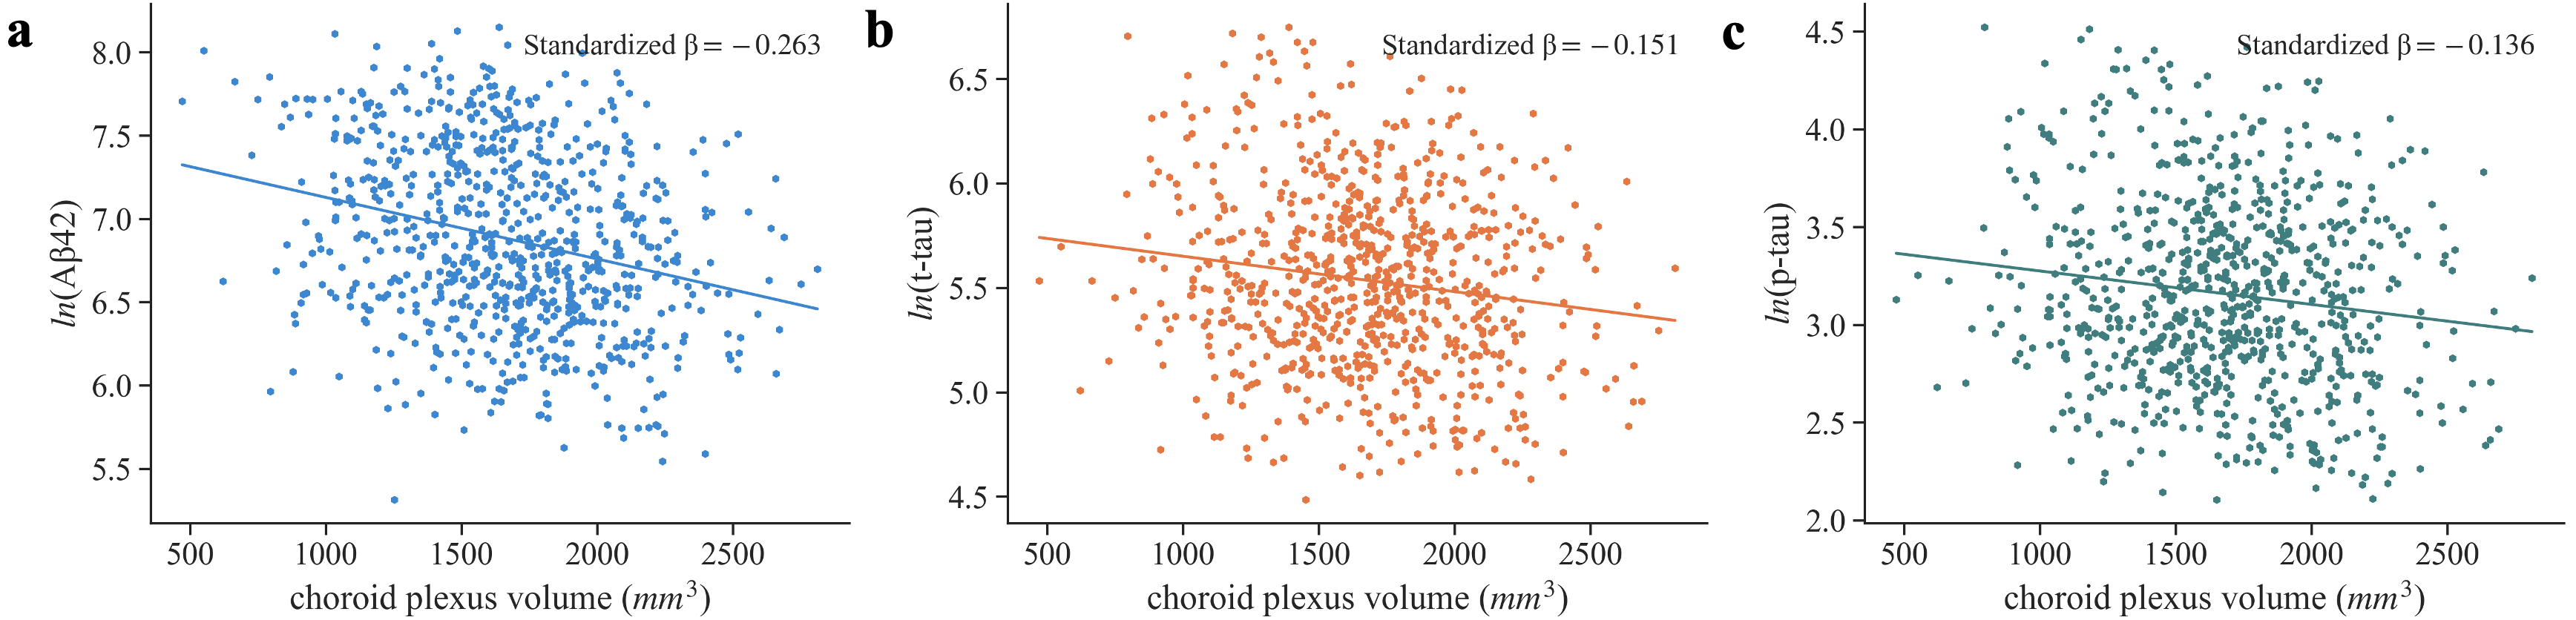
In each univariate model, a significant linear relation was found between CP volume and corresponding protein level (p<0.001) (Figure 3). After excluding insignificant variables, the final regression models are presented in Table 2. CP/parenchyma ratio exhibited significant correlations with Aβ42 and p-tau while CP volume was correlated with t-tau.
Discussion
This study demonstrated the significant correlation between the CP and AD protein biomarkers. This results were consistent with previous works on the relationship between CP volume and Aβ42, t-tau, and p-tau proteins. In addition, the CP/parenchyma ratio correlated with Aβ42 and p-tau are reported here for the first time. The improved sensitivity may have benefited from the proposed CP segmentation pipeline, which showed superior accuracy compared with FreeSurfer and FastSurfer. It should be noted that our proposed pipeline focuses on the CP located in the LVEN. The third ventricle and the fourth ventricle were not included. Other characteristics of the CP, such as curvature and dynamic movement are also worth investigating in the future.Acknowledgements
This work is supported by the National Key R&D Program of China (2022ZD0118004), the Alzheimer's Association (AARF-18-566347), Zhejiang Provincial Natural Science Foundation of China (LGJ22H180004, 202006140, and 2022C03057), and the MOE Frontier Science Center for Brain Science & Brain-Machine Integration, Zhejiang University.References
[1] Iliff JJ, Wang M, Liao Y, Plogg BA, Peng W, Gundersen GA, Benveniste H, Vates GE, Deane R, Goldman SA, Nagelhus EA. A paravascular pathway facilitates CSF flow through the brain parenchyma and the clearance of interstitial solutes, including amyloid β. Science translational medicine. 2012 Aug 15;4(147):147ra111.
[2] Lohela TJ, Lilius TO, Nedergaard M. The glymphatic system: implications for drugs for central nervous system diseases. Nature Reviews Drug Discovery. 2022 Oct;21(10):763-79.
[3] Zhao L, Feng X, Hu Y, Wu D, Meyer CH, Alsop DC. Changes of Choroid Plexus Volume in Alzheimer’s Patients. In Proceedings of the International Society for Magnetic Resonance in Medicine 2021(2374).
[4] Tadayon E, Pascual-Leone A, Press D, Santarnecchi E, Alzheimer's Disease Neuroimaging Initiative. Choroid plexus volume is associated with levels of CSF proteins: relevance for Alzheimer's and Parkinson's disease. Neurobiology of aging. 2020 May 1;89:108-17.
[5] Choi JD, Moon Y, Kim HJ, Yim Y, Lee S, Moon WJ. Choroid plexus volume and permeability at brain MRI within the Alzheimer disease clinical spectrum. Radiology. 2022 May 17:212400.
[6] Deep Learning tools for brain medical images. https://github.com/rockstreamguy/deepbrain
[7] Çiçek Ö, Abdulkadir A, Lienkamp SS, Brox T, Ronneberger O. 3D U-Net: learning dense volumetric segmentation from sparse annotation. In International conference on medical image computing and computer-assisted intervention 2016 Oct 17 (pp. 424-432). Springer, Cham
[8] Zhao L, Feng X, Meyer CH, Alsop DC. Choroid plexus segmentation using optimized 3D U-Net. In 2020 IEEE 17th International Symposium on Biomedical Imaging (ISBI) 2020 Apr 3 (pp. 381-384). IEEE.
[9] http://www.neuromorphometrics.com/2012_MICCAI_Challenge_Data.html
[10] Henschel L, Conjeti S, Estrada S, Diers K, Fischl B, Reuter M. Fastsurfer-a fast and accurate deep learning based neuroimaging pipeline. NeuroImage. 2020 Oct 1;219:117012.
Figures