0027
MRI-based habitats to quantify tumor microenvironment normalization in glioblastoma: validation with histology and transcriptomics1Radiology, General Hospital of Western Theater Command of PLA, Chengdu, China, 2Radiology, The First Affiliated Hospital of Chongqing Medical University, Chongqing Medical University, Chongqing, China
Synopsis
Keywords: Tumors (Post-Treatment), Quantitative Imaging, Habitat imaging
Motivation: The lack of in vivo and noninvasive biomarkers to quantify tumor microenvironment (TME) normalization hinders the evaluation of bevacizumab (BEV) therapy response in glioblastoma (GBM).
Goal(s): To quantify TME normalization during BEV therapy in GBM by conventional and multiparametric MRI (mpMRI).
Approach: The MRI-based habitats were generated by Gaussian mixture model in patient-derived GBM models. Spatial-paired analyses of MRI, histology, and single-cell RNA sequencing were performed to validate the effetiveness of habitats.
Results: A total of eight habitats were generated to quantify TME normalization spatiotemporally. Habitat7 was strongly correlated with TME normalization-associated phenotypes including pericyte coverage, hypoxia and immune cell infiltration.
Impact: We developed and validated a quantitative mpMRI-based biomarker to characterize TME normalization in GBM. This may provide a new in vivo approach for precise evaluation of BEV therapy response in GBM noninvasively.
Introduction
Glioblastoma (GBM) is the most common and devastating brain tumor in adults. Bevacizumab (BEV) is an FDA-approved antiangiogenic drug for GBM therapy by normalizing tumor microenvironment (TME). GBM patients who manifest TME normalization during BEV therapy are predictive of better quality of life and prolonged survival. Histology is the standard methodology to evaluate TME normalization, but cannot be widely used in the clinical setting due to limitations such as invasiveness, local measurement, and conclusion delay. Unfortunately, there is no biomarker capable of monitoring TME normalization spatiotemporally during BEV therapy, which makes it challenging to stratify GBM patients who benefited from BEV therapy. As such, it is urgently needed to establish quantitative and noninvasive biomarkers to monitor TME normalization for the precise evaluation of BEV response in GBM.Purpose
To develop quantitative imaging biomarkers based on tumor habitats derived from MRI to monitor BEV-induced TME normalization in GBM.Methods
The patient-derived GBM orthotopic xenograft models in mice with humanized immune system were used to ensure the authenticity of TME heterogeneity in the clinical setting and randomly divided into two therapy cohorts for BEV treatment and saline control. Conventional MRI (T1WI, T2WI, FLAIR, T1-contrast) and multiparametric MRI (mpMRI) including DCE-MRI, IVIM-MRI were performed at different time points (baseline, 2days, 5days, 8days, 14days, and 25days post-treatment) with a 7.0T preclinical MRI scanner (Bruker BioSpec), then a set of anatomical and physiological habitats were generated by Gaussian mixture model based on MR intensity and quantitative parameters (Ktrans, D*, f, D) to monitor TME normalization spatiotemporally. Spatial-paired analyses with MRI-histology coregistration and multiregional single-cell RNA sequencing were used to validate the association between habitats and TME normalization features.Results
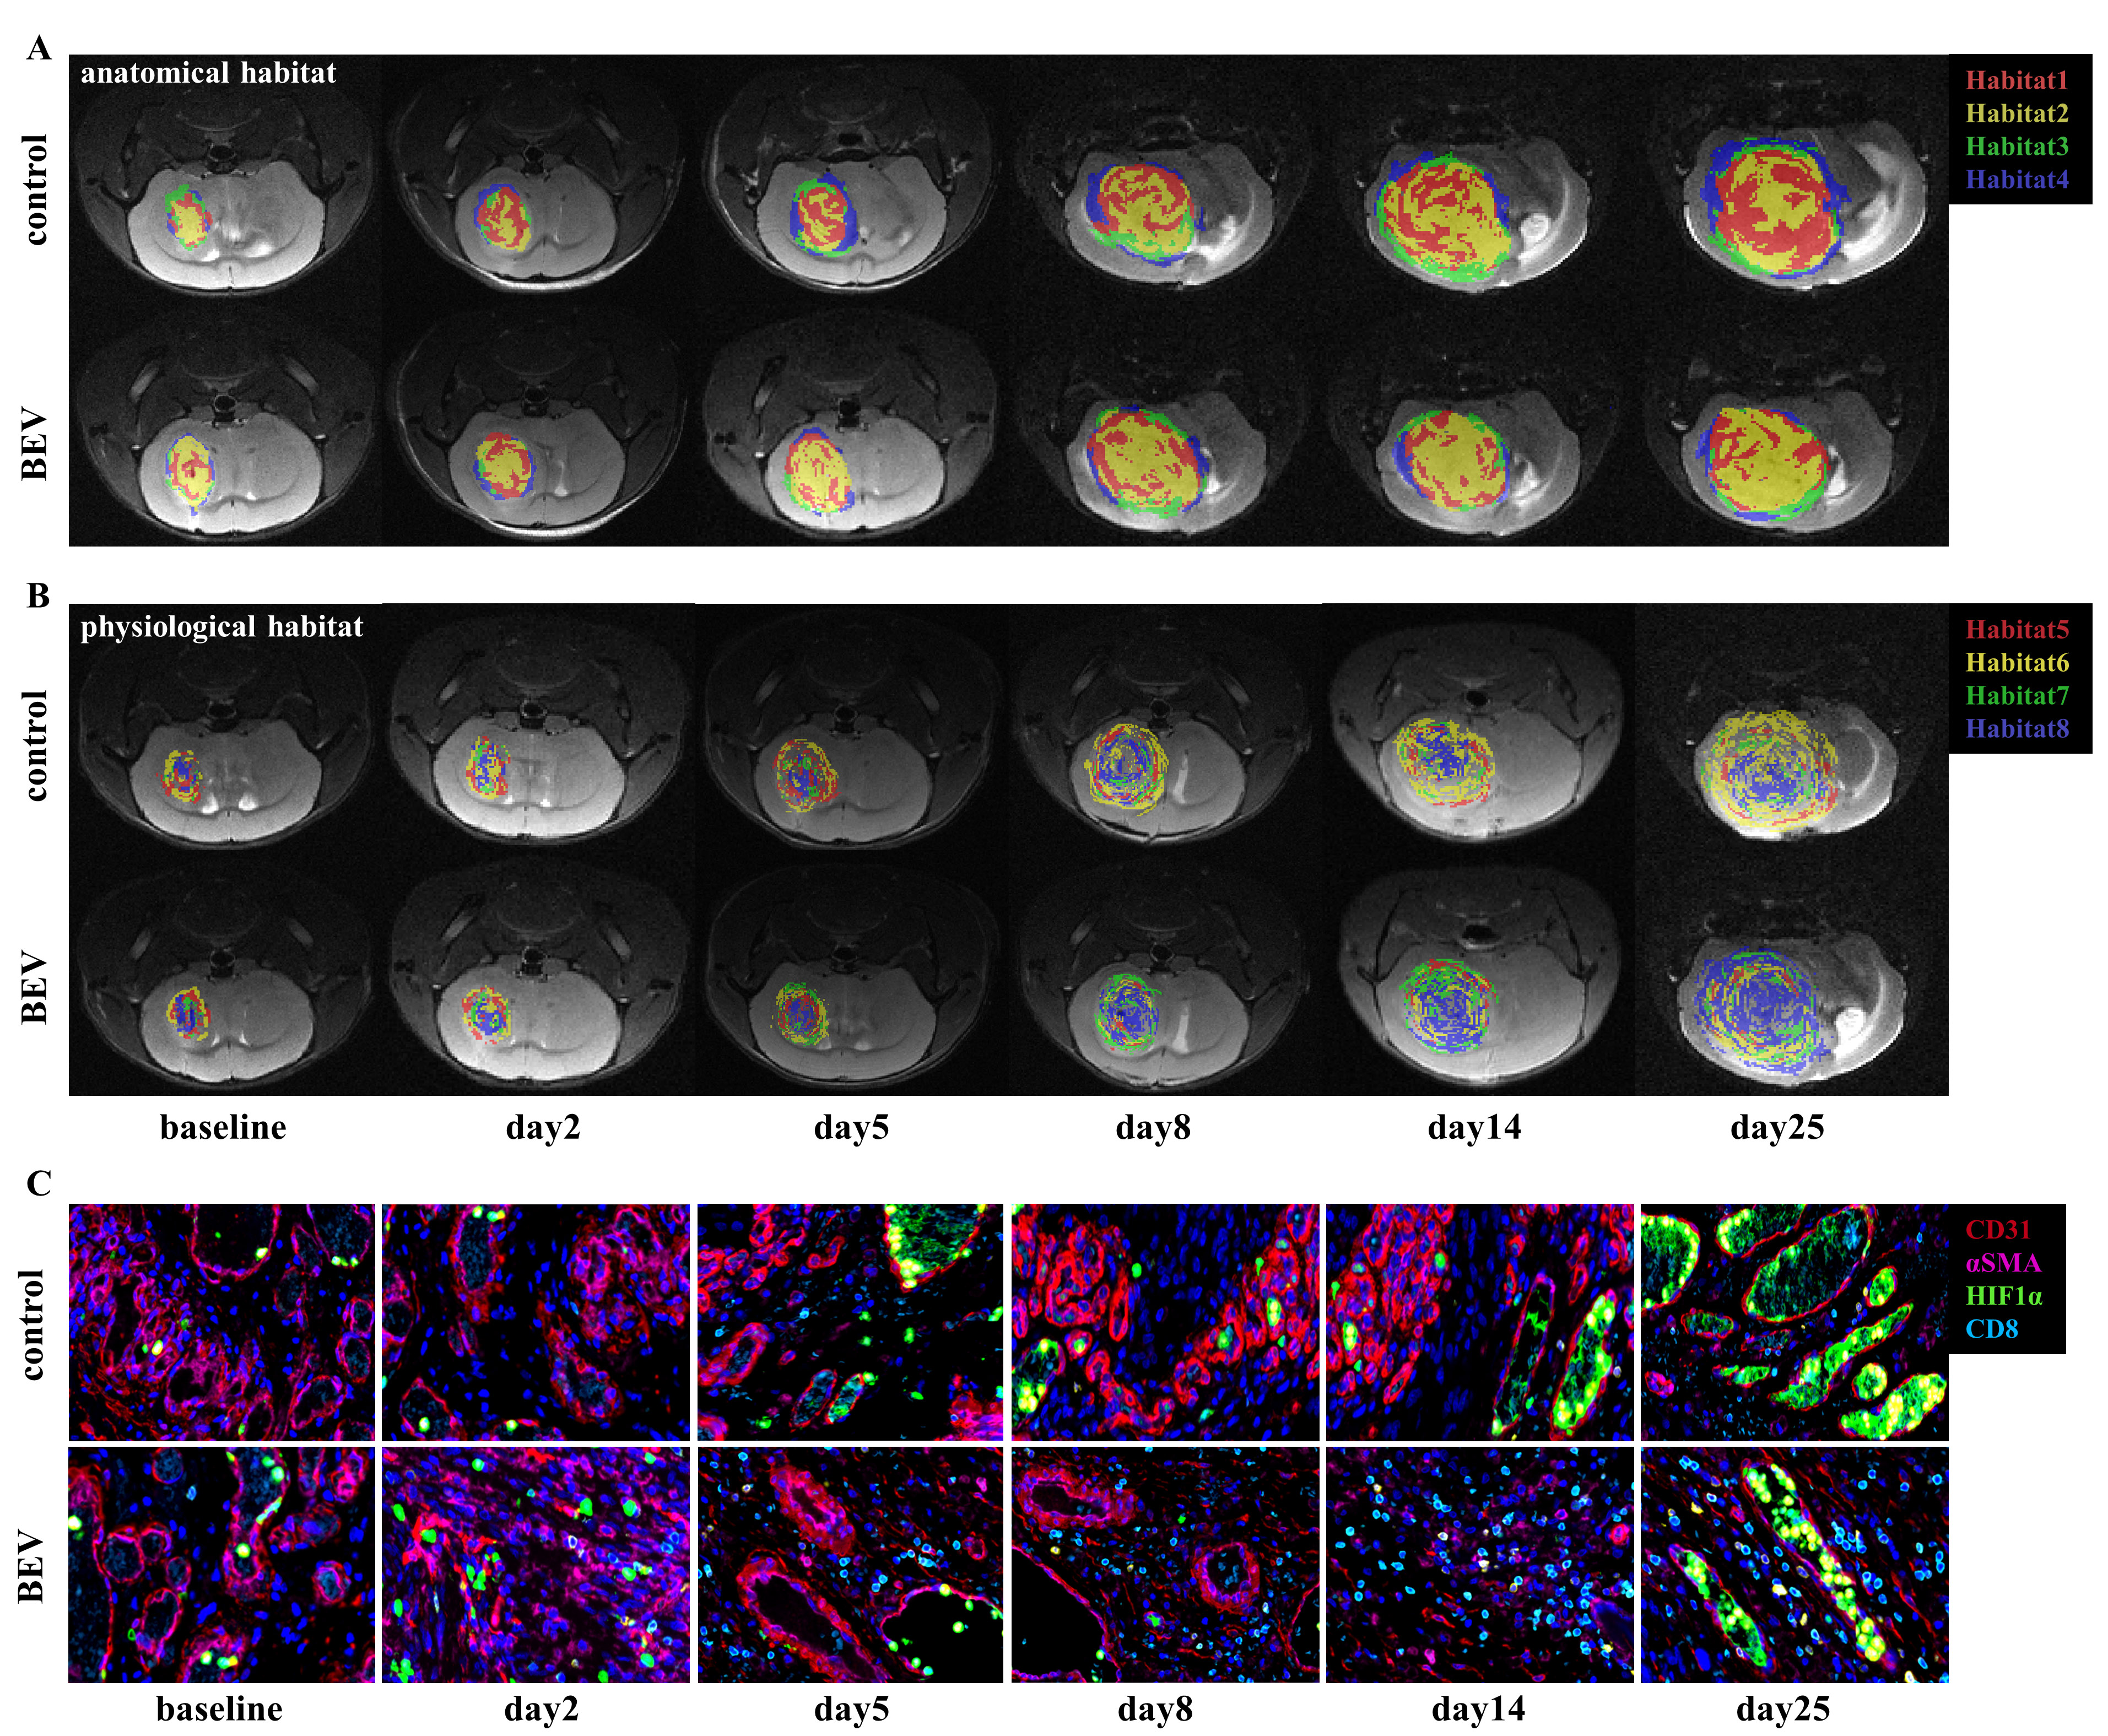
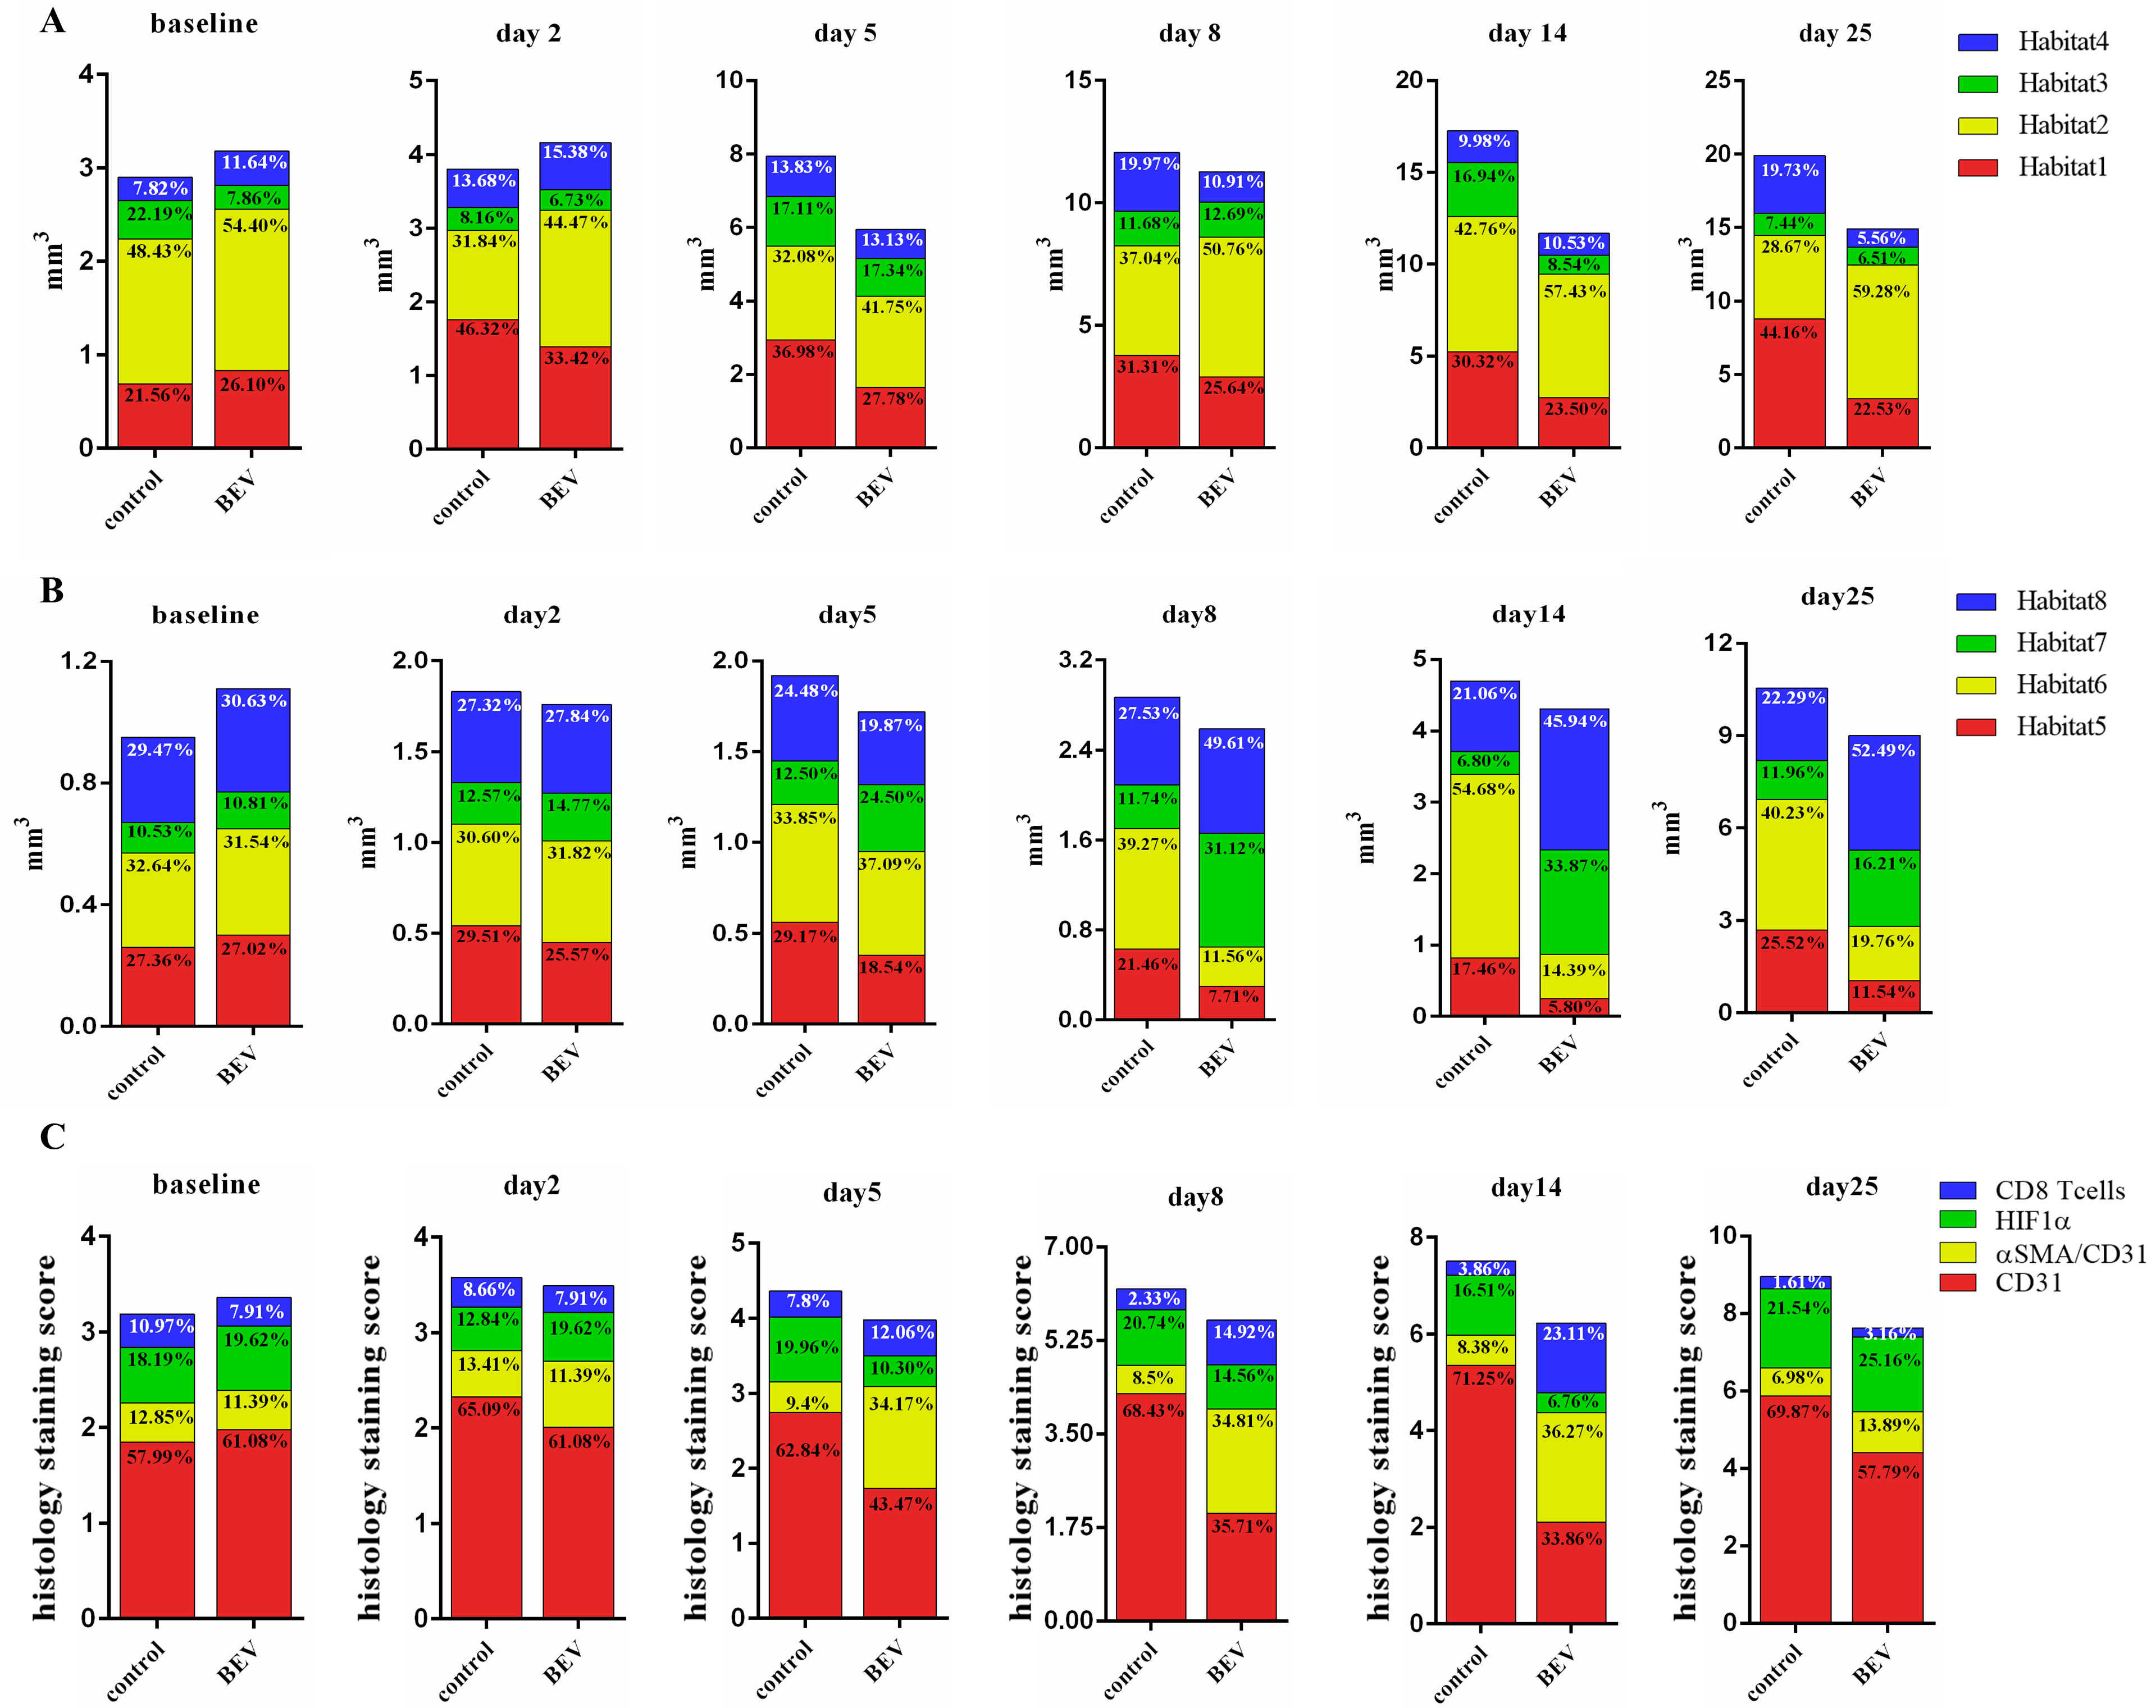
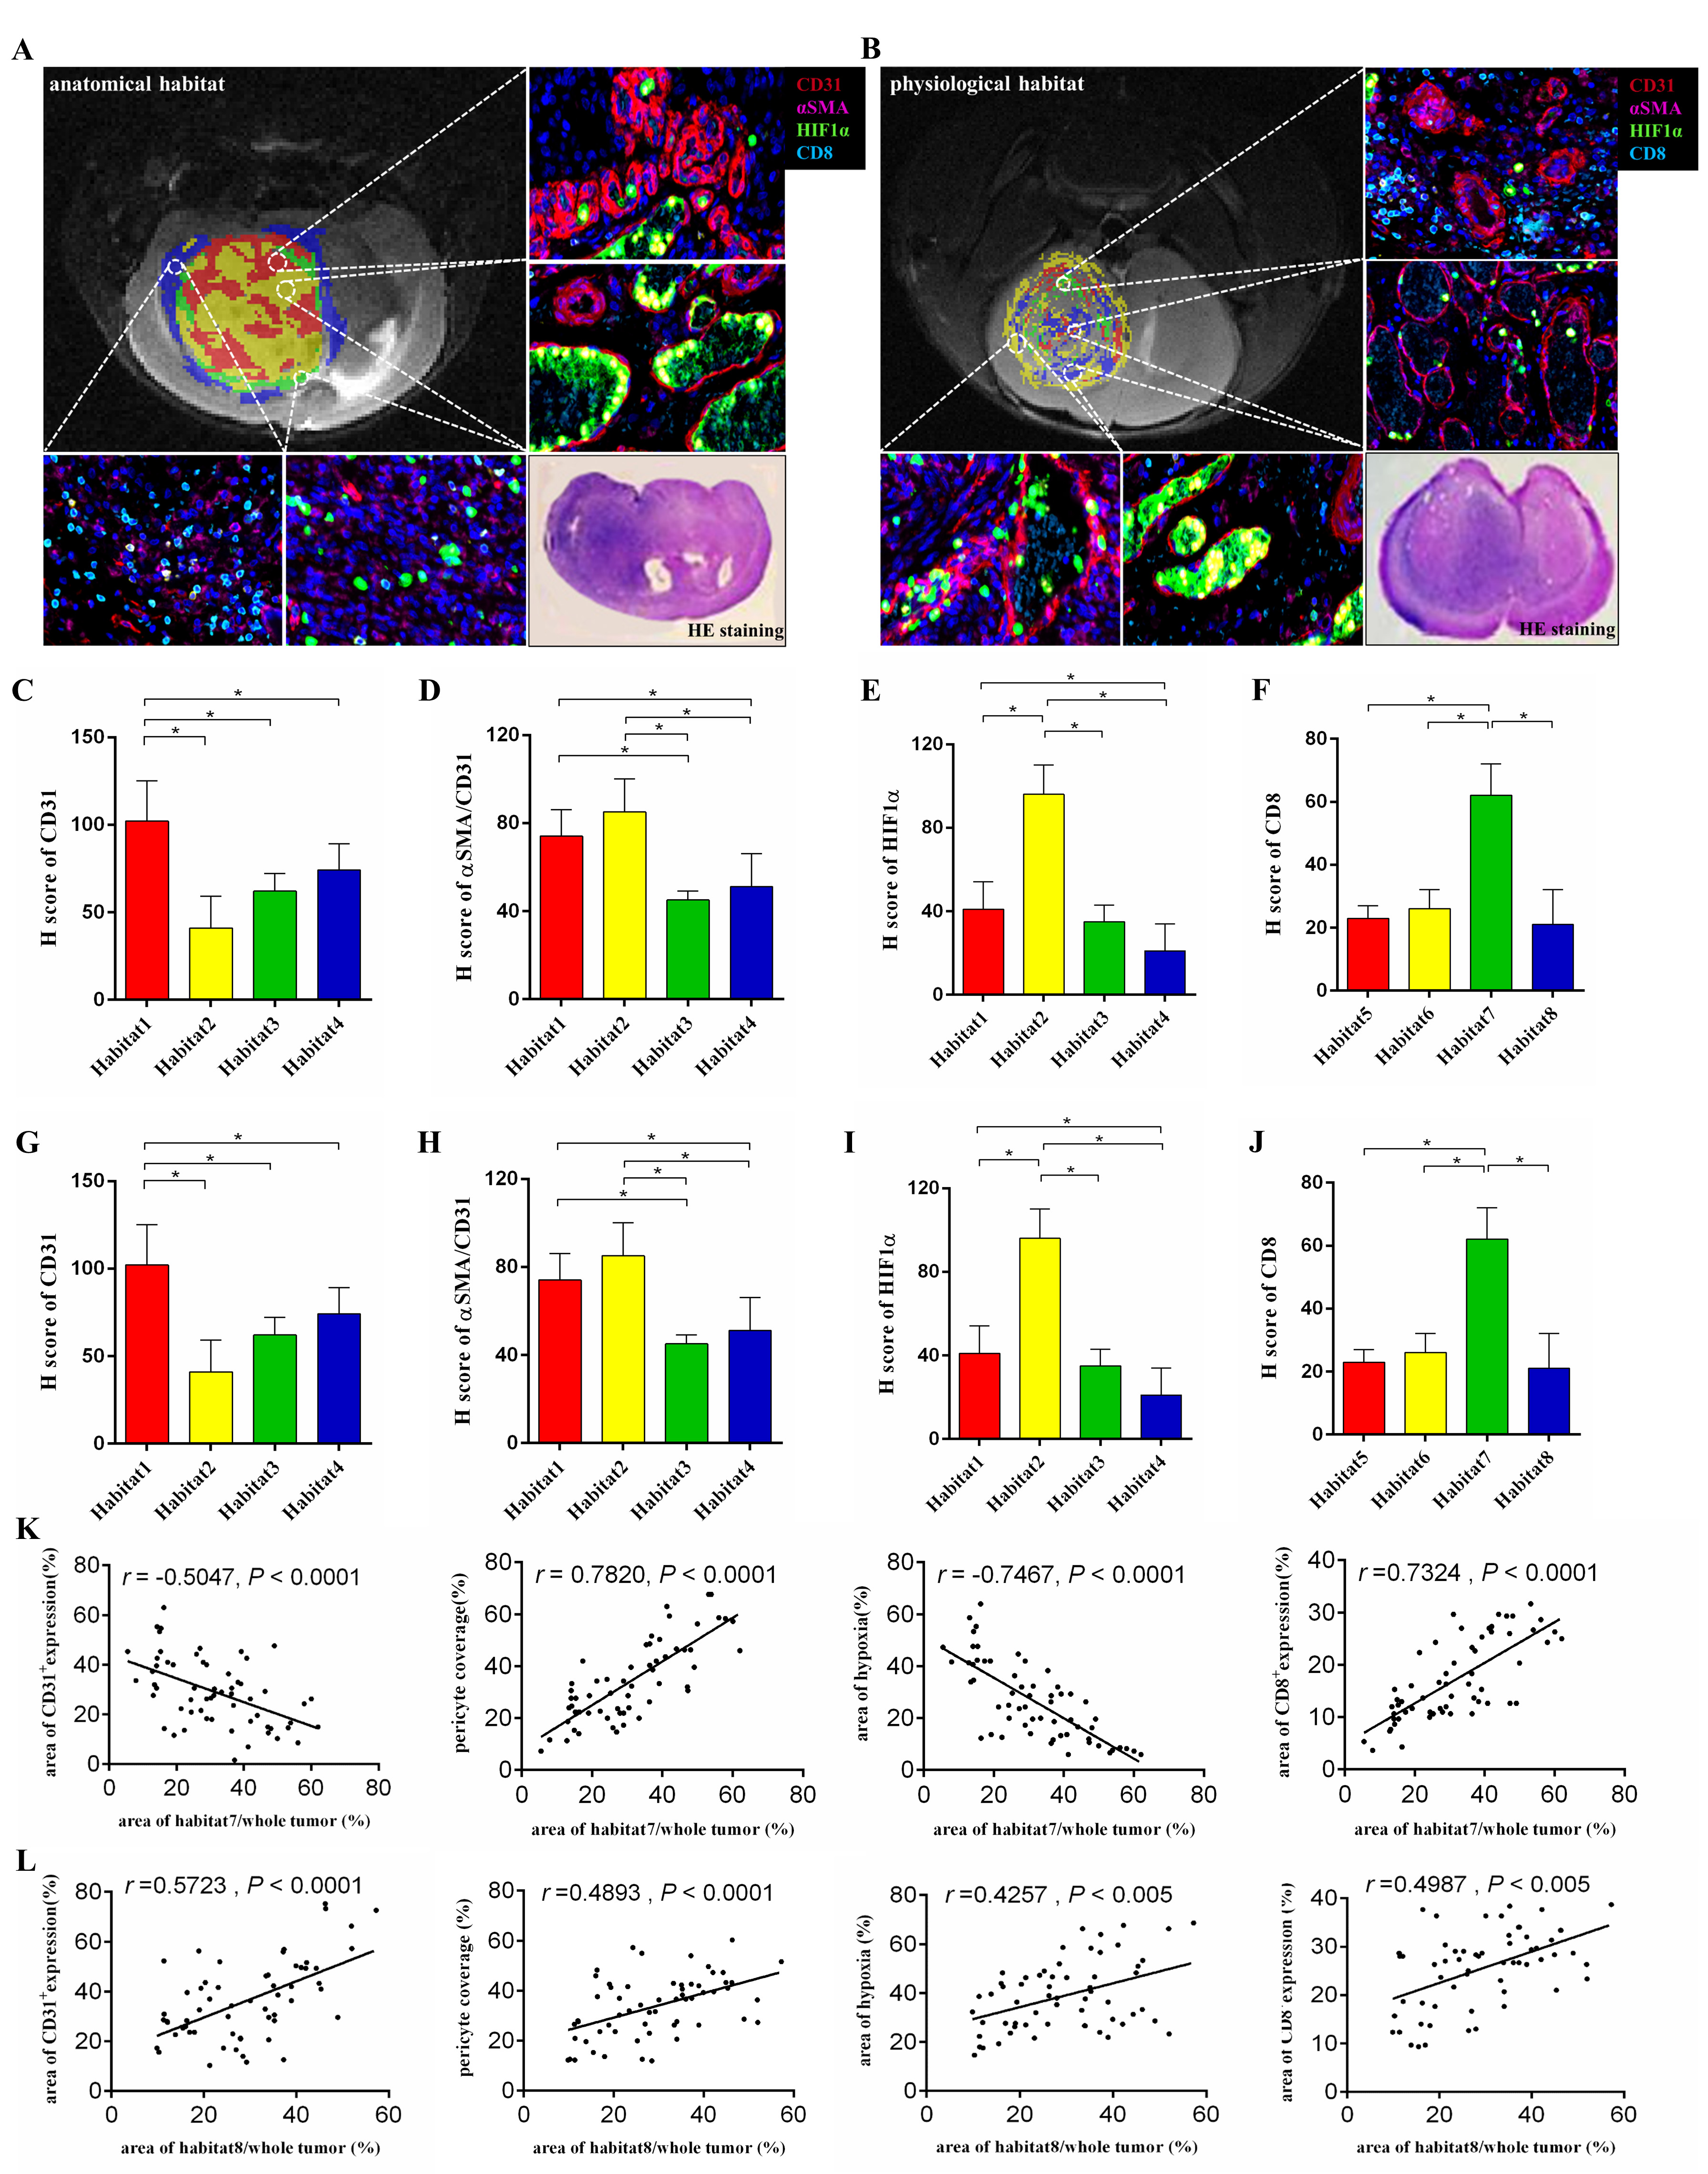
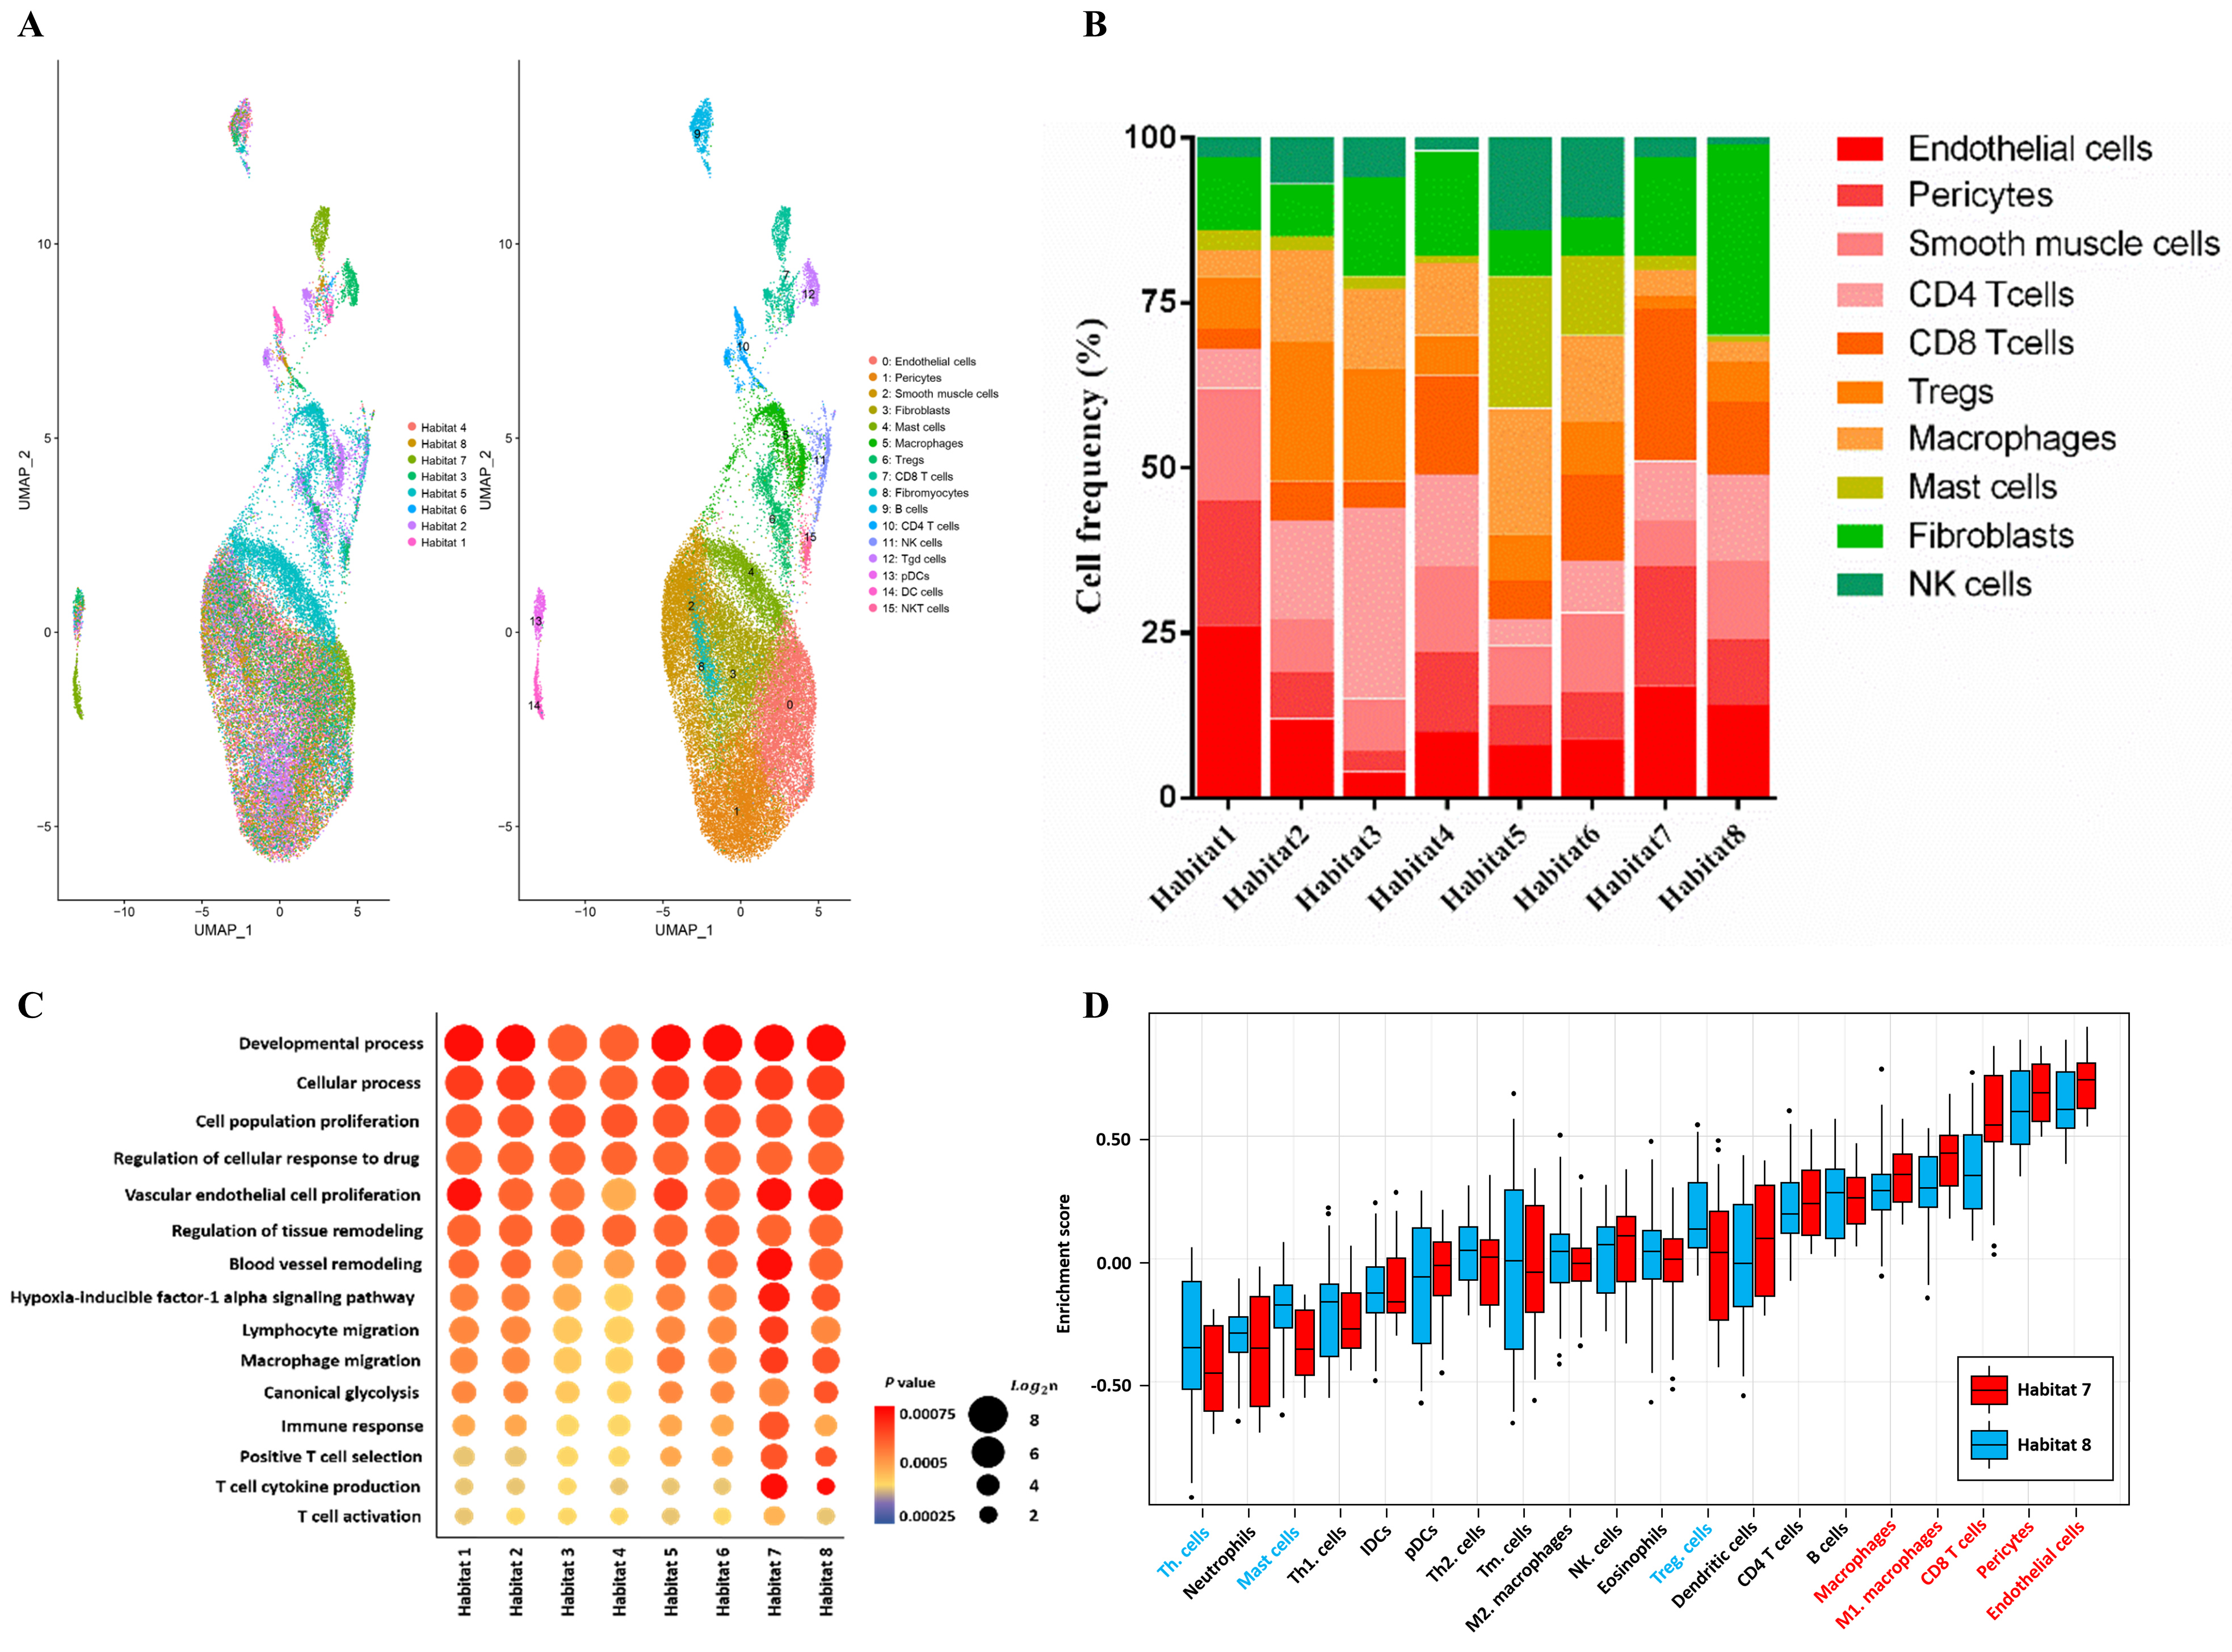
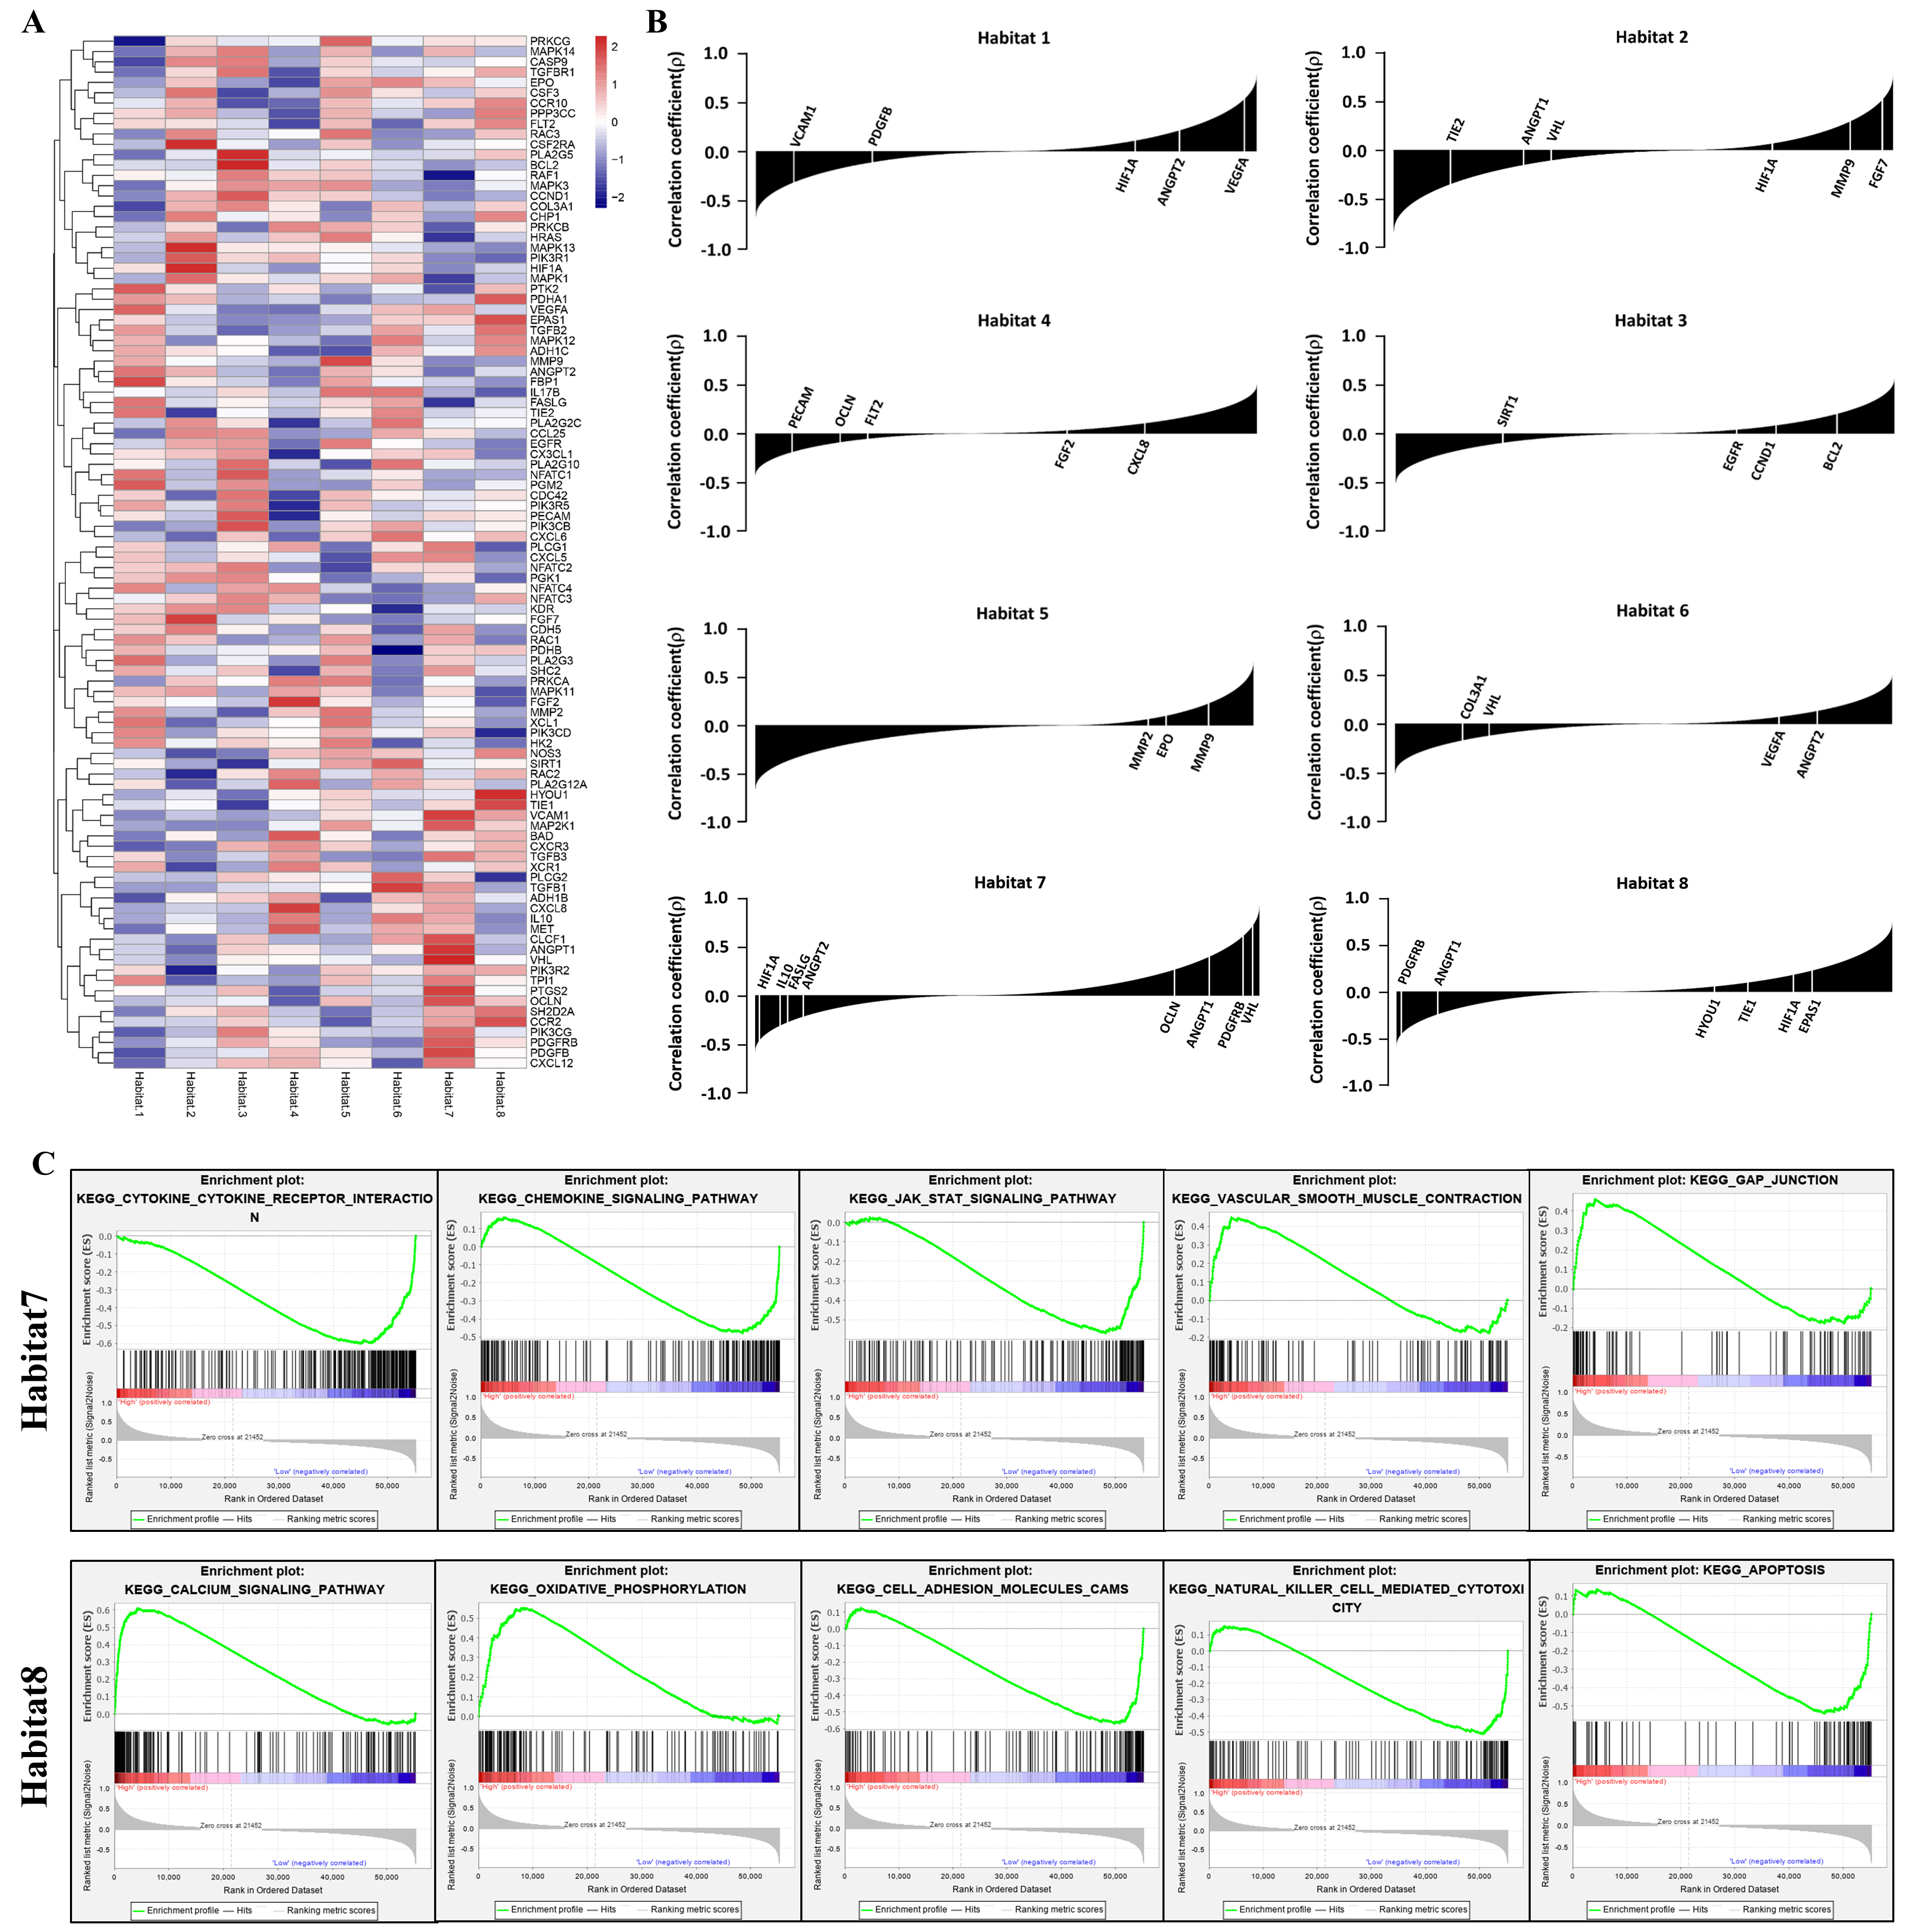
The anatomical and physiological habitat mappings and corresponding histology staining images are shown in Figure 1. Our data showed that the voxel areas of habitat7 and habitat8 were significantly increased during the period of TME normalization, consistent with the trend of histology features of TME normalization (Figure 2). Moreover, the spatial-paired analysis validated that habitat7 was strongly correlated with TME normalization indicators (Figure 3), including microvascular density (r = 0.5047; P<0.0001), pericyte coverage (r = 0.7820; P<0.0001), hypoxia (r = 0.7467; P<0.0001) and CD8+ T cells infiltration (r = 0.7324; P<0.0001). Transcriptomically, habitat7 was associated with cellular type mainly encompassing CD8+ T cells, pericytes, and endothelial cells, consistently with biological process analysis that vascular remodeling, hypoxia pathway, and T cell cytokine production were significantly enriched in the voxel area of habitat7 (Figure 4). Finally, the differentially expressed genes revealed by each habitat were identified and habitat7 was correlated with TME normalization-associated genes and pathways more intensively than correlations between habitat8 and these genes (Figure 5).Conclusion
The habitat7 derived from mpMRI has a significant association with BEV-induced TME normalization features validated by histology and single-cell transcriptomics. This quantitative metric could be a potential imaging biomarker for precise quantification of TME normalization in GBM noninvasively.Acknowledgements
This work was supported by the National Natural Science Foundation of China (No.81801672), the National Key Research &Development Program of China (2018YFC0115004), and the Foundation of General Hospital of Western Theater Command of PLA (2021-XZYG-C05). We thank Haifeng Shu (Department of Neurosurgery, General Hospital of Western Theater Command of PLA, Chengdu, China), Liang Yi (Department of Neurosurgery, Daping Hospital, Army Medical University, Chongqing, China), and Qing Li (Cancer Center, Daping Hospital, Army Medical University, Chongqing, China) for outstanding technical support for the tumor modeling and data processing.References
[1] van den Bent MJ, Geurts M, French PJ, et al. Primary brain tumours in adults. Lancet. 2023; 402(10412):1564-1579.
[2] Bejarano L, Jordāo MJC, Joyce JA. Therapeutic Targeting of the Tumor Microenvironment. Cancer Discovery. 2021; 11(4): 933-959.
[3] Pérez-Gutiérrez L, Ferrara N. Biology and therapeutic targeting of vascular endothelial growth factor A. Nature Reviews Molecular Cell Biology. 2023; 24(11):816-834.
[4] Chiu FY, Yen Y. Imaging biomarkers for clinical applications in neuro-oncology: current status and future perspectives. Biomarker Research. 2023; 11(1): 35.
[5] Beig N, Bera K, Prasanna P, et al. Radiogenomic-Based Survival Risk Stratification of Tumor Habitat on Gd-T1w MRI Is Associated with Biological Processes in Glioblastoma. Clinical Cancer Research. 2020; 26(8): 1866-1876.
[6] Tomaszewski MR, Gillies RJ. The Biological Meaning of Radiomic Features. Radiology. 2021; 298(3): 505-516.
[7] Kim M, Park JE, Yoon SK, et al. Vessel size and perfusion-derived vascular habitat refines prediction of treatment failure to bevacizumab in recurrent glioblastomas: validation in a prospective cohort. European Radiology. 2023; 33(6): 4475-4485.
[8] Wu H, Tong H, Du X, et al. Vascular habitat analysis based on dynamic susceptibility contrast perfusion MRI predicts IDH mutation status and prognosis in high-grade gliomas. European Radiology. 2020; 30(6): 3254-3265.
Figures