0026
Preoperative prediction of MGMT methylation status in high-grade glioma based on MRI radiomics signature of habitat analysis1The First Affiliated Hospital of China Medical University, Shenyang, Liaoning Province, China, 2MR Research Collaboration, Siemens Healthineers, Beijing, China, 3MR Research Collaboration, Siemens Healthineers, Shanghai, China
Synopsis
Keywords: Radiomics, Neuro, MGMT,habitat analysis,radiomics
Motivation: To predict the oxygen 6-methylguanine-DNA methyltransferase (MGMT) methylation status in high-grade gliomas (HGG) before surgery by using conventional MRI radiomics features within tumor habitat.
Goal(s): To better understand the molecular characteristics of HGG.
Approach: In 105 HGG patients, the whole tumor was segmented into 3subregions by Kmeans clusters on T2 and T1 contrast-enhanced images. Radiomic features were extracted from each subregion and the predictive performance of radiomics signature was compared with clinical data.
Results: The efficiency of 3 subregions segmentation using Kmeans clustering with habitats analysis was the highest. The AUC of the model validation set was as high as 0.878.
Impact: We developed a radiomic signature model that can be used to predict MGMT methylation status in HGG patients. This can be used as a tool to help clinicians assess MGMT methylation status in HGG patients and guide individualized treatment.
Introduction
Glioma is a common primary central nervous system (CNS) tumor, with a high recurrence rate, high mortality and high disability rates. Earlier studies have found that glioma patients with the same WHO classification or tissue type may also show significantly different prognosis and survival [1]. The occurrence and development of gliomas are usually related to genetic abnormalities [2], and different gliomas show obvious heterogeneity and diversity of molecular types. The 2021 edition of CNS Tumor Classification represents an encouraging step toward the development of personalized treatment approaches for neurotumors [3].O6-methylguanine-dna methyltransferase (MGMT) is a key gene encoding DNA repair enzymes [4]. Glioma patients with MGMT promoter methylation are more sensitive to the alylation agent temozolomide chemotherapy, which is associated with a good prognosis for high-grade gliomas (HGG) [5]. MGMT promoter hypermethylation is the only known biomarker for detecting temozolomide (TMZ) response in glioblastoma patients [6].Radiomics is a method that can rapidly extract the quantitative image features through high-throughput calculation [7]. Due to its advantages of non-inventiveness and high accuracy, radiomics has developed rapidly and has been a research hotspot in recent years. A habitat is a region within a cancer tissue that has different biological characteristics. Habitat analysis can be used to assess heterogeneity within lesions. This heterogeneity may be closely related to patient prognosis, treatment response, and risk of recurrence. In conclusion, radiomics and habitat have brought revolutionary changes to cancer quantitative imaging in the post-genomic era in recent years.In this study, we investigated the utility of a multi-sequence and multi-habitat MR radiomics signature as a preoperative and non-invasive biomarker of MGMT methylation prediction in patients with grade Ⅲ-IV high-grade glioma.Methods
Subjects and MRI acquisition:In this prospective study, 105 patients with HGG were enrolled, including 61 MGMT promoter methylation-44 MGMT promoter non-methylated. All participants underwent routine MRI examinations on 3T systems. The methylation status of the MGMT promoter was assessed using pyrosequencing analysis.Data processing:Volume of interest (VOI) of the entire tumor was manually delineated layer by layer by a neuro-radiologist with 10 years of experience on the original images of T1-weighted images, T2-weighted images, T2-weighted fluid-attenuated interphase and T1 contrast-enhanced images for each patient using ITK-SNAP (http://www.Itksnap.org). Then, we employed nnFAE software to conduct habitat analysis of the entire VOI, which was segmented into three subregions by k-means clustering. Then FAE software (https://github.com/salan668/FAE) was used to conduct radiomics analysis on the entire VOI and subregions obtained in the above steps and build the best image radiomics model. The specific flow chart was shown in Figure 1.
Results
Comparisons of demographic and clinical characteristics between the groups were shown in Table 1.In primitive radiomics, T2 was the most efficient radiometric model for both simple tumor and simple peritumoral edema, and the AUC of validation set T2 was 0.735 (95% confidence interval [CI]: 0.5409-0.8917) and 0.741 (95% CI: 5274-0.9549) respectively (Table 2, Figure 3).With the habitat analysis, the model performance is optimized under Kmeans3 clustering of T2 sequence (Figures 2, 5) and the results were further improved compared to primitive radiomics. The AUC of the simple peritumoral edema was up to 0.878(Table 2, Figure 4).Discussion
In this study, the methylation status of MGMT promoter can be well predicted based on routine enhanced MRI with habitat analysis, which can help clinicians develop individualized treatment plans and save examination costs for patients to a certain extent. At the same time, habitat analysis of the VOI results obtained under K-means clustering can further improve the prediction efficiency of the model and provide clinicians with more detailed tumor heterogeneity information. This was confirmed in Wei's research [8].Acknowledgements
No acknowledgement found.References
Reference[1] Weller M, Stupp R, Hegi M E, et al. Personalized care in neuro-oncology coming of age: why we need MGMT and 1p/19q testing for malignant glioma patients in clinical practice[J]. Neuro Oncol, 2012, 14 Suppl 4: iv100-108.doi:10.1093/neuonc/nos206[2] Wu Y, Guo Y, Ma J, et al. Research Progress of Gliomas in Machine Learning[J]. Cells, 2021, 10(11): 3169.doi:10.3390/cells10113169[3] Louis D N, Perry A, Wesseling P, et al. The 2021 WHO Classification of Tumors of the Central Nervous System: a summary[J]. Neuro Oncol, 2021, 23(8): 1231-1251.doi:10.1093/neuonc/noab106[4] Huang H, Wang F-F, Luo S, et al. Diagnostic performance of radiomics using machine learning algorithms to predict MGMT promoter methylation status in glioma patients: a meta-analysis[J]. Diagn Interv Radiol, 2021, 27(6): 716-724.doi:10.5152/dir.2021.21153[5] Karschnia P, Teske N, Dorostkar M M, et al. Extent and prognostic value of MGMT promotor methylation in glioma WHO grade II[J]. Sci Rep, 2020, 10(1): 19758.doi:10.1038/s41598-020-76312-x[6] Oldrini B, Vaquero-Siguero N, Mu Q, et al. MGMT genomic rearrangements contribute to chemotherapy resistance in gliomas[J]. Nat Commun, 2020, 11(1): 3883.doi:10.1038/s41467-020-17717-0[7] Li Z-C, Bai H, Sun Q, et al. Multiregional radiomics profiling from multiparametric MRI: Identifying an imaging predictor of IDH1 mutation status in glioblastoma[J]. Cancer Med, 2018, 7(12): 5999-6009. doi:10.1002/cam4.1863[8] Wei J, Yang G, Hao X, Gu D, Tan Y, Wang X, Dong D, Zhang S, Wang L, Zhang H, Tian J. A multi-sequence and habitat-based MRI radiomics signature for preoperative prediction of MGMT promoter methylation in astrocytomas with prognostic implication. Eur Radiol. 2019 Feb;29(2):877-888. doi: 10.1007/s00330-018-5575-z. Epub 2018 Jul 23. PMID: 30039219; PMCID: PMC6302873.Figures
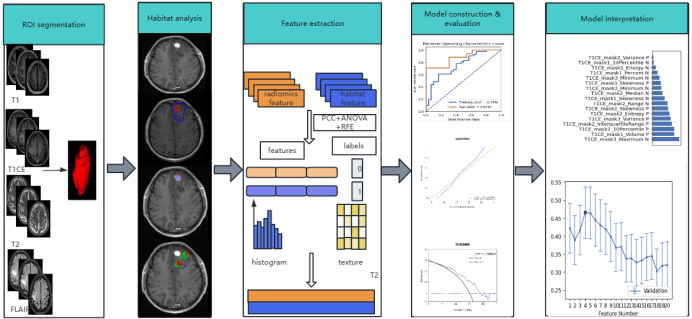
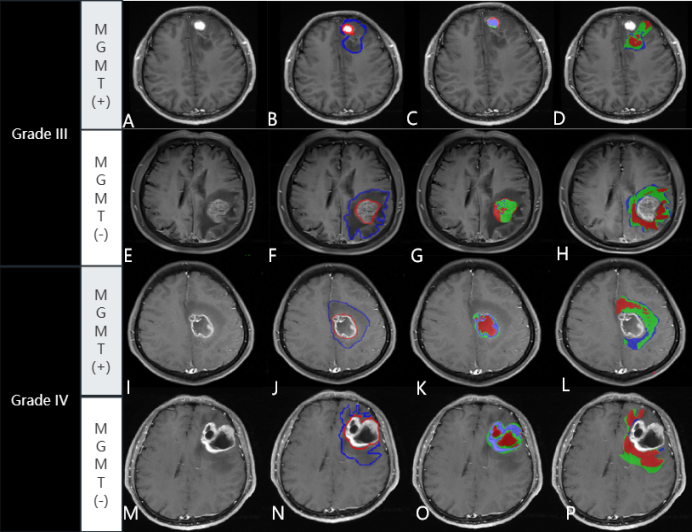
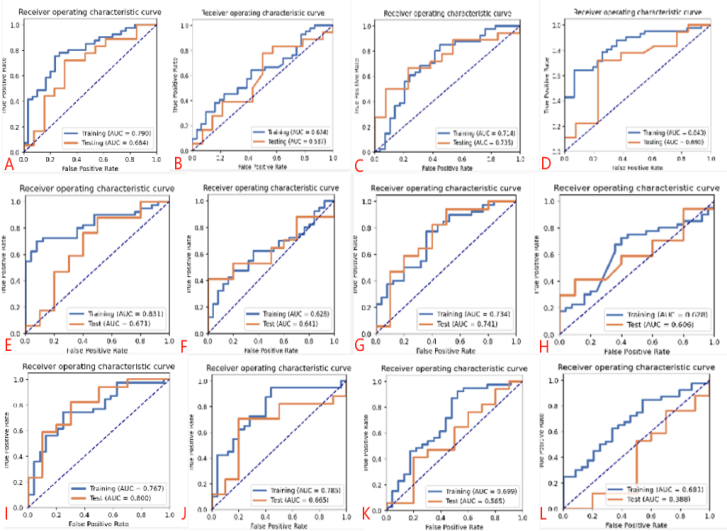
Figure 3. ROC curve of radiomic signature
A,B,C,D are the AUC of T1, T1CE, T2 and T2FLAIR in the tumor parenchyma, respectively. E,F,G,H are the AUC of T1, T1CE, T2 and T2FLAIR in the peritumoral edema, respectively.I,J,K, Lare the AUC result of the combined features of parenchyma and peritumoral edema.
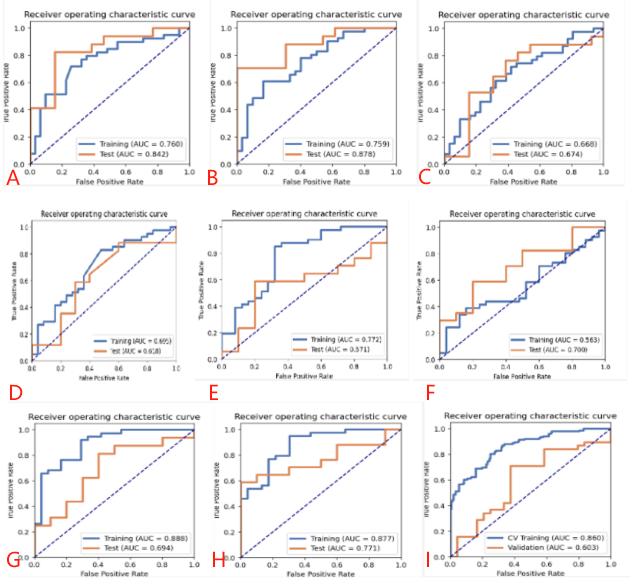
Figure 4. AUC results of ROI features generated by habitat analysis
A,B,C are the AUC of T1CE, T2 and T2FLAIR in the tumor parenchyma, respectively. D,E,F are the AUC of T1CE, T2 and T2FLAIR in the peritumoral edema, respectively.G,H,I are the AUC result of the combined features of parenchyma and peritumoral edema.
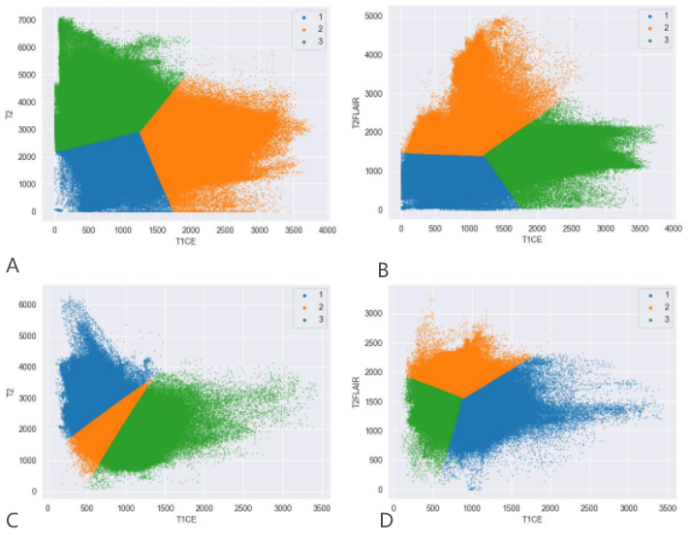
Figure 5. Habitat analysis Kmeans3 cluster scatter plot.
A,B represent tumor parenchyma and C,D represent peritumoral edema.
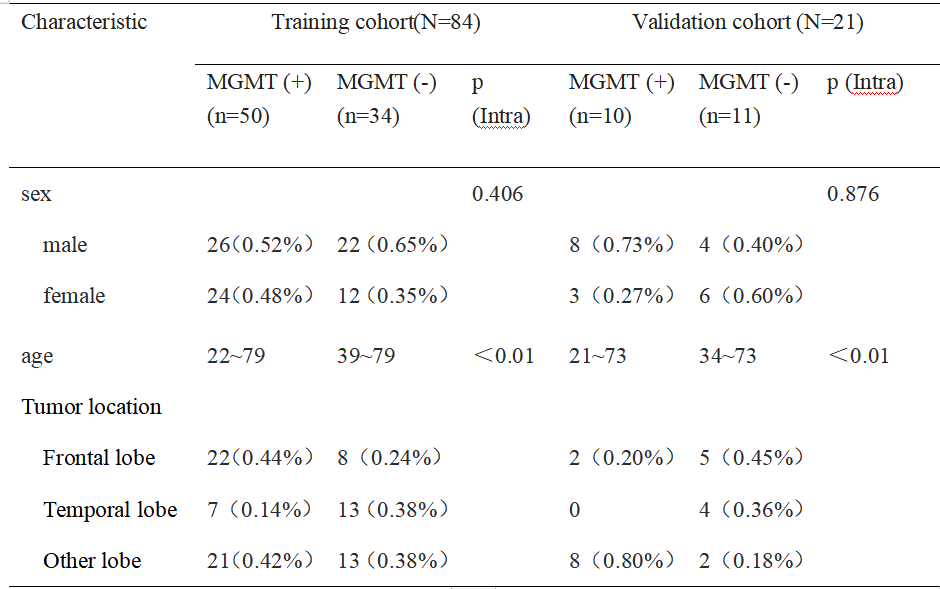
Table 1 Demographic and clinical characteristics
Table 1 Demographic and clinical characteristics
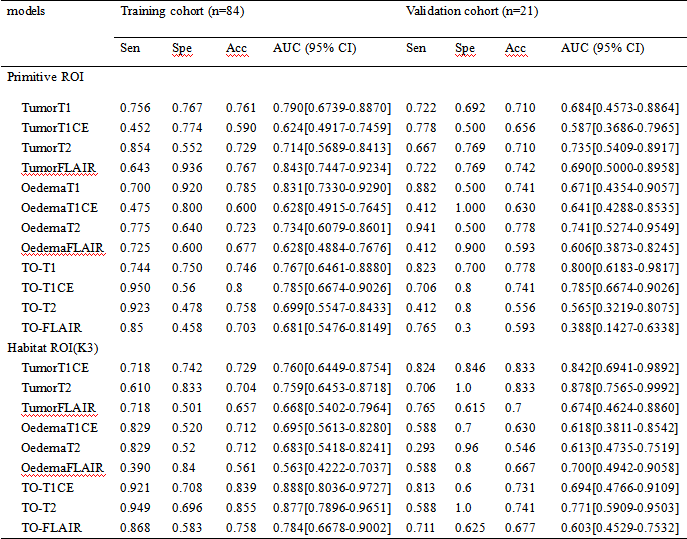
Table 2 Diagnostic performance of single radiomics signatures and Habitat values
Sen:Sensitivity;Spe:Specificity;Acc:Accuracy;TO:Tumor+Oedema combined features