0025
Advanced Imaging investigations of Fractal Dimension and Lacunarity measures of Glioma Subcomponents as Discriminator of IDH Status1Department of Biological Sciences, Indian Institute of Science Education and Research Berhampur, Berhampur, India
Synopsis
Keywords: Tumors (Pre-Treatment), Machine Learning/Artificial Intelligence, Fractal Dimension, Radiogenomic, Lacunarity, Glioma
Motivation: The presence of structural and geometric variations within gliomas, even among those with similar histologic grades, potentially reflect the phenotypic heterogeneity because of the distinct genetic and epigenetic landscape.
Goal(s): To develop a non-invasive radiogenomic platform to identify IDH and MGMT status using the geometry of glioma subcomponent.
Approach: Fractal dimension and Lacunarity, non-Euclidean geometric measures of glioma subcomponents, were estimated using MR images and wrapped in artificial intelligence-based models to discriminate IDH status and MGMT status.
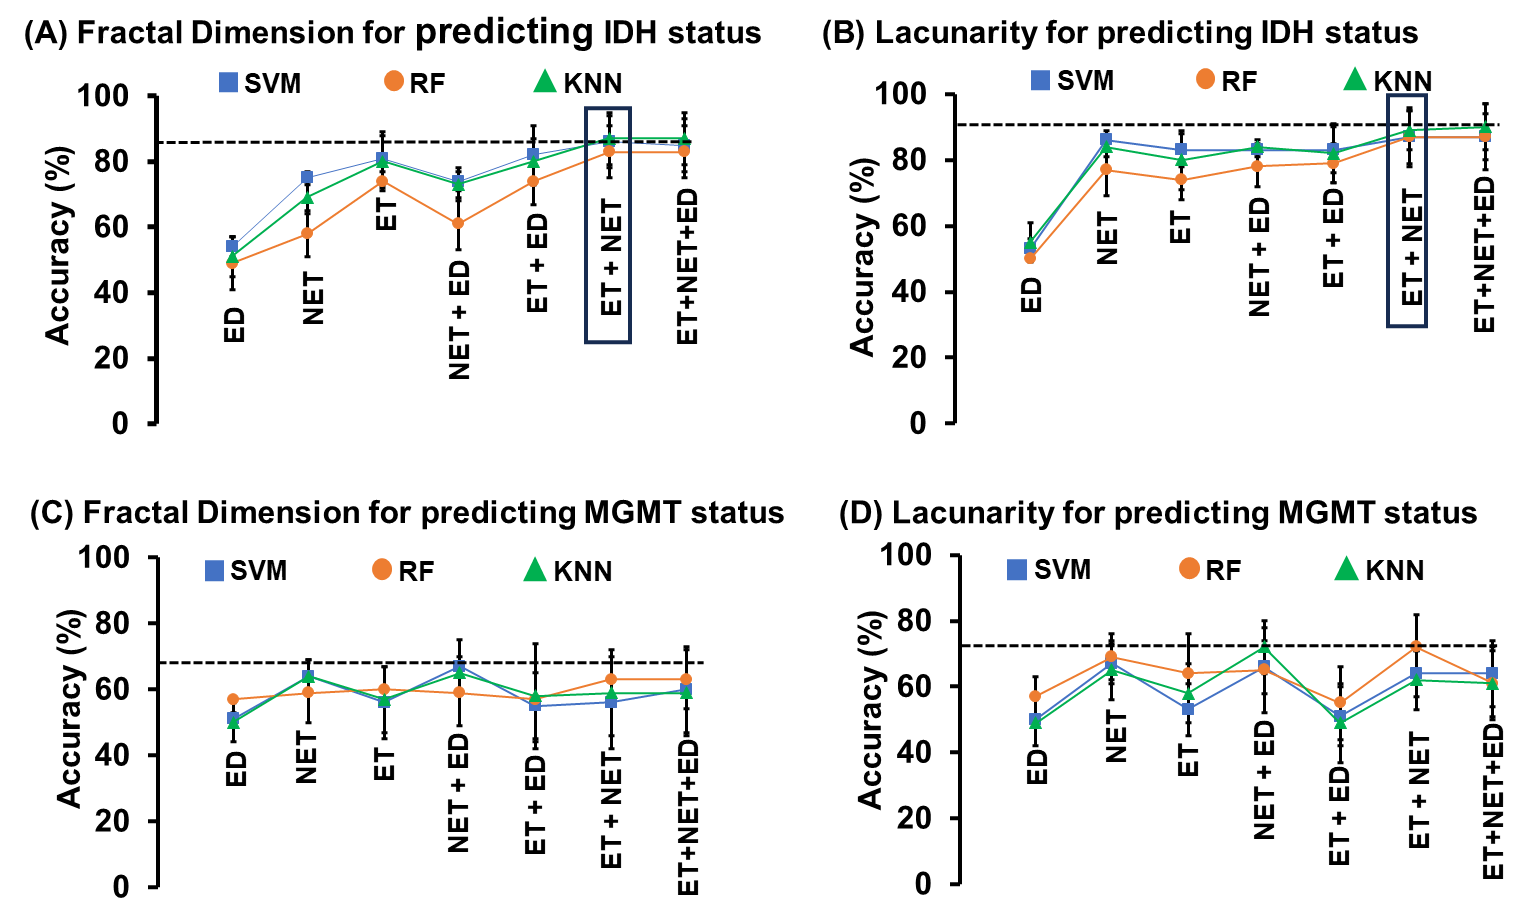
Results: The combination of fractal dimension or lacunarity of enhancing and nonenhancing glioma subcomponent is the definitive discriminator of IDH status as wildtype or mutant.
Impact: Fractal Dimension and Lacunarity of Glioma subcomponents are unique for IDH-Mutant and IDH-Wildtype gliomas. Fractal-geometry analysis can serve as an effective non-invasive tool for identifying IDH-status prior to biopsy and surgical interventions, thereby improving the clinical management of glioma patients.
INTRODUCTION
Gliomas of similar histologic type and grades exhibit distinct overall tumor geometry, as well as variations in the fractions and geometry of tumor subcomponents: enhancing, non-enhancing, necrotic, and edema fractions. Gliomas are complex and irregular structures that do not conform to traditional Euclidean geometry. Instead, non-Euclidean geometric measurements, such as Fractal Dimension (FD) and lacunarity, would better characterize the irregular and self-replicating patterns observed in tumor growth. Irrespective of the histologic grade, the gliomas harboring somatic mutations in isocitrate dehydrogenase (IDH) and epigenetic methylations in O6-methylguanine-DNA methyltransferase (MGMT) gene have a better prognosis and improved survival1. The structural and geometric heterogeneities in terms of Fractal Dimensions and Lacunarity are likely to be a phenotypic manifestation of tumor-relevant genetic and epigenetic events such as IDH and MGMT. Quantification of tumor subcomponent geometry and phenotypic heterogeneity across tumors with different molecular backgrounds, IDH-mutant vs IDH-wildtype, MGMT-methylated vs unmethylated may pave the way for establishing a non-invasive method of structural geometry as an indicator of molecular status and associated outcomes.METHODS
The cohort consisted of glioma subjects (N=142) from two TCIA2 (The Cancer Imaging Archive) repositories, TCGA-GBM (N=81) and TCGA-LGG (N=61). The subjects who had preoperative magnetic resonance imaging (MRI) scans consisting of T1-weighted, T2-weighted, T2-FLAIR, and contrast-enhanced T1-Gd sequences together with manually verified tumor segmentation masks for tumor subcomponents3,4,5, as well as age at diagnosis, gender, IDH mutation status (biopsy confirmed), were considered. A novel in-house developed pipeline was used to estimate fractal dimension6 (FD) and lacunarity7 of enhancing, nonenhancing plus necrosis, and edema subcomponents. The FD and lacunarity measures were leveraged to develop three supervised machine learning (ML) based algorithms: Support Vector Machine (SVM), Random Forest (RF), and k-nearest Neighbors (KNN). The FD and lacunarity of the tumor subcomponents (enhancing, nonenhancing, and edema) and IDH status were used to train the model wherein FD and lacunarity served as the dependent variable while the IDH status (mutant and wildtype) was used as the independent variable. The measures of fractality and lacunarity for the 142 subjects were divided into training and test sets in an 80:20 ratio, and a 5-fold stratified cross-validation strategy was implemented. A comprehensive examination was conducted, exploring all possible combinations of fractality and lacunarity of each tumor subcomponent. Similarly, ML procedures were extended to test the accuracy of discriminating MGMT status as methylated or unmethylated.RESULTS
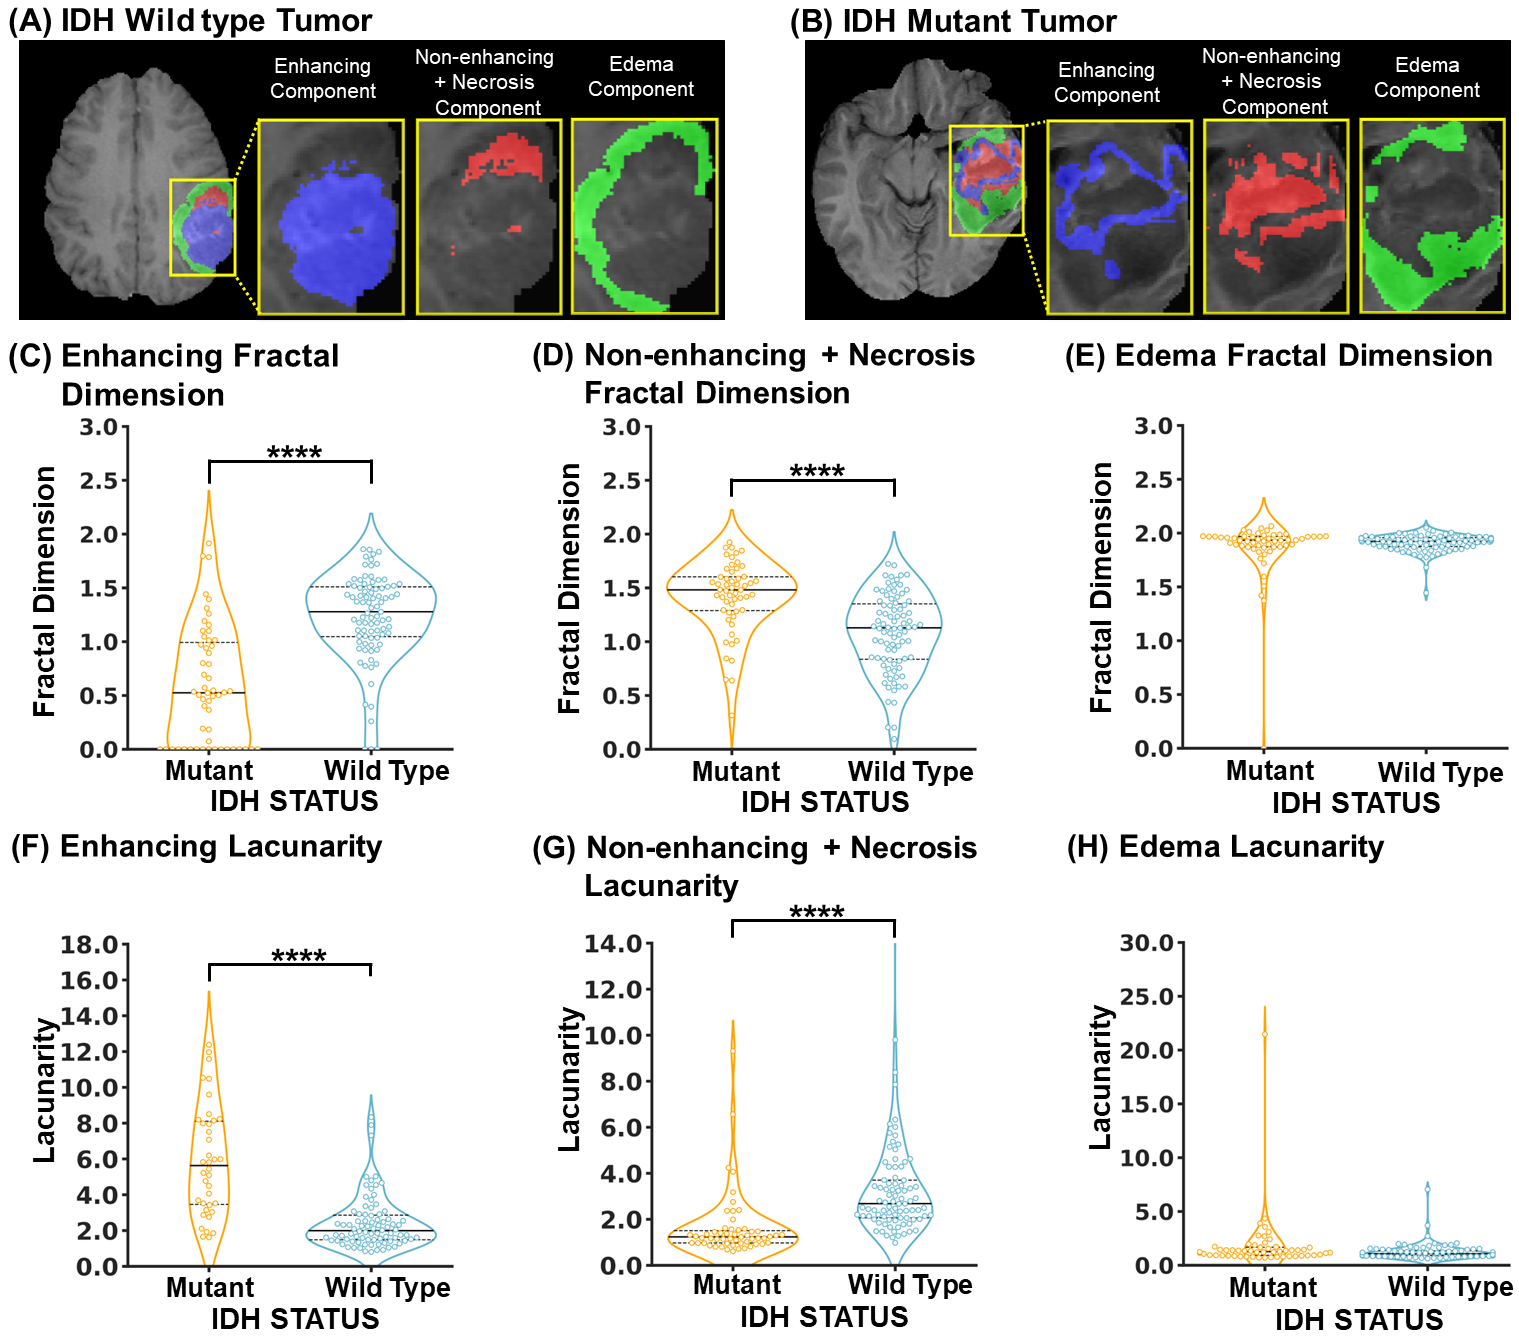
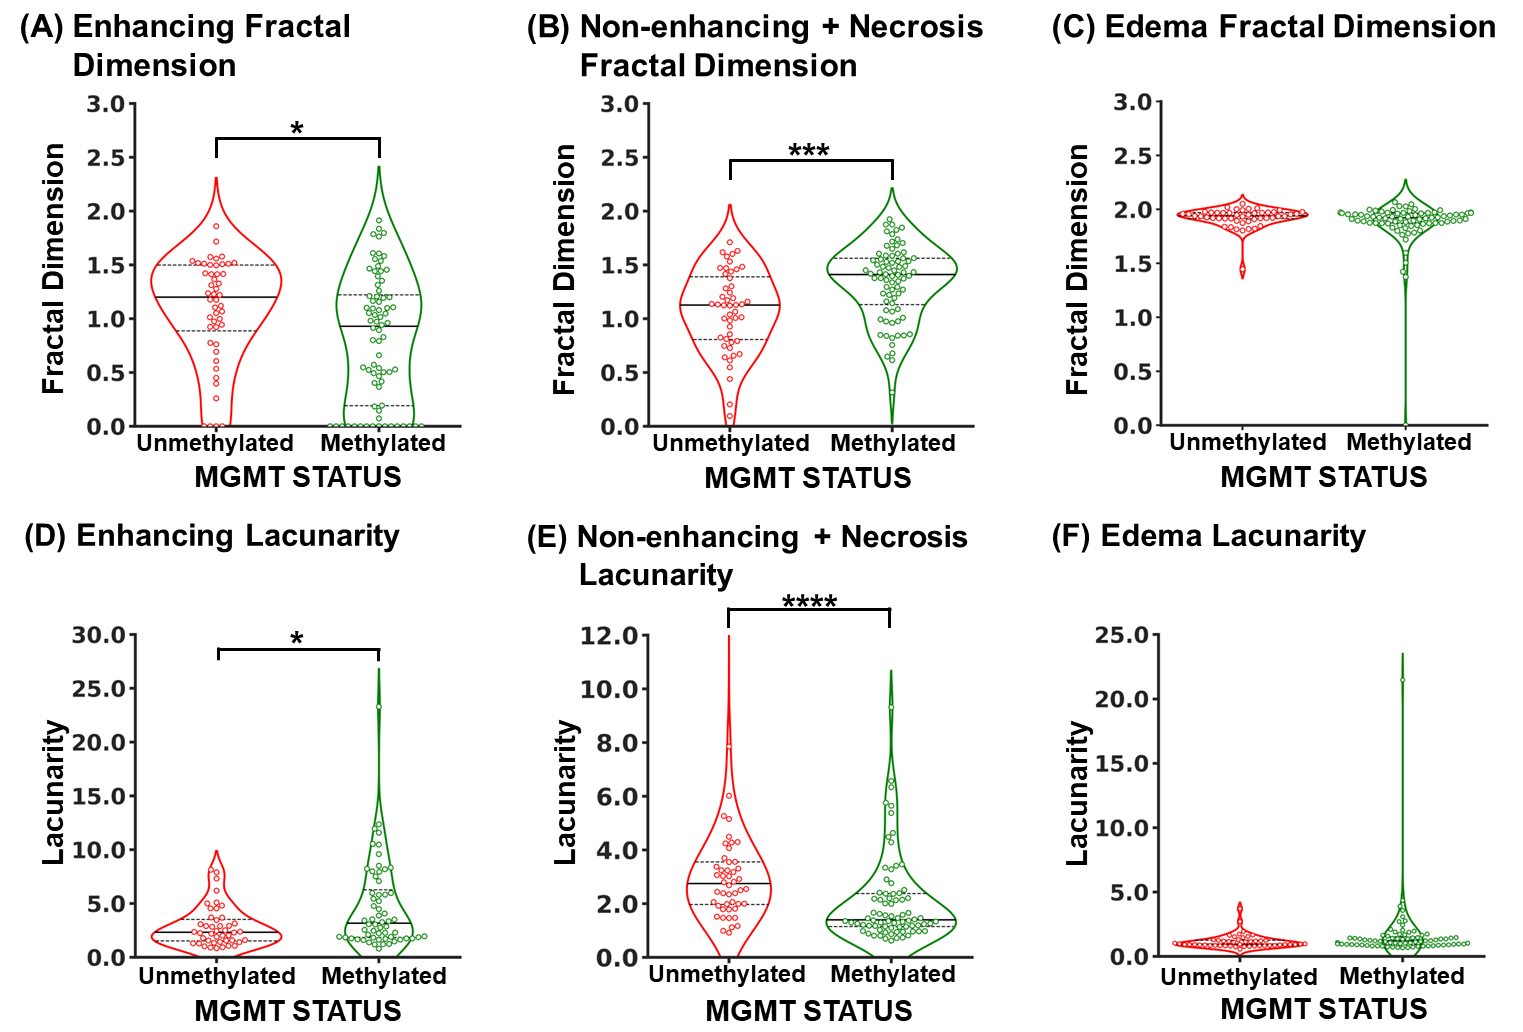
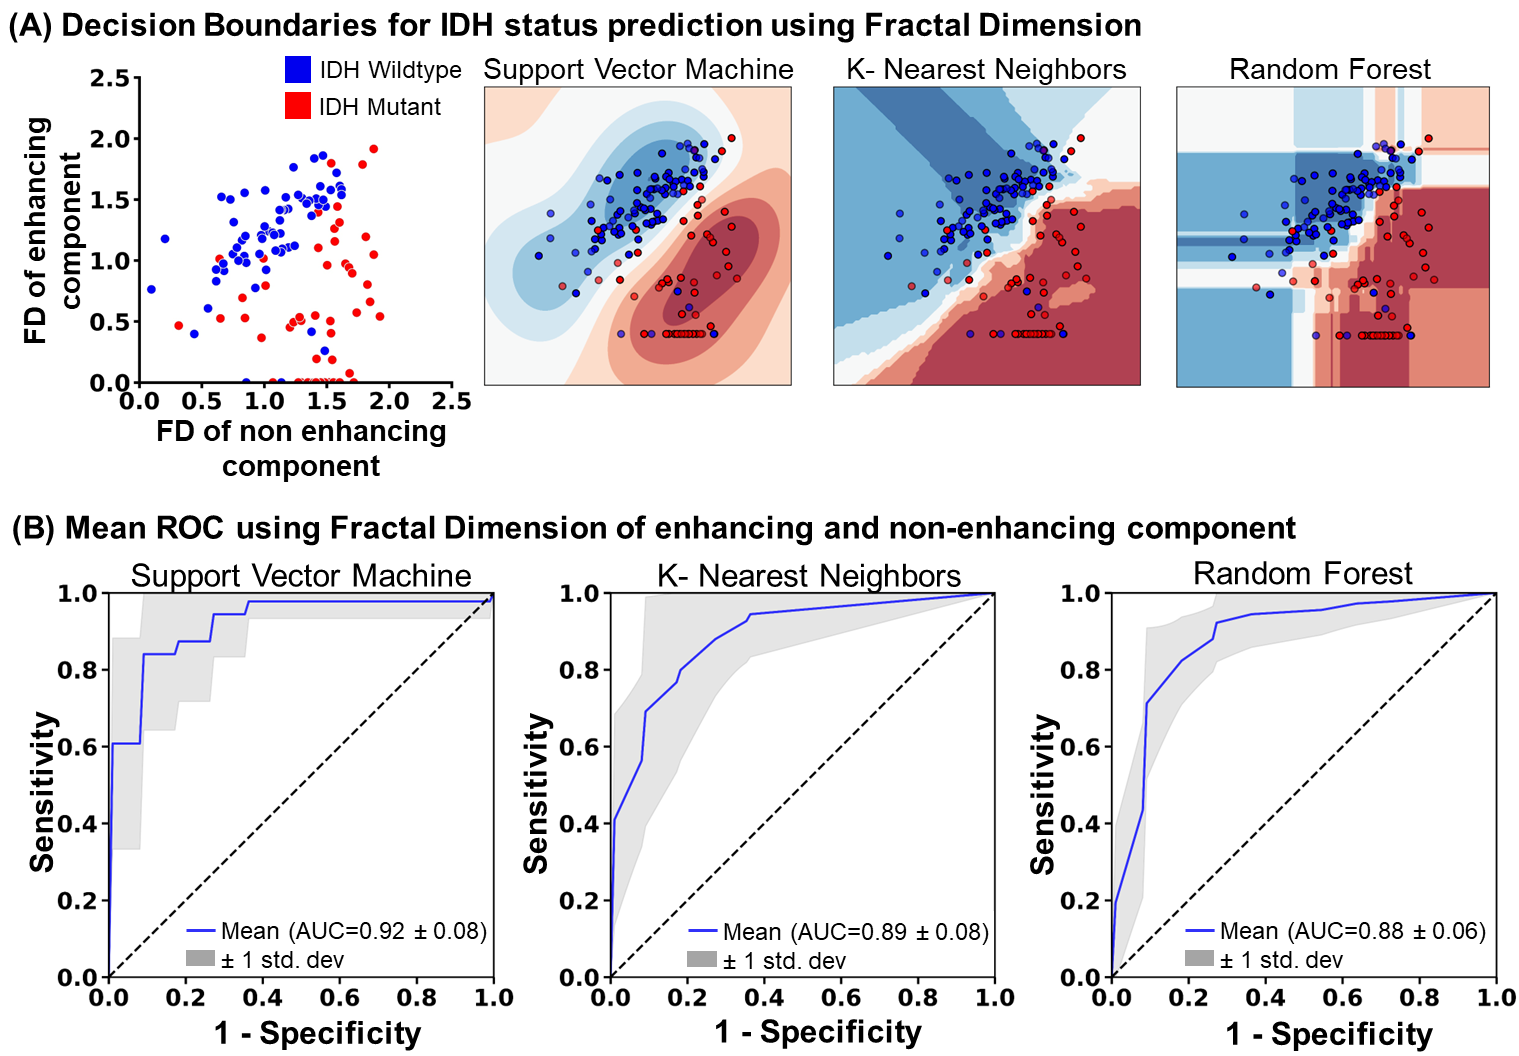
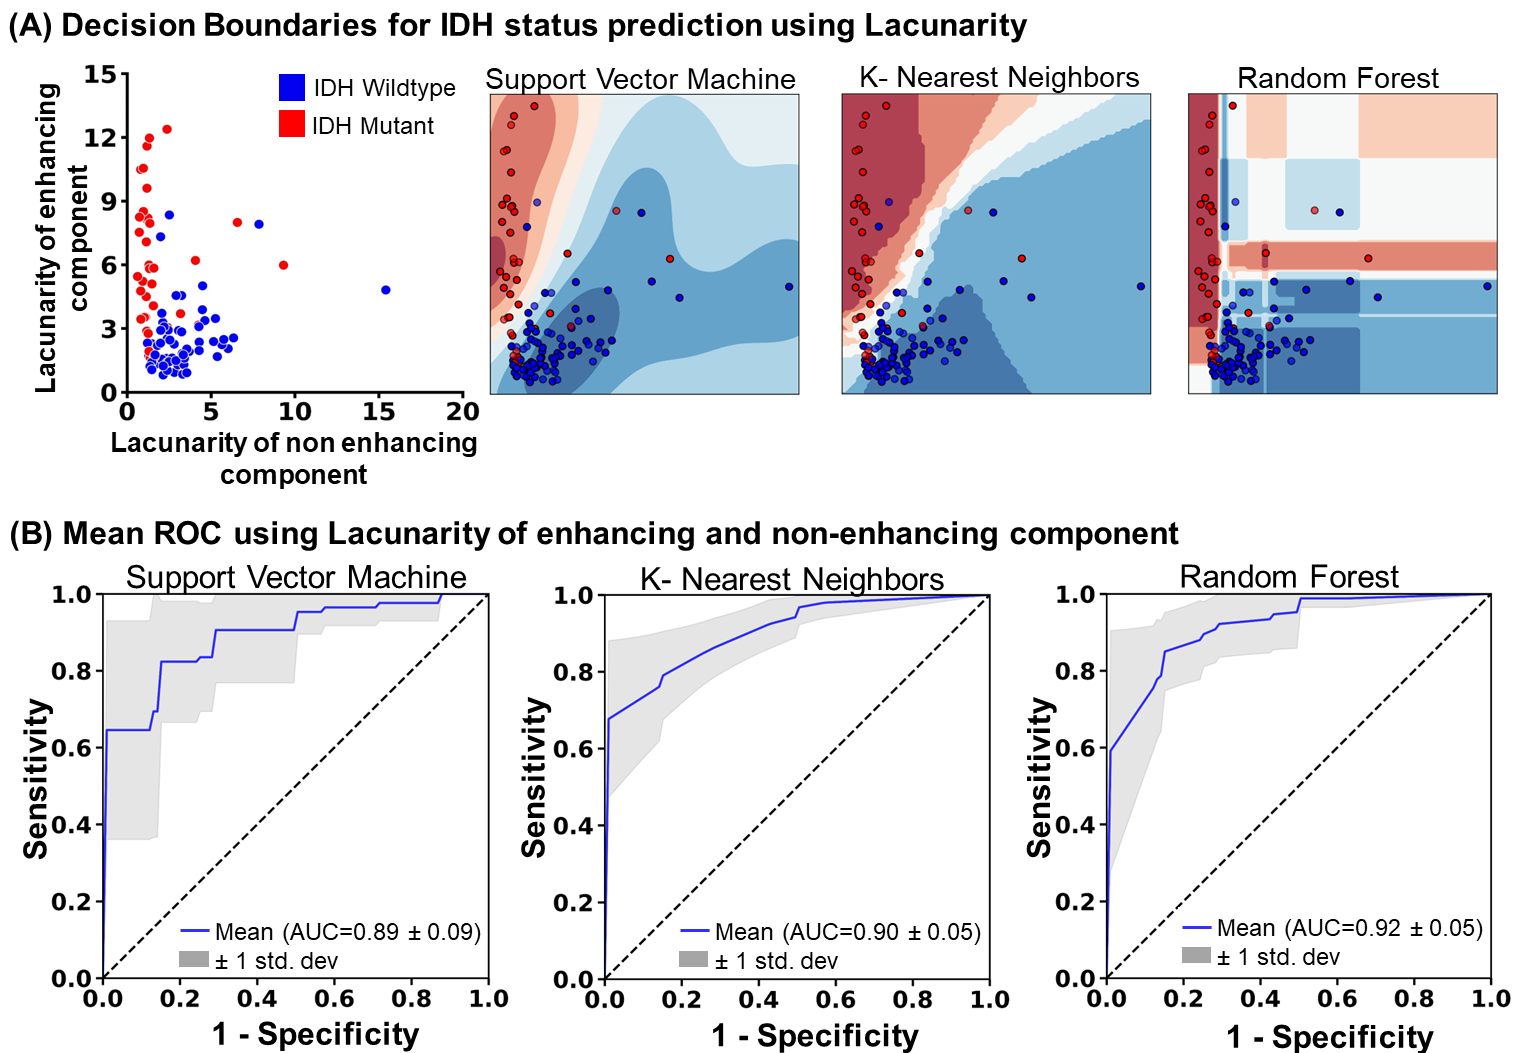
Measurement of the Fractal Dimension of enhancing subcomponent revealed significantly higher fractality and lower lacunarity in the IDH wildtype gliomas compared to IDH mutant gliomas. However, the IDH mutant exhibited significantly higher FD and lower Lacunarity for the nonenhancing subcomponent. FD and lacunarity of the edema subcomponent were not distinct for IDH status (Fig1). Additionally, the FD and Lacunarity of enhancing component and nonenhancing components showed significant differences between MGMT-methylated and unmethylated tumors (Fig. 2). A combination of FD of enhancing and nonenhancing subcomponents wrapped in the SVM model was able to discriminate the IDH-mutant and wildtype status accurately with ROC-AUC of 0.92, and the KNN and RF models achieved AUCs of 0.89 and 0.88, respectively (Fig.3). Lacunarity based models provided similar accuracy, with SVM achieving an AUC of 0.89, KNN an AUC of 0.90, and RF an AUC of 0.92 (Fig.4). Whereas, any combination Fractal dimension or Lacunarity of tumor subcomponents did not provide reliable accuracy for discrimination of MGMT status (Fig.5 C, D).DISCUSSION
The Higher fractal dimension and lower lacunarity in the enhancing component indicated IDH wildtype tumors, corresponding to their rapid metabolic and growth characteristics. Conversely, IDH mutant gliomas exhibited lower fractal dimension and lacunarity in the non-enhancing component, consistent with its slower growth.The combination of fractal dimension or lacunarity of both enhancing and nonenhancing subcomponents as classifying features for the three machine learning classifiers was highly accurate and sensitive in discriminating between IDH mutant and IDH wildtype glioma (Fig.5 A, B). However, it's important to note that the same combination exhibited reduced accuracy when classifying tumors based on their MGMT molecular status (Fig.5 C, D).
CONCLUSION
Fractal Dimension and Lacunarity of Glioma subcomponents are unique for IDH Mutant and IDH Wild-type gliomas, wherein a high fractal dimension is observed in the enhancing component of the tumor for IDH wildtype tumors compared to IDH mutants, while enhanced fractality in the nonenhancing component is observed in IDH mutant tumors. Fractal geometry estimation offers a Quantitative non-invasive tool for establishing molecular status specifically for IDH-mutation status, thereby improving the clinical management of glioma patients.Acknowledgements
- The study is funded by DST-SERB and Indian Council of Medical Research (ICMR).
- The MRI and Genomic data for glioma subjects was obtained from TCIA repositories.
References
- Shyamala, K., H. C. Girish, and Sanjay Murgod. "Risk of tumor cell seeding through biopsy and aspiration cytology." Journal of International Society of Preventive & Community Dentistry 4.1 (2014): 5
- Clark K, Vendt B, Smith K, Freymann J, Kirby J, Koppel P, Moore S, Phillips S, Maffitt D, Pringle M, Tarbox L, Prior F. The Cancer Imaging Archive (TCIA): Maintaining and Operating a Public Information Repository, Journal of Digital Imaging, Volume 26, Number 6, December, 2013, pp 1045-1057. DOI: 10.1007/s10278-013-9622-7
- Bakas S, Akbari H, Sotiras A, Bilello M, Rozycki M, Kirby J, Freymann J, Farahani K, Davatzikos C. (2017) Segmentation Labels and Radiomic Features for the Pre-operative Scans of the TCGA-LGG collection [Data Set]. The Cancer Imaging Archive. DOI: 10.7937/K9/TCIA.2017.GJQ7R0EF
- Bakas S, Akbari H, Sotiras A, Bilello M, Rozycki M, Kirby J, Freymann J, Farahani K, Davatzikos C. (2017). Segmentation Labels for the Pre-operative Scans of the TCGA-GBM collection [Data set]. The Cancer Imaging Archive. DOI: 10.7937/K9/TCIA.2017.KLXWJJ1Q
- Bakas S, Akbari H, Sotiras A, Bilello M, Rozycki M, Kirby J, Freymann J, Farahani K, Davatzikos C. (2017) Advancing The Cancer Genome Atlas glioma MRI collections with expert segmentation labels and radiomic features Nature Scientific Data, 4:170117 DOI: 10.1038/sdata.2017.117
- Kroell, N., (2021). imea: A Python package for extracting 2D and 3D shape measurements from images. Journal of Open Source Software, 6(60), 3091, https://doi.org/10.21105/joss.03091
- Plotnick, Roy E., Robert H. Gardner, and Robert V. O'Neill. "Lacunarity indices as measures of landscape texture." Landscape ecology 8 (1993): 201-211.
Figures