0024
Combined DW-MRI and DW-MRS sensitivity to glioma tumour microenvironment: a preliminary study1Cardiff University Brain Research Imaging Centre (CUBRIC), School of Psychology, Cardiff University, Cardiff, United Kingdom, 2School of Computer Science, Cardiff University, Cardiff, United Kingdom, 3NMR Research Unit, Queen Square MS Centre, Department of Neuroinflammation, UCL Queen Square Institute of Neurology, Faculty of Brain Sciences, University College London, London, United Kingdom, 4Department of Medical Physics and Biomedical Engineering, University College London, London, United Kingdom, 5Centre for Medical Image Computing, Department of Computer Science, University College London, London, United Kingdom, 6Centre for Medical Image Computing, Medical Physics and Biomedical Engineering, University College London, London, United Kingdom, 7Centre for Medical Image Computing, Medical Physics & Biomedical Engineering, University College London, London, United Kingdom, 8Department of Radiology, C.J. Gorter MRI Center, Leiden University Medical Center, Leiden, Netherlands, 9In Vivo Imaging, The Francis Crick Institute, London, United Kingdom, 10Centre for Medical Image Computing, University College London, London, United Kingdom, 11NMR UCL Queen Square Institute of Neurology, University College London, London, United Kingdom, 12Clinical Imaging Sciences Centre, Brighton and Sussex Medical School, University of Sussex, Brighton, United Kingdom, 13NMR Research Unit, Queen Square UCL Queen Square Institute of Neurology, University College London, London, United Kingdom
Synopsis
Keywords: Tumors (Pre-Treatment), Cancer, Microstructure, Diffusion, Spectroscopy
Motivation: Understanding the complexity of the tumour microenvironment is critical for understanding glioma progression and developing effective therapies.
Goal(s): To develop a non-invasive imaging pipeline for characterization of the glioma tumor microenvironment.
Approach: Combining DW-MRI and DW-MRS to enhance the characterization of a spectrum of gliomas as a feasibility study.
Results: Changes in neuronal (tNAA) and glial (tCho) metabolites apparent diffusion coefficients suggest neuronal atrophy and glial activation/reaction in tumor core, respectively. Changes in intracellular and extracellular volume fractions and extracellular diffusivity quantified by DW-MRI support and complement metabolite DW-MRS result and further suggest a more infiltrative marging in IDH mutant tumors.
Impact: Combination DW-MRI and DW-MRS has potential to characterize the glioma microenvironment for improved understanding of radio-resistance and developing more effective therapies.
Introduction
The glioma tumor microenvironment (TME) plays a major role in tumorigenesis and progression of gliomas, encompassing a complex network of cells and biomolecules that contribute to radio-resistance and poor outcomes1.Diffusion-weighted (DW) MRI probes tissue microstructure non-invasively with high sensitivity but lacks cellular specificity2. Metabolite diffusion-weighted MR spectroscopy (DW-MRS) sensitizes MR spectra to diffusion of intracellular metabolites, providing information about specific cellular morphology3.
Here we combine DW-MRI and DW-MRS to characterize TME changes in patients diagnosed with a spectrum of gliomas. We hypothesized that estimates from biophysical modelling (NODDI4 and VERDICT5) of DW-MRI measurements are sensitive to overall microstructural alterations of the TME, whilst changes in the apparent diffusion coefficient (ADC) of N-Acetyl-Aspartate (NAA) provide more direct information on neuronal microstructural alterations and changes in total choline’s ADC are linked to glial microstructural alterations.
Methods
All subjects were scanned on a 3T Philips Ingenia CX system with a 32ch head coil.Recruitment: 10 patients (5 male, mean age 47.7 years, range 22-76 years) with newly diagnosed glioma were recruited and images following informed consent. Glioma subtypes: WHO IV IDHwt GBM (n=4), WHO III IDHmut Astrocytoma (n=1), WHO II IDHmut Astrocytoma/oligodendroglioma (n=3) WHO I glioneuronal tumor (n=2).
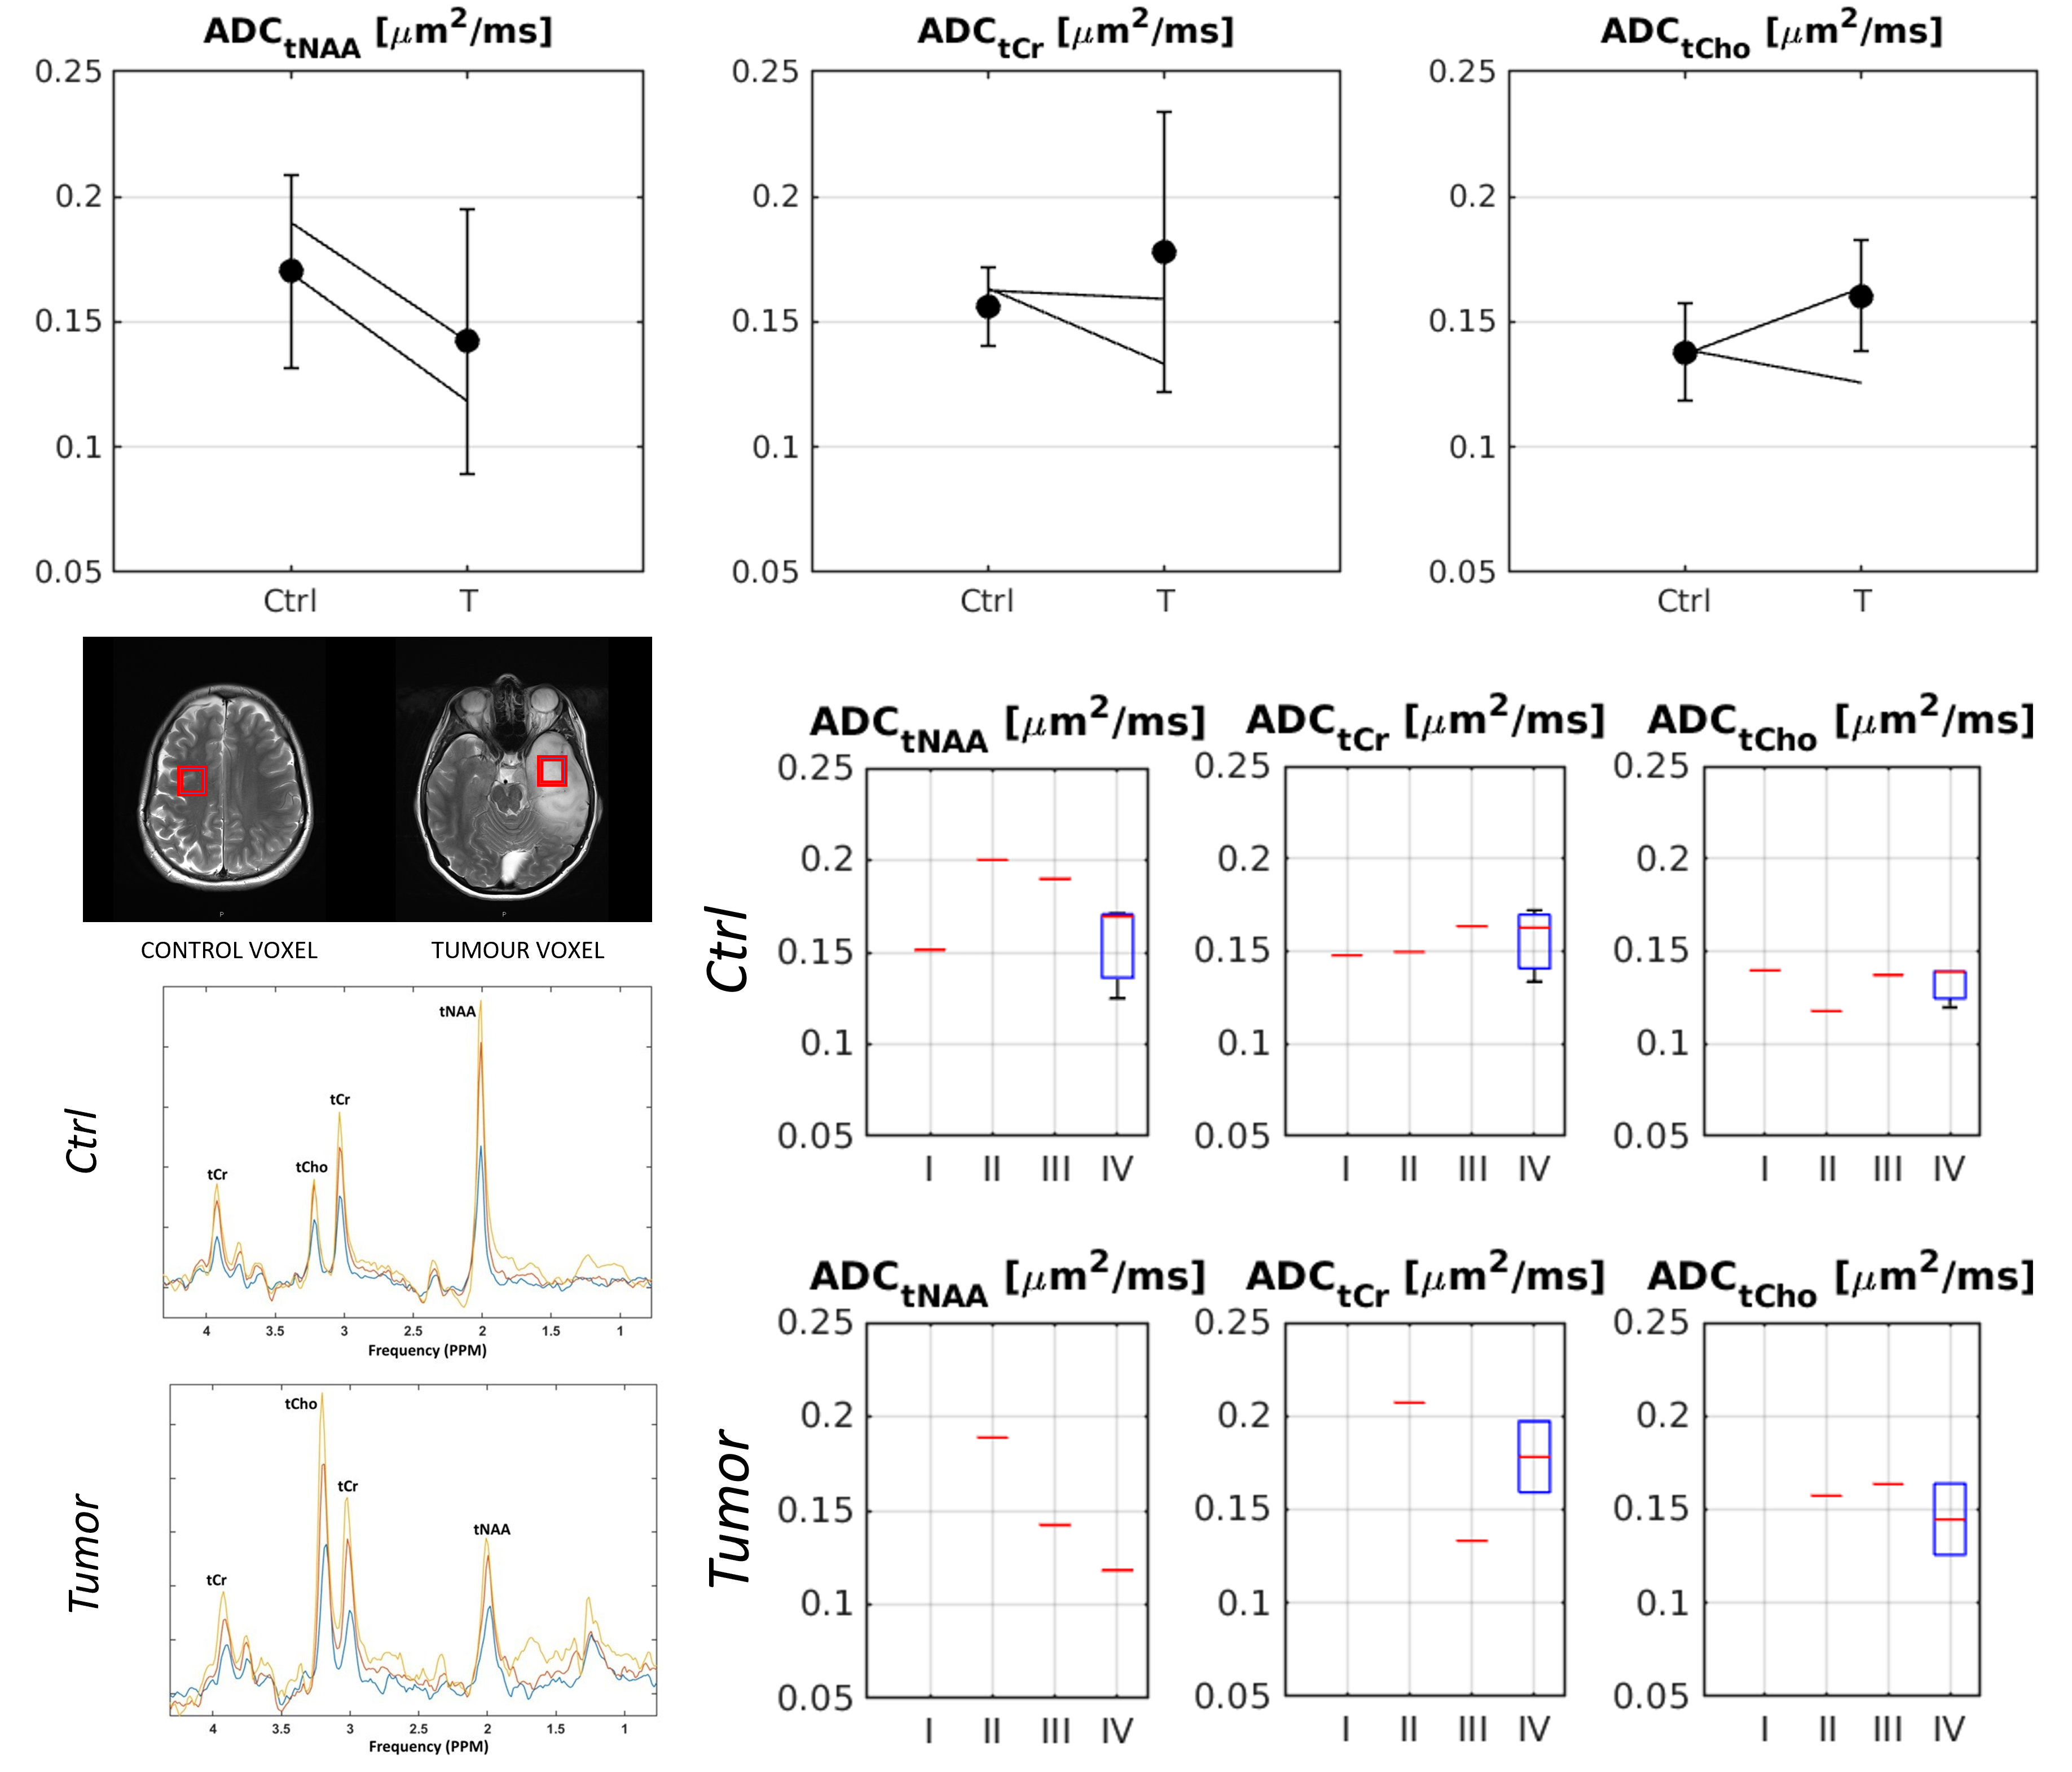
DW-MRS protocol: A voxel of 20x20x20mm was positioned using a 3D T1w sequence in the tumor/peritumoral region and in contralateral healthy-appearing tissue (Fig.1). A water-suppressed PRESS sequence was used with a bipolar diffusion weighting scheme, TR=3RR, TE=90ms, spectral bandwidth 2000Hz, number of points 1024, 108 dynamic scans, gradient amplitudes of 5mTm-1, 20mTm-1, 40mTm-1, and three orthogonal directions resulting in b-values of 60, 956 and 3823 s/mm2, respectively. An acquisition without water suppression was also performed for eddy current correction.
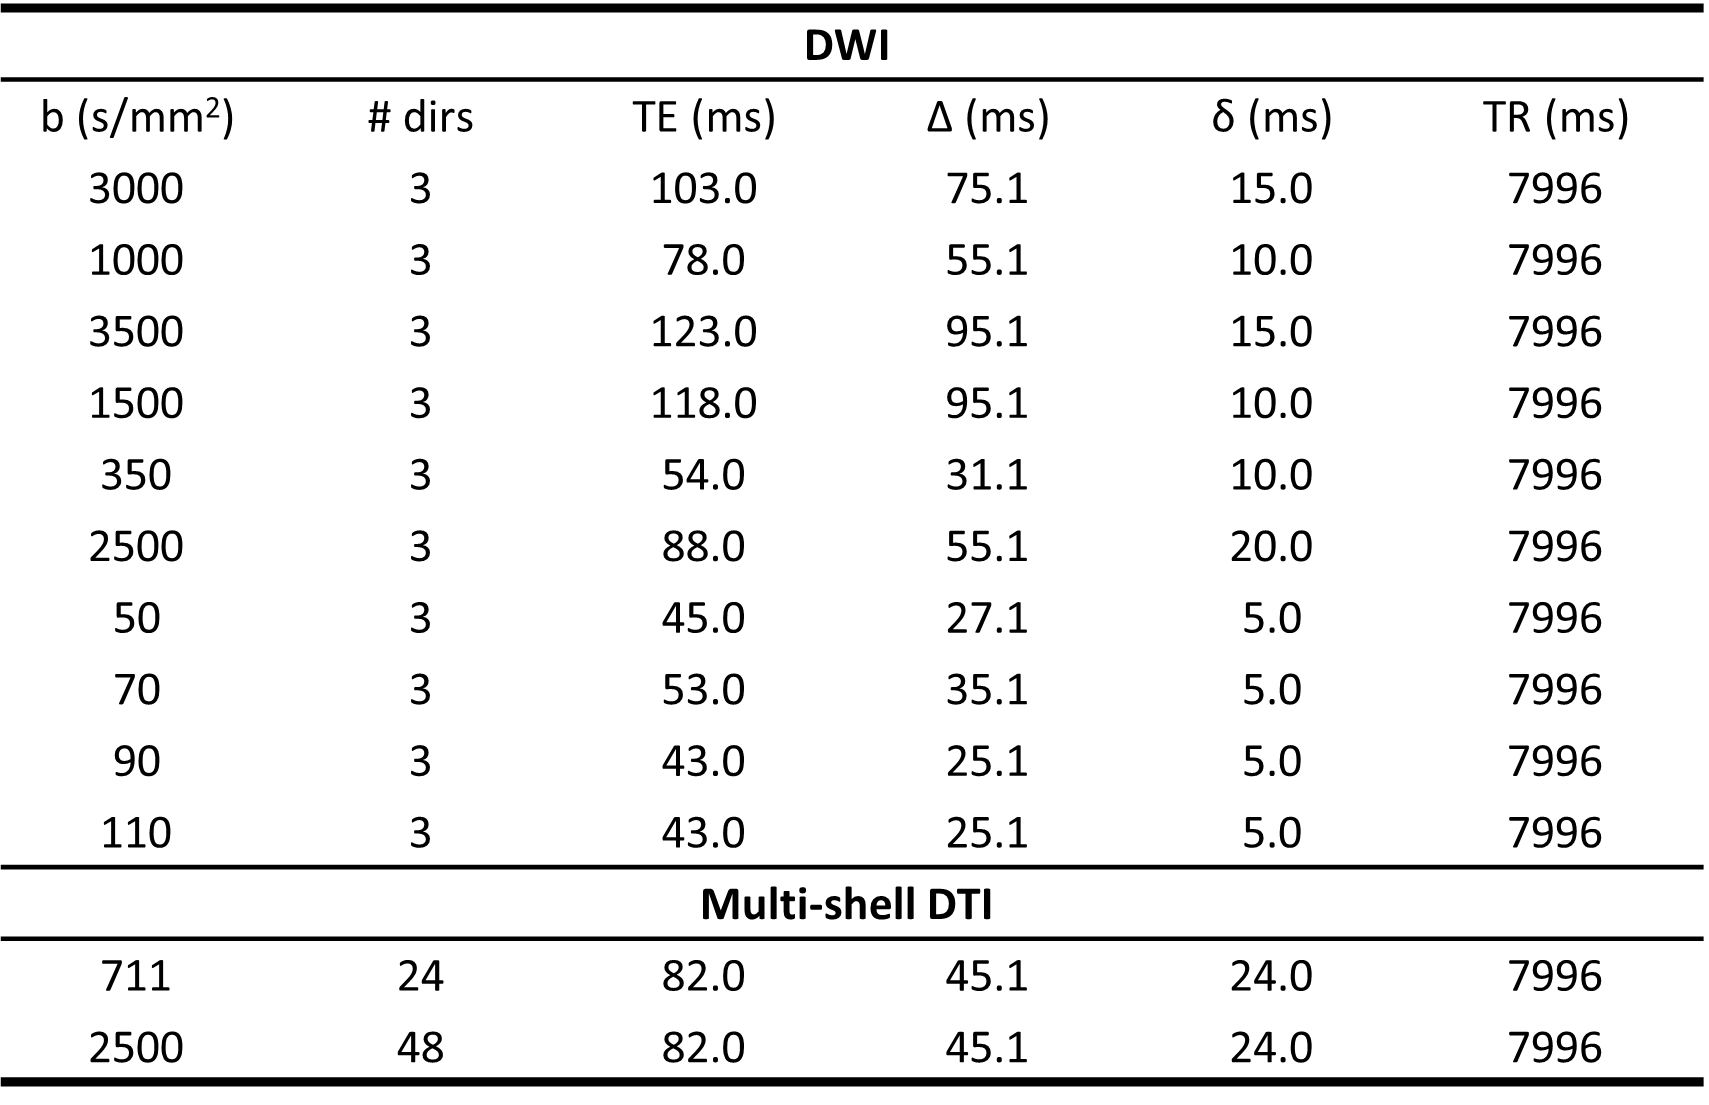
DW-MRI protocol: see Tab.1
DW-MRS analysis: Spectral registration across transients for each DW condition was used to correct for phase/frequency drifts. A threshold was set to discard transients with significant drop in amplitude due to non-translational motion. Data were then combined per DW condition, and averaged over gradient directions for b-value. Spectral quantification was performed with LCModel with an appropriate basis set. The LCModel estimates for total NAA (tNAA = NAA + NAAG), total creatine (tCr = Cr + PCr) and total choline (tCho = Cho + PCho + GPC) were used to calculate the ADC for these metabolites.
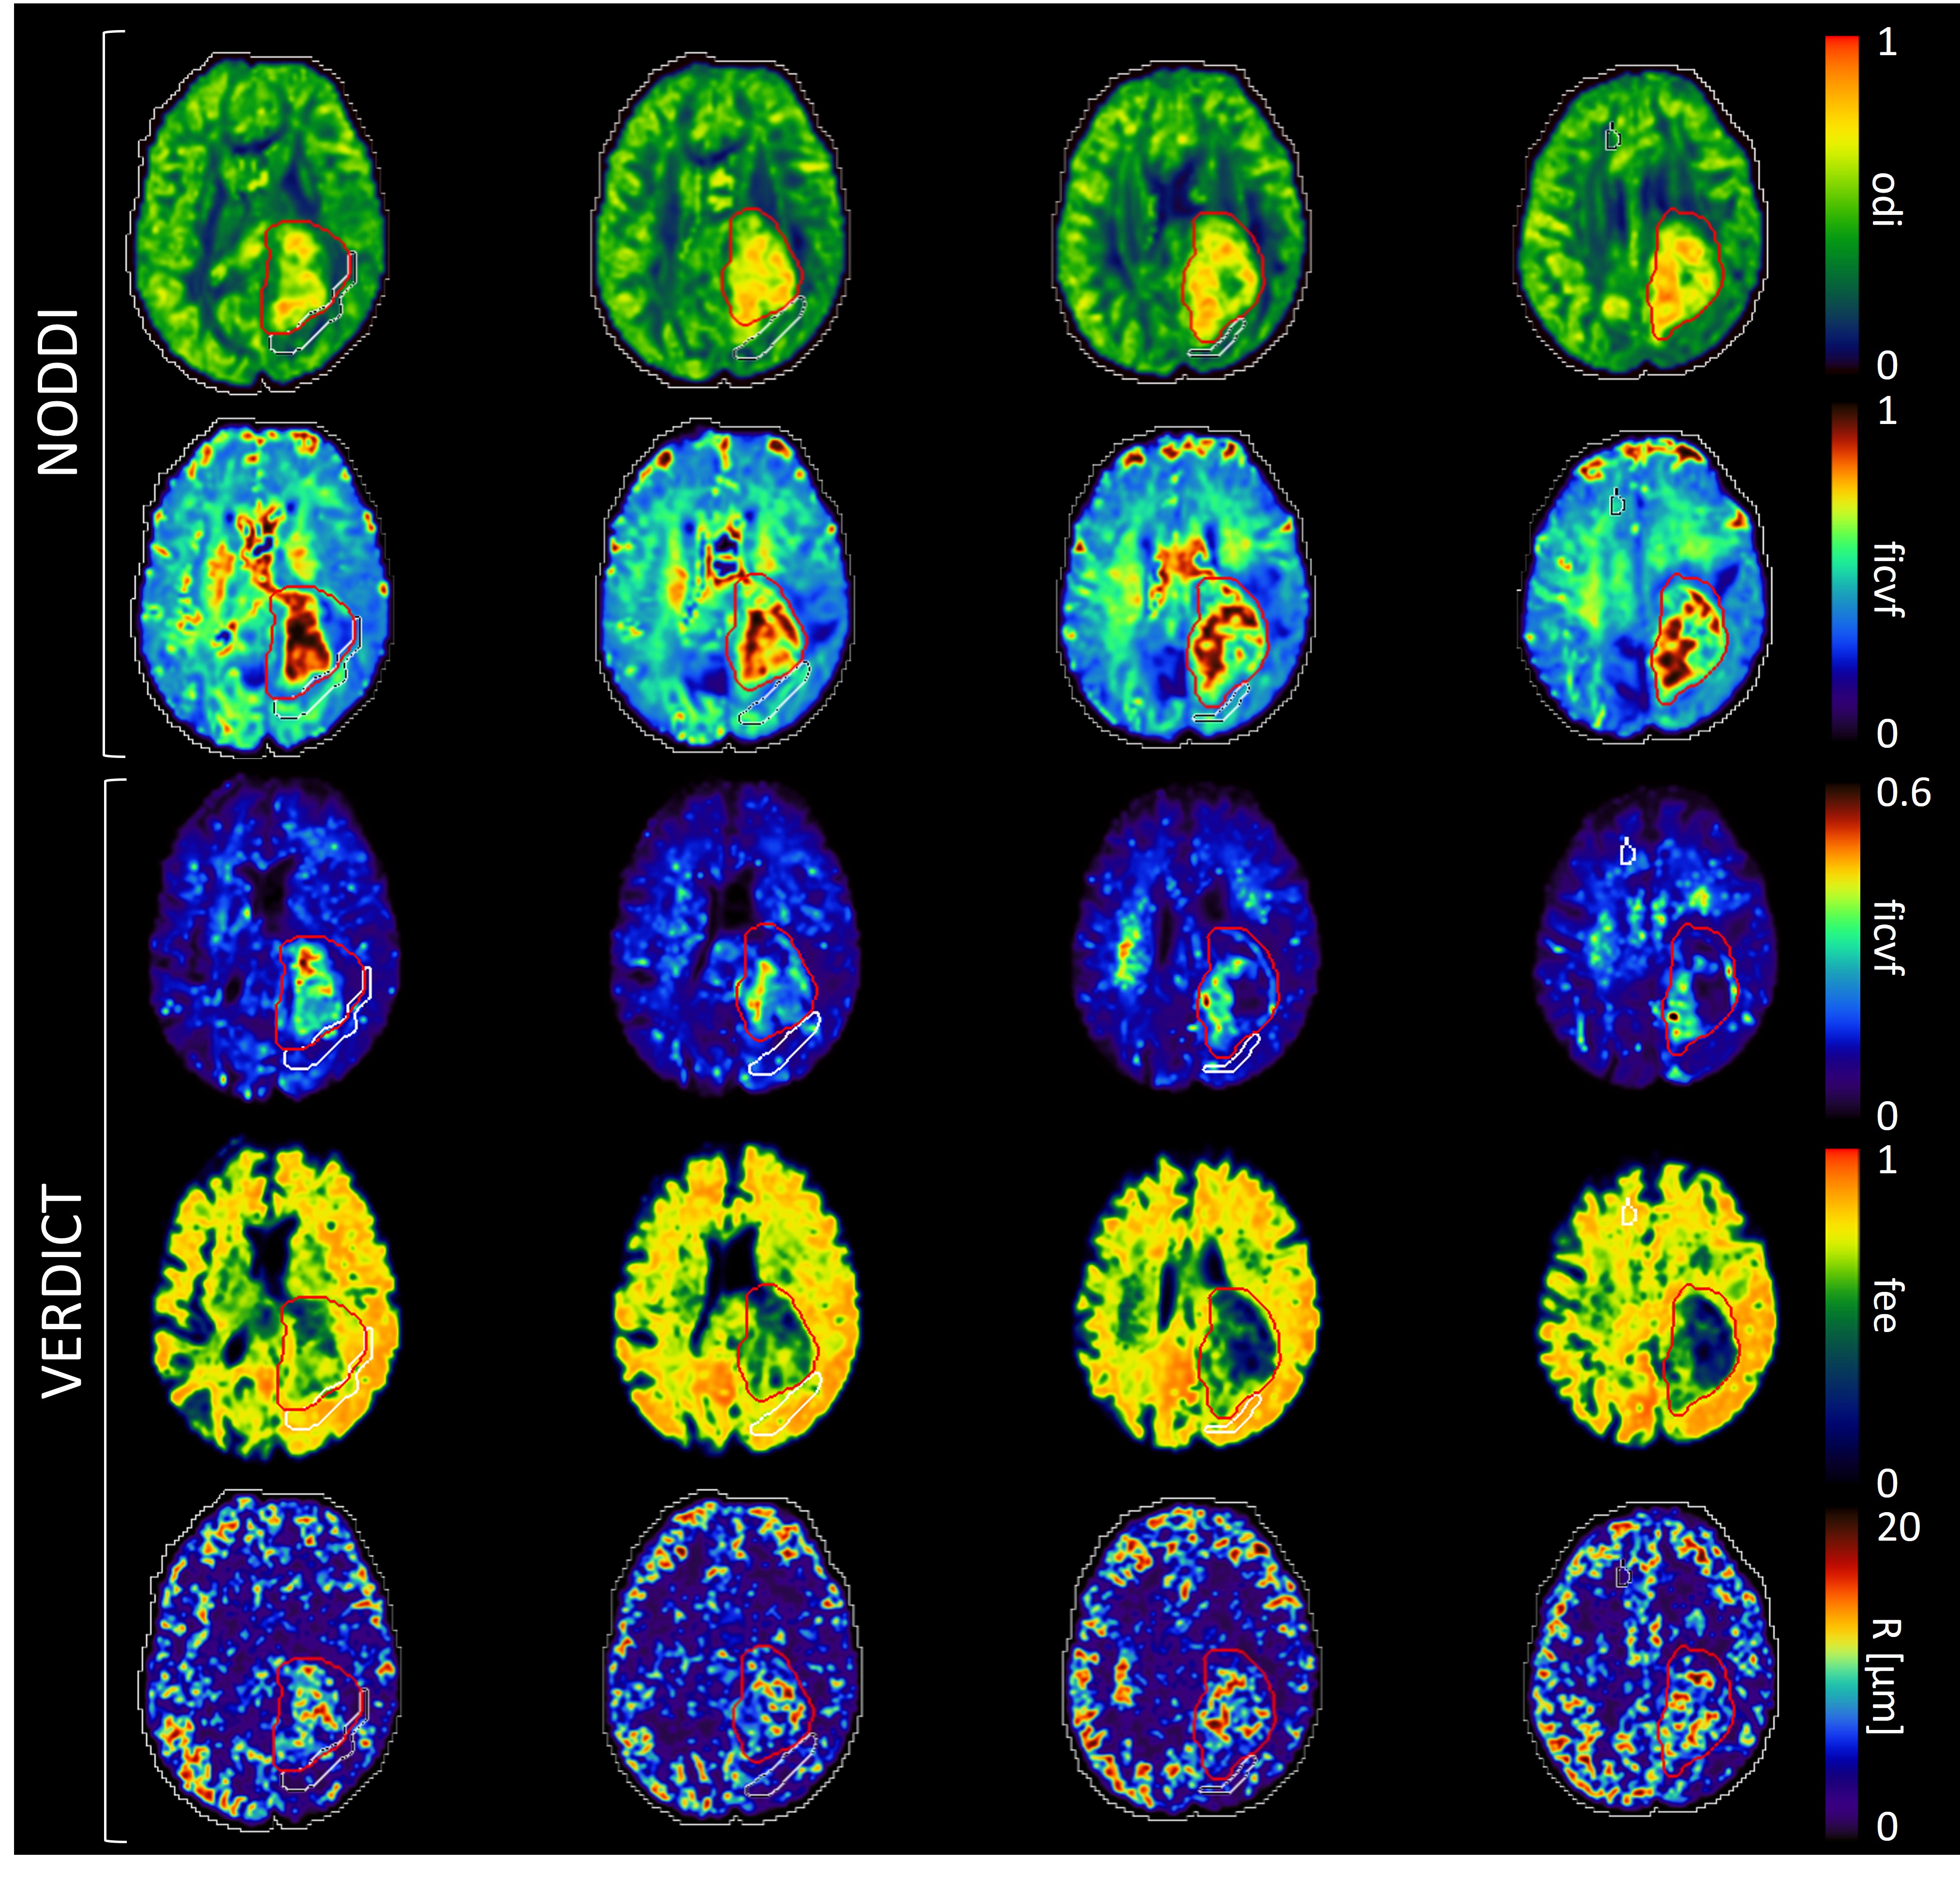
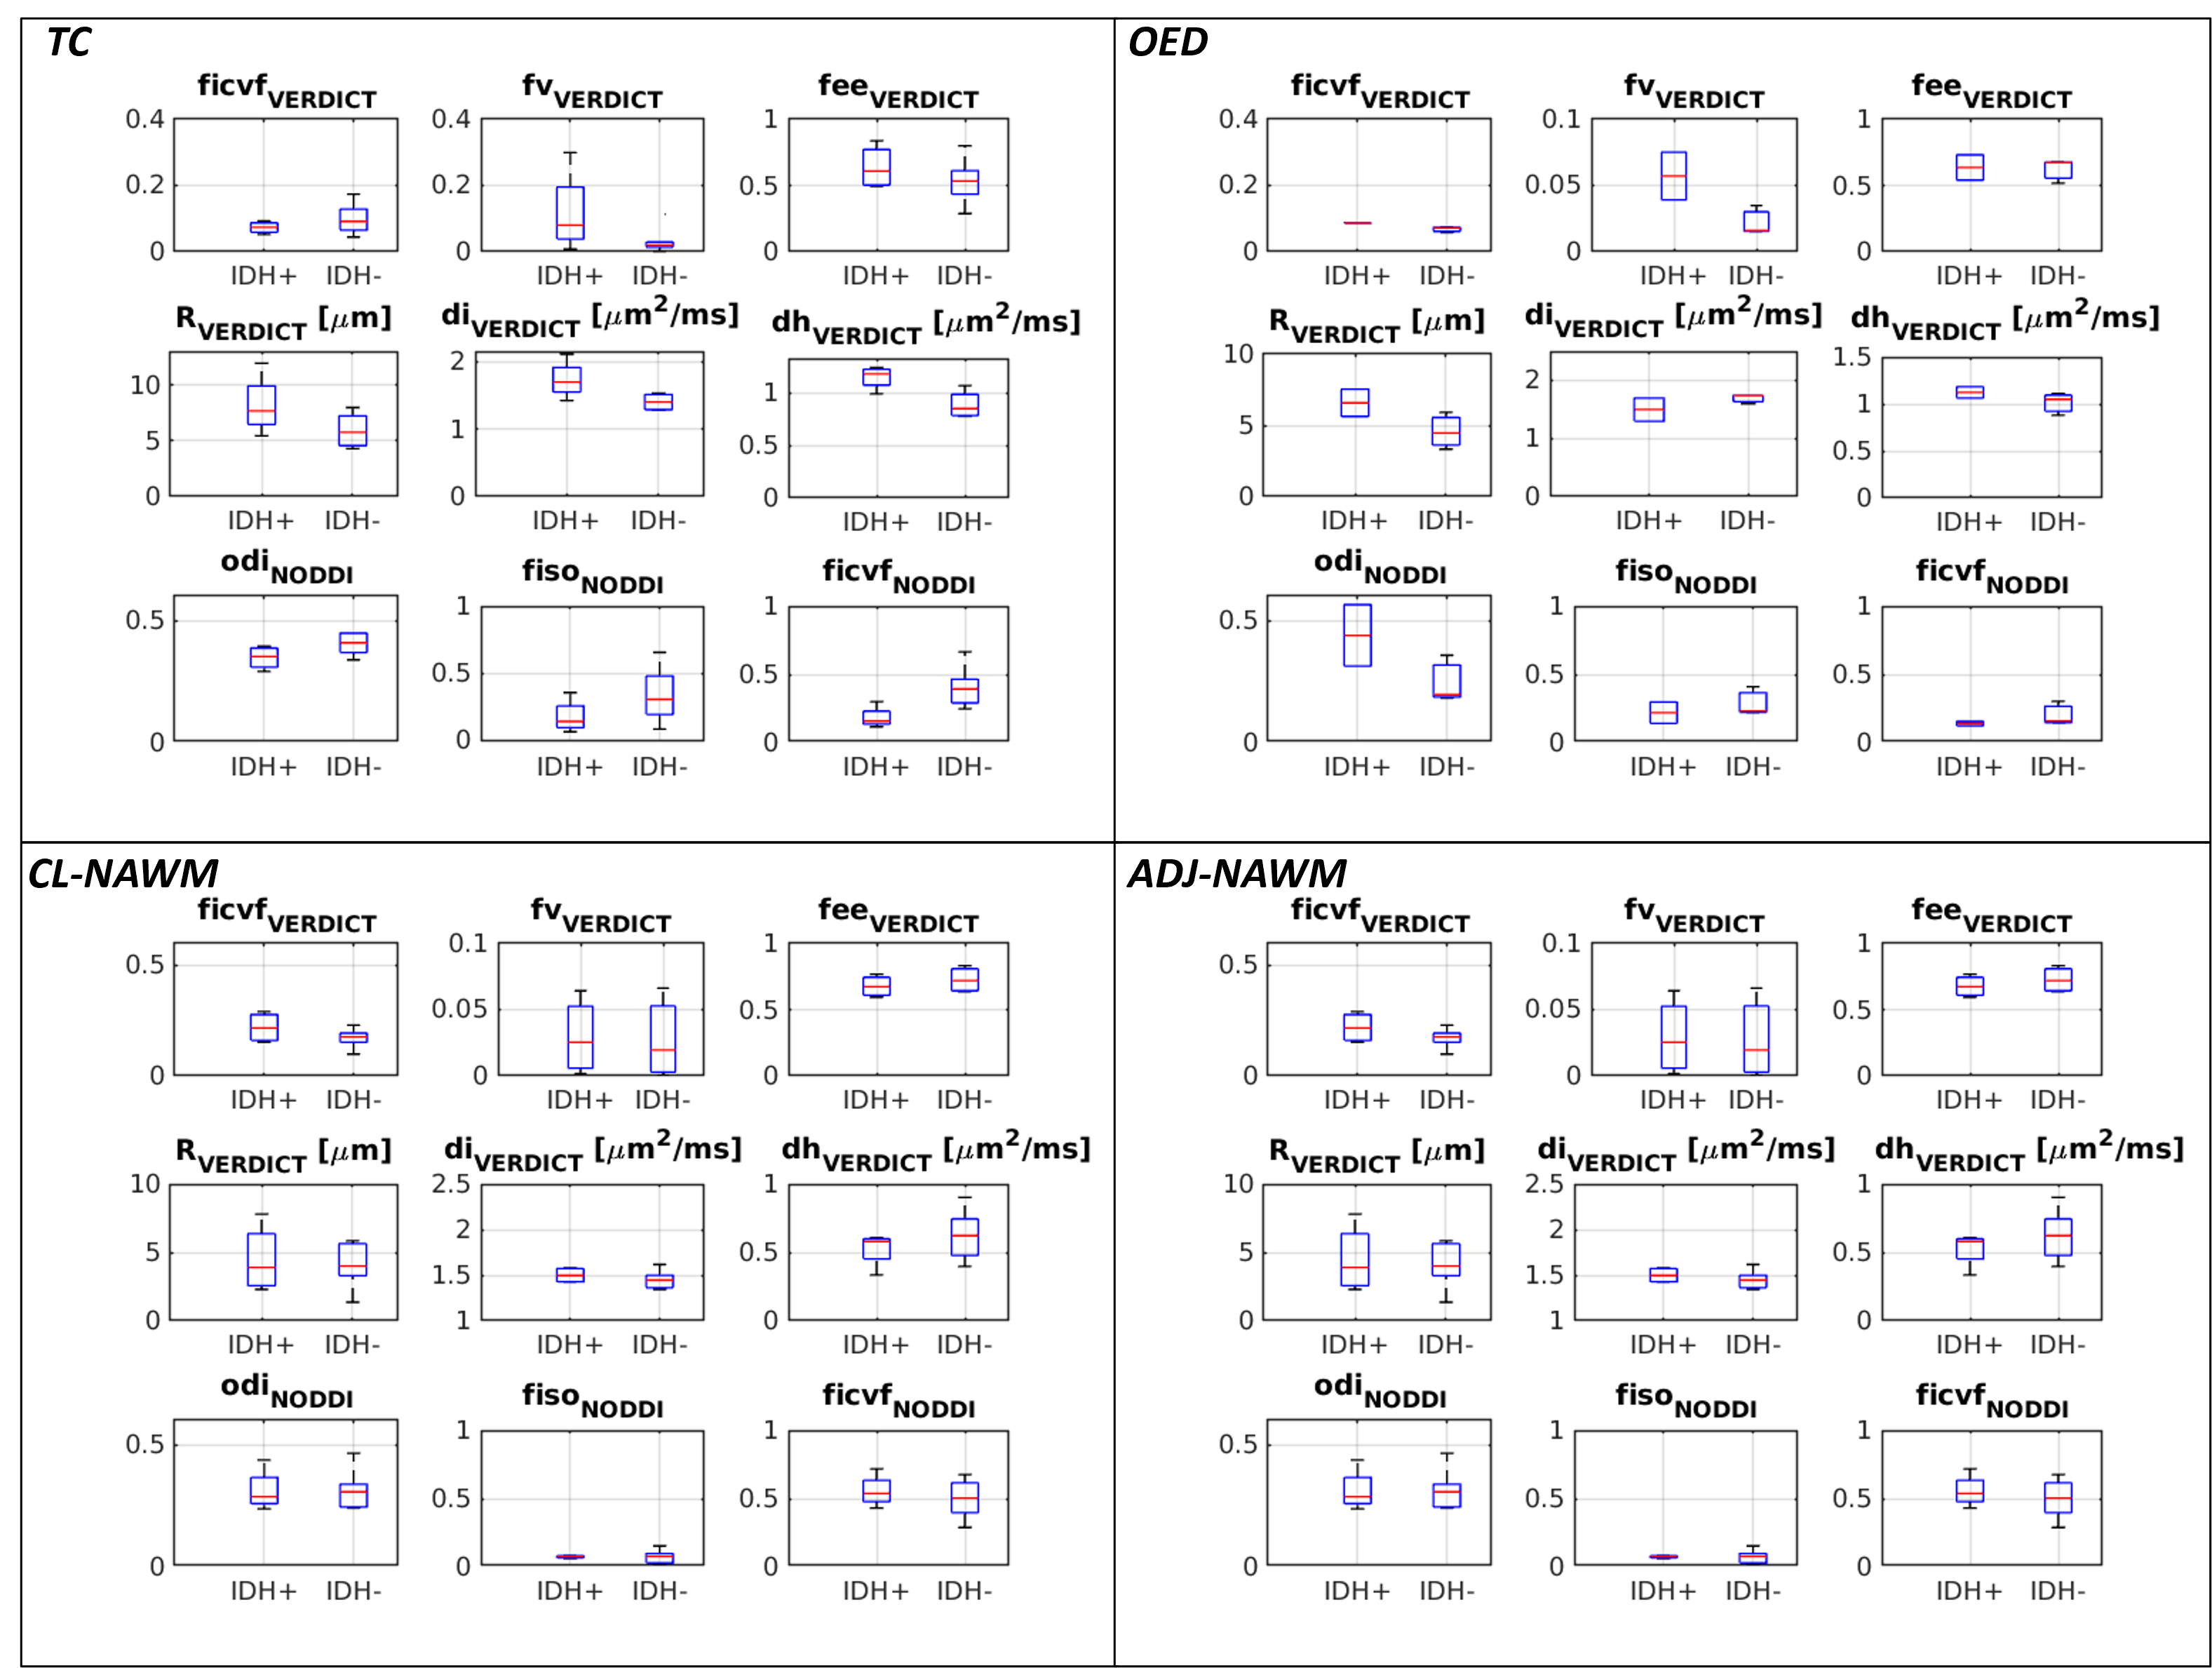
DW-MRI analysis: The NODDI model was fitted to the last two shells (b=711 and b=2500 s/mm2) using the NODDI toolbox6 to estimate neurite orientation dispersion index, odiNODDI, and intra-neurite volume fraction ficvfNODDI. The sotropic compartment fraction, fiso, was used to fix the value of the free water fraction in the recently-proposed VERDICT model modified for brain tumors5. We fitted this VERDICT model to the data at all b values using in-house Matlab code to obtain estimates of the intracellular signal fraction ficvfVERDICT, cell radius RVERDICT, extracellular and extravascular signal fraction, feesVERDICT, radial and axial extracellular diffusivities, diVERDICT and dhVERDICT, and vascular signal fraction fvVERDICT (Fig. 2).
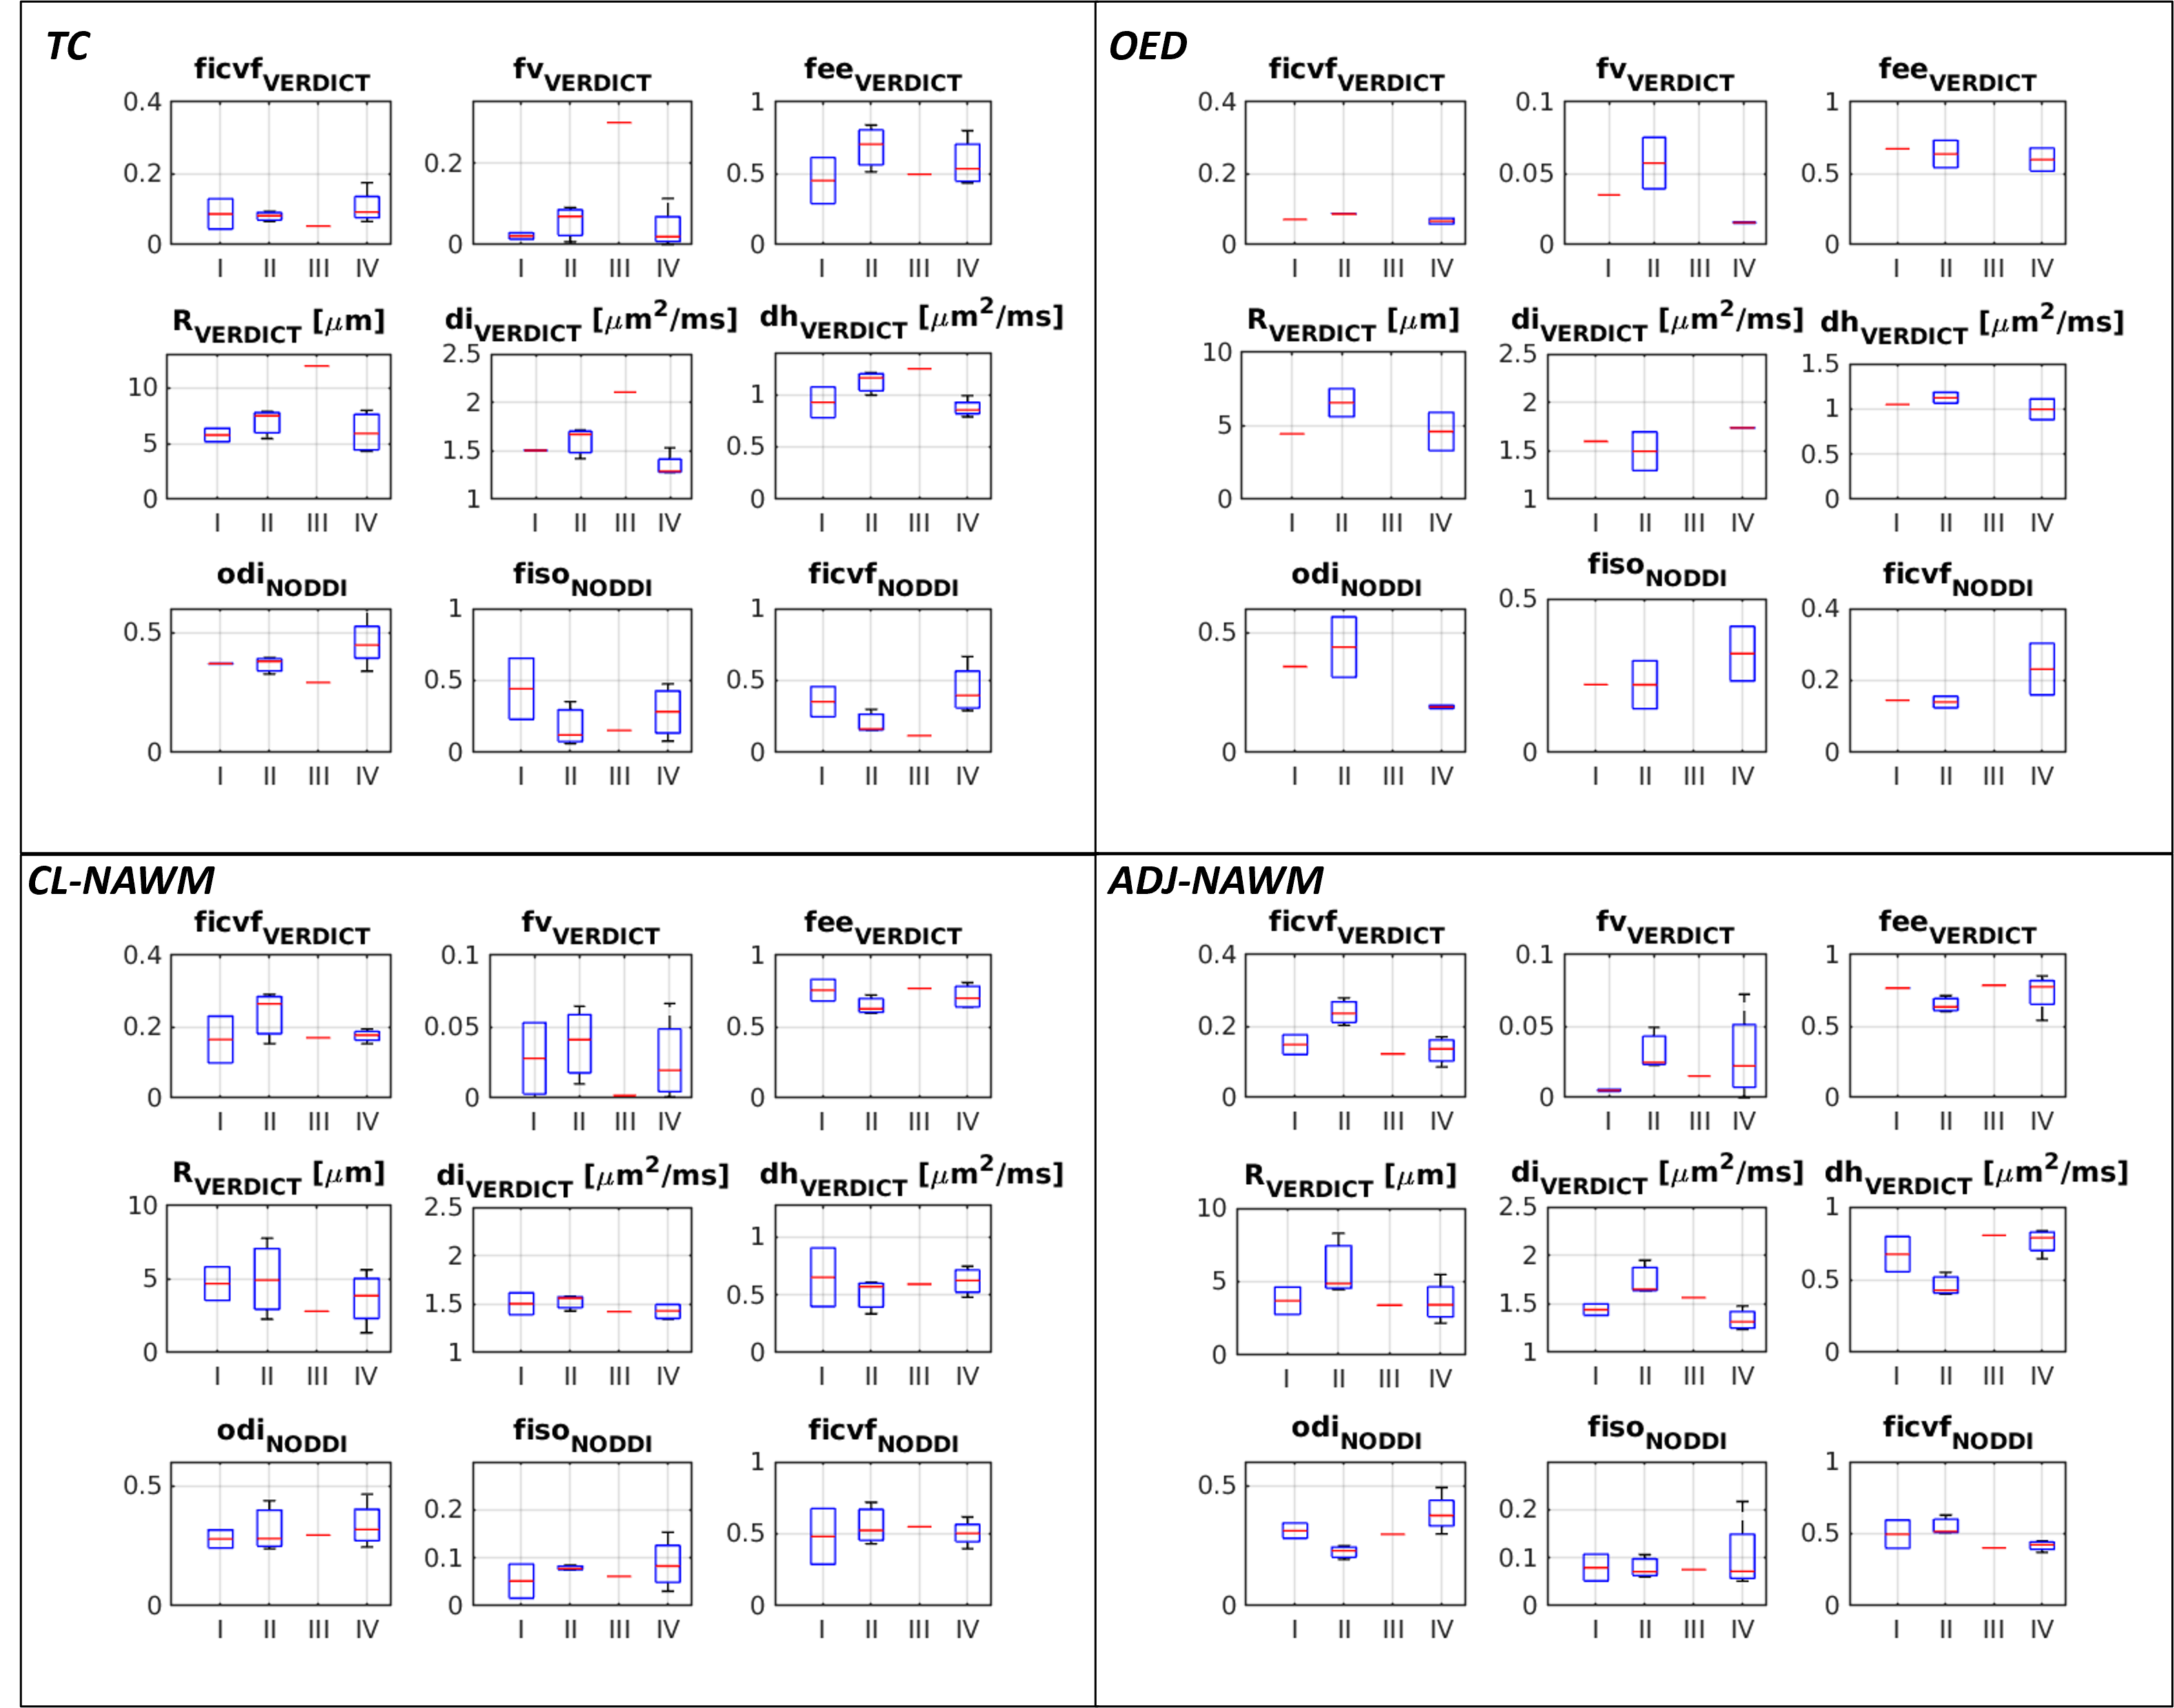
ROI analysis: four regions-of-interest (ROIs) were drawn by expert neuroradiologists on DW-MRI data: TC, tumor core; OED, oedema; CT-NAWM, contralateral normal-appearing-white-matter; ADJ-NAMW, adjacent normal-appearing-white-matter.
Results and Discussion
Fig.2 shows that in the TC the tNAA’s ADC is decreased compared to contralateral normal appearing tissue, suggesting neuronal atrophy7,8, while tCho’s ADC slightly increases, suggesting some glial activation/reaction9. Although not statistically significant due to the small sample size (two-way ANOVA with Bonferroni correction), we observe a general trend of decreasing tNAA’s ADC with increasing WHO grade only in the tumor, which may suggest larger alterations of the neuronal component of the TME. In contrast, tCho’s ADC seems stable across WHO grades, indicative of minimal changes in glial activation.Fig.3-4 shows boxplots of ADC values for all four ROIs in each patient. We observe increasing feesVERDICT , dhVERDICT and decreasing ficvfNODDI with increasing WHO grade in the TC but not in the CL-NAWM, ADJ-NAWM or OED, suggesting TME-specific cellular lost; this agrees with the corresponding decreases observed in tNAA’s ADC. However, due to the small sample size, these differences are not statistically significant. Interestingly, we observed a significant decrease of ficvfNODDI (p=0.021) and increase of dhVERDICT (p=0.034) in IDH mutant versus IDH wildtype TC, whilst the opposite (although non-significant) trend was observed in the ADJ-NAWM. This might suggest a more infiltrative margin in IDH mutant TC.
Conclusion
Combined DW-MRI and DW-MRS measurements potentially offer novel characterization of the glioma TME, essential for understanding mechanisms of radio-resistance and for developing more effective therapies.Acknowledgements
MP is supported by UKRI Future Leaders Fellowship grant no. MR/T020296/2. EP is supported by EPSRC grants EP/S031510/1.References
- Garcia-Diaz, C., Pöysti, A., Mereu, E., Clements, M.P., Brooks, L.J., Galvez-Cancino, F., Castillo, S.P., Tang, W., Beattie, G., Courtot, L. and Ruiz, S., 2023. Glioblastoma cell fate is differentially regulated by the microenvironments of the tumor bulk and infiltrative margin. Cell Reports, 42(5).
- Alexander, Daniel C., Tim B. Dyrby, Markus Nilsson, and Hui Zhang. "Imaging brain microstructure with diffusion MRI: practicality and applications." NMR in Biomedicine 32, no. 4 (2019): e3841.
- Palombo, Marco, Noam Shemesh, Itamar Ronen, and Julien Valette. "Insights into brain microstructure from in vivo DW-MRS." Neuroimage 182 (2018): 97-116.
- Zhang, Hui, Torben Schneider, Claudia A. Wheeler-Kingshott, and Daniel C. Alexander. "NODDI: practical in vivo neurite orientation dispersion and density imaging of the human brain." Neuroimage 61, no. 4 (2012): 1000-1016.
- Figini, Matteo, Antonella Castellano, Michele Bailo, Marcella Callea, Marcello Cadioli, Samira Bouyagoub, Marco Palombo et al. "Comprehensive brain tumour characterisation with VERDICT-MRI: Evaluation of cellular and vascular measures validated by histology." Cancers 15, no. 9 (2023): 2490.
- http://mig.cs.ucl.ac.uk/index.php?n=Tutorial.NODDImatlab
- Rigotti, D. J., M. Inglese, and Oded Gonen. "Whole-brain N-acetylaspartate as a surrogate marker of neuronal damage in diffuse neurologic disorders." American Journal of Neuroradiology 28, no. 10 (2007): 1843-1849.
- Ronen, Itamar, Matthew Budde, Ece Ercan, Jacopo Annese, Aranee Techawiboonwong, and Andrew Webb. "Microstructural organization of axons in the human corpus callosum quantified by diffusion-weighted magnetic resonance spectroscopy of N-acetylaspartate and post-mortem histology." Brain Structure and Function 219 (2014): 1773-1785.
- De Marco, Riccardo, Itamar Ronen, Francesca Branzoli, Marisa L. Amato, Iris Asllani, Alessandro Colasanti, Neil A. Harrison, and Mara Cercignani. "Diffusion-weighted MR spectroscopy (DW-MRS) is sensitive to LPS-induced changes in human glial morphometry: a preliminary study." Brain, Behavior, and Immunity 99 (2022): 256-265.
- Veraart, Jelle, Dmitry S. Novikov, Daan Christiaens, Benjamin Ades-Aron, Jan Sijbers, and Els Fieremans. "Denoising of diffusion MRI using random matrix theory." Neuroimage 142 (2016): 394-406.
- Kellner, Elias, Bibek Dhital, Valerij G. Kiselev, and Marco Reisert. "Gibbs‐ringing artifact removal based on local subvoxel‐shifts." Magnetic resonance in medicine 76, no. 5 (2016): 1574-1581.
- Tournier, J-Donald, Robert Smith, David Raffelt, Rami Tabbara, Thijs Dhollander, Maximilian Pietsch, Daan Christiaens, Ben Jeurissen, Chun-Hung Yeh, and Alan Connelly. "MRtrix3: A fast, flexible and open software framework for medical image processing and visualisation." Neuroimage 202 (2019): 116137.
- Smith, Stephen M., Mark Jenkinson, Mark W. Woolrich, Christian F. Beckmann, Timothy EJ Behrens, Heidi Johansen-Berg, Peter R. Bannister et al. "Advances in functional and structural MR image analysis and implementation as FSL." Neuroimage 23 (2004): S208-S219.
Figures