0023
Is edema of malignant glioma different from edema of other tumors? Analysis of time dependent diffusion image using ternary plot method1Department of Innovative Biomedical Visualization (iBMV), Nagoya University, Nagoya, Japan, 2Department of Radiology, Nagoya University, Nagoya, Japan, 3Department of Radiological Technology, Nagoya University, Nagoya, Japan, 4Canon Medical Systems Corporation, Otawara, Japan, 5SORD Corporation, Tokyo, Japan
Synopsis
Keywords: Tumors (Pre-Treatment), Diffusion/other diffusion imaging techniques
Motivation: The edema around a malignant glioma contains infiltrating tumor cells. The motivation for this study was to determine the characteristics of the edema of malignant glioma.
Goal(s): The goal is to evaluate the characteristics of edema around malignant gliomas using a combination of the oscillating gradient spin echo and pulsed gradient spin echo.
Approach: The ternary plot method is used to evaluate the characteristics of edema by using a plot of existing tissue as an internal reference.
Results: Edema of malignant gliomas showed a different distribution in relation to the internal reference in the ternary plot method compared to edema of other tumors.
Impact: Ternary plot method was used to present pixel values obtained from oscillating gradient spin echo and pulsed gradient spin echo, and existing tissues were evaluated as internal references, which was thought to enable evaluation of the histological properties of edema.
Background and Purpose
Edema around malignant gliomas is known to contain infiltrating tumor cells. It would be helpful in the diagnosis of edema with tumor cells if edema containing tumor cells were found to have different histological characteristics than edema without tumor cells. The oscillatory gradient spin echo (OGSE) and pulsed gradient spin echo (PGSE) methods allow us to evaluate tissue structure by comparing images with different diffusion times. However, it is difficult to interpret these multiparametric images pixel by pixel. As a solution, we employed a method to integrate pixel values of OGSE, PGSE, and b=0 images using ternary plot.In this study, edema in cases of malignant gliomas were compared with those of other tumors. To evaluate the position of these edemas on the ternary plot, normal thalamus, cerebrospinal fluid of the lateral ventricles, and vitreous humor of the eye were employed as internal references of tissue characteristics and used as the basis of comparison.
Subjects and Methods
This retrospective study was approved by our Institutional Review Board. The study included 11 cases of malignant gliomas, 7 cases of meningiomas, and 5 cases of metastatic brain tumors. OGSE and PGSE images were acquired using a 3T clinical scanner (Vantage Centurian, Canon Medical Systems, Otawara). Images were obtained using echo-planar imaging (TR = 6200 ms, TE = 120 ms, motion inhibition gradient = monopolar, b-values = 0 and 1000 s/mm2, slice thickness = 5 mm, FOV = 220 mm, matrix = 128 × 160). diffusion time (Tdiff) for PGSE was 60 ms; the Tdiff for OGSE was 6.94 ms and the frequency was 44 Hz. From the acquired OGSE and PGSE images, we obtained (1) the apparent diffusion coefficient (ADC) from the OGSE image (OGSE-ADC), which reflects the viscosity of the substrate, (2) the signal ratio between the PGSE and OGSE images (PGSE/OGSE ratio), which reflects the degree of spatial diffusion restriction by the microstructure of the tissue, and (3) the signal value of the b (3) the signal value of the b=0 image (b0), which reflects the water content of the tissue. These parameters were measured in the edema area around the tumor in each case. Similar measurements were taken for the thalamus, vitreous and lateral ventricular bodies as internal references. Values were normalized and plotted using the ternary plot method by the "RIAA tool" software, which creates triplots from DICOM images.Results
ternary plot, the line connecting the thalamic and ventricular plots was divided into five sections: A, B, C, D, and E from the side closer to the ventricular plot; the side closer to the vitreous compartment than the line was designated (-) and the side farther away was designated (+) (Figure 2). The center of the tumor plot in each case was counted based on which section it fell into, and the characteristic distribution by tumor type was examined. Edema around malignant glioma was significantly more common in the (+) region compared to edema of other tumors (p<0.01). On the other hand, no significant trend was shown for the distribution of A-E.Discussion and conclusion
Conventionally, diffusion images have been acquired by the PGSE method with relatively long diffusion times. Recently, the OGSE method, an imaging technique that can achieve short diffusion times, has been attracting attention. Using the OGSE method, the motion of water molecules can be observed with a shorter diffusion time than with the conventional PGSE method. Combining diffusion images from the OGSE and PGSE methods is useful for distinguishing between slow diffusion of water molecules due to the viscosity of the substrate and spatially restricted diffusion due to the narrow space in which water molecules can diffuse. This can be used to estimate tissue characteristics. However, comparing multiple images pixel by pixel is not easy. We attempted to integrate pixel values from OGSE-ADC images, PGSE/OGSE images, and b=0 images using the ternary plot method to assess tissue properties such as substrate viscosity, spatial restriction of diffusion, and water content. In the ternary plot, tissues such as thalamus, vitreous, and ventricles showed different characteristic distributions, suggesting that they are suitable as internal references. The plot of edema around malignant gliomas showed a different distribution from the plots of other tumors. In conclusion, we believe that the ternary plotting method with three different parameters including OGSE-ADC, PGSE/OGSE ratio, and b0 can evaluate tissue characteristics and structural similarities.Acknowledgements
No acknowledgement found.References
Ichikawa K, Taoka T, Ozaki M, Sakai M, Yamaguchi H, Naganawa S. Impact of tissue properties on time-dependent alterations in apparent diffusion coefficient: a phantom study using oscillating-gradient spin-echo and pulsed-gradient spin-echo sequences. Jpn J Radiol. 2022 Sep;40(9):970-978. Maekawa T, Hori M, Murata K, Feiweier T, Fukunaga I, Andica C, Hagiwara A, Kamagata K, Koshino S, Abe O, Aoki S. Changes in the ADC of diffusion-weighted MRI with the oscillating gradient spin-echo (OGSE) sequence due to differences in substrate viscosities. Jpn J Radiol. 2018 Jul;36(7):415-420.Figures
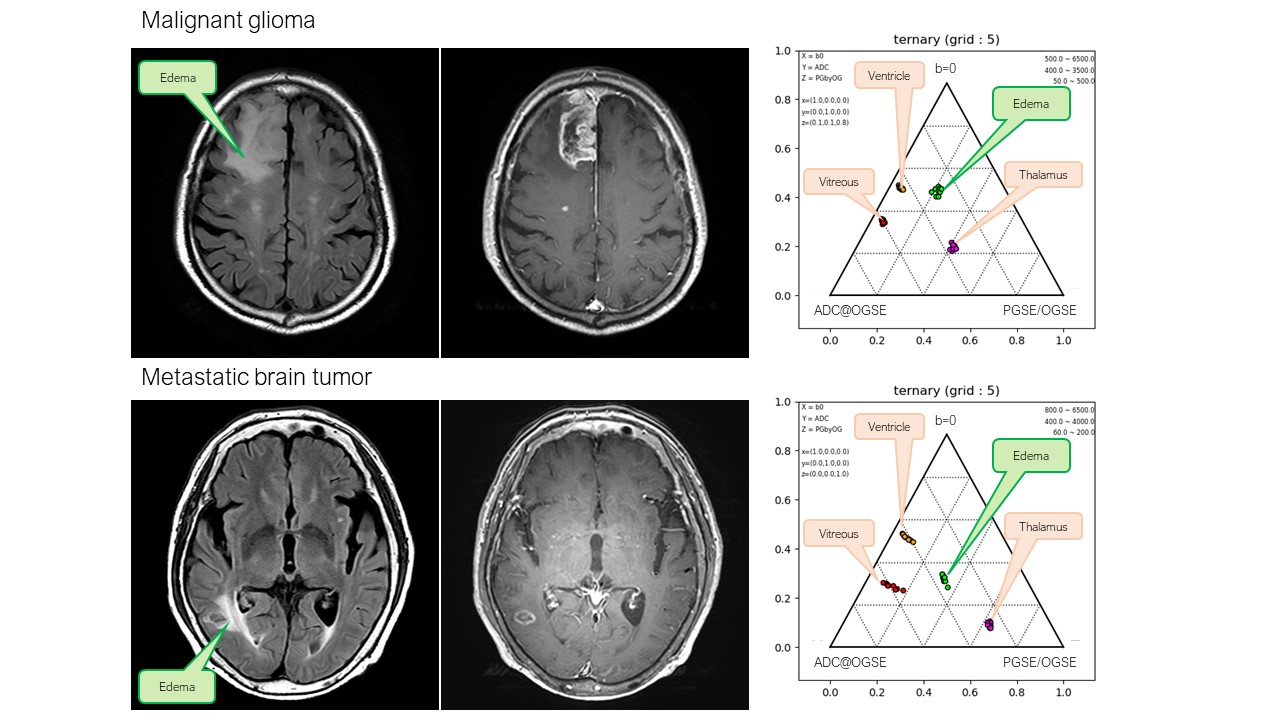
Representative cases
A case of malignant glioma in the right frontal lobe (Upper row) and a case of metastatic brain tumor (Lower row) are shown. In both cases, the edema around the enhancing tumor is depicted with high signal on FLAIR. However, the edema on the ternary plot is plotted in a different location.
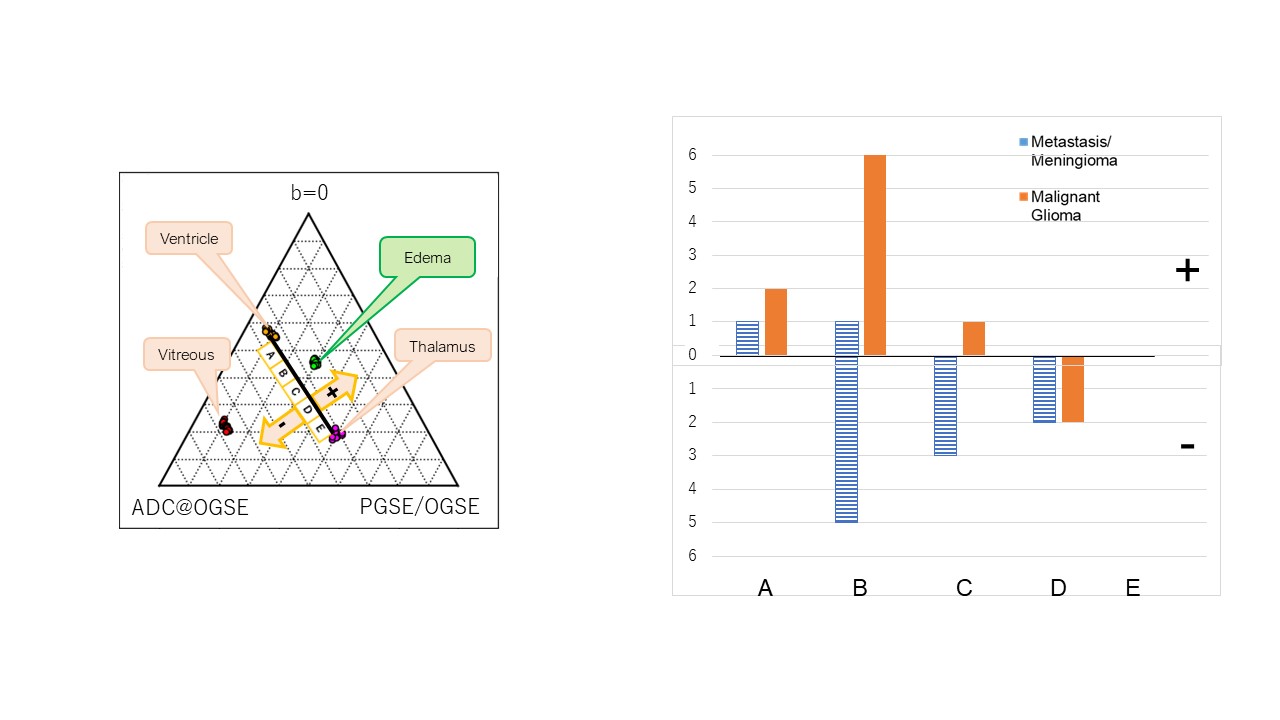
Evaluation by ternary plot of the OGSE-ADC, PGSE/OGSE, and b0 images.
In the ternary plot, the line connecting the thalamic and ventricular plots was divided into five sections: A, B, C, D, and E from the side closer to the ventricular plot; the side closer to the vitreous compartment than the line was designated (-) and the side farther away was designated (+). Edema around malignant glioma was significantly more common in the (+) region compared to edema of other tumors (p<0.01). On the other hand, no significant trend was shown for the distribution of A-E.