0022
CO2 and O2 reactivity in brain gliomas1Department of Radiology, Johns Hopkins University School of Medicine, Baltimore, MD, United States, 2Graduate School of Biomedical Sciences, UT Southwestern Medical Center, Dallas, TX, United States, 3Department of Neurosurgery, Johns Hopkins University School of Medicine, Baltimore, MD, United States
Synopsis
Keywords: Tumors (Pre-Treatment), Tumor, Cerebrovascular reactivity; venous cerebral blood volume; bolus arrival time; hypercapnia; hyperoxia
Motivation: Current clinical practice assesses baseline vascular features and cerebrovascular reactivity with multiple techniques that involve the use of injected contrast and radioactive tracers. Obtaining this information requires numerous tests and visits, which increases patient stress and healthcare costs.
Goal(s): Our goal was to determine whether a multiparametric scan could conveniently and economically assess glioma hemodynamics with no exogenous contrast.
Approach: The technique involves sequential manipulation of CO2 and O2 in inspired gas while collecting BOLD MRI images to obtain CVR, vCBV, and BAT maps.
Results: Multiparametric maps correctly differentiated tumor and normal tissue with characteristics that may inform tumor classification.
Impact: We showed that an efficient multiparametric scan can map different vascular properties. These maps allow for tumor and healthy tissue differentiation and show qualitative traits that potentially informs tumor characteristics which could aid in the diagnostic evaluation of glioma patients.
Introduction
Gas-inhalation MRI allows us to obtain physiological parameters such as O2-reactivity (thought to reflect venous cerebral blood volume, vCBV) and cerebrovascular reactivity (CVR) for brain tumors. CBV has already been established as a diagnostic marker for tumor grading and CVR potentially informing on tissue regions with neurovascular uncoupling1. Jointly, they provide important tools for the diagnosis and characterization of brain tumors. A limitation is that this information is normally collected during different scans. In this work, a novel MRI technique that allows for the collection of data to measure multiple hemodynamic parameters in a single 9-minute scan was applied. Analysis of the output multiparametric maps showed that one may use them to reliably differentiate between tumor and normal brain tissue.Methods
Patients: Sixteen de novo brain tumor patients (age 21-81y, 11M/5F) were scanned on 3T (Siemens and Philips), after IRB-approved informed consent was obtained. Fifteen patients have since undergone surgical intervention and histopathologic tumor grades were obtained using 2016 WHO standards.Imaging parameters: Concomitant CO2/O2 breathing paradigm was performed while BOLD images were continuously collected1. The CO2 and O2 breathing periods were optimized previously and is illustrated in Fig. 1 and allows for the independent alteration of CO2 and O2 levels. The BOLD sequence used the following parameters: TR/TE = 1550/21ms, 3.2×3.2×3.5mm, scan duration = 9.3min. Clinical MR scans were also performed, including contrast-enhanced T1W, T2W, and FLAIR.
Data processing: Following a previously established analysis method1, BOLD images and physiological recordings of end-tidal (Et) CO2 and O2 traces were used to obtain CVR (based on BOLD signal change to EtCO2 change), vCBV (based on BOLD signal change to EtO2 change), and bolus arrival time (BAT; based on the time lag between the voxel and whole brain BOLD signal) maps.
Statistical analysis: Regions-of-interest (ROI) were manually drawn on tumor regions and contralateral healthy tissue and were applied to the CVR, vCBV, and BAT maps to obtain regional values. Parametric values were compared between tumor and contralateral ROIs using paired t-tests.
Results
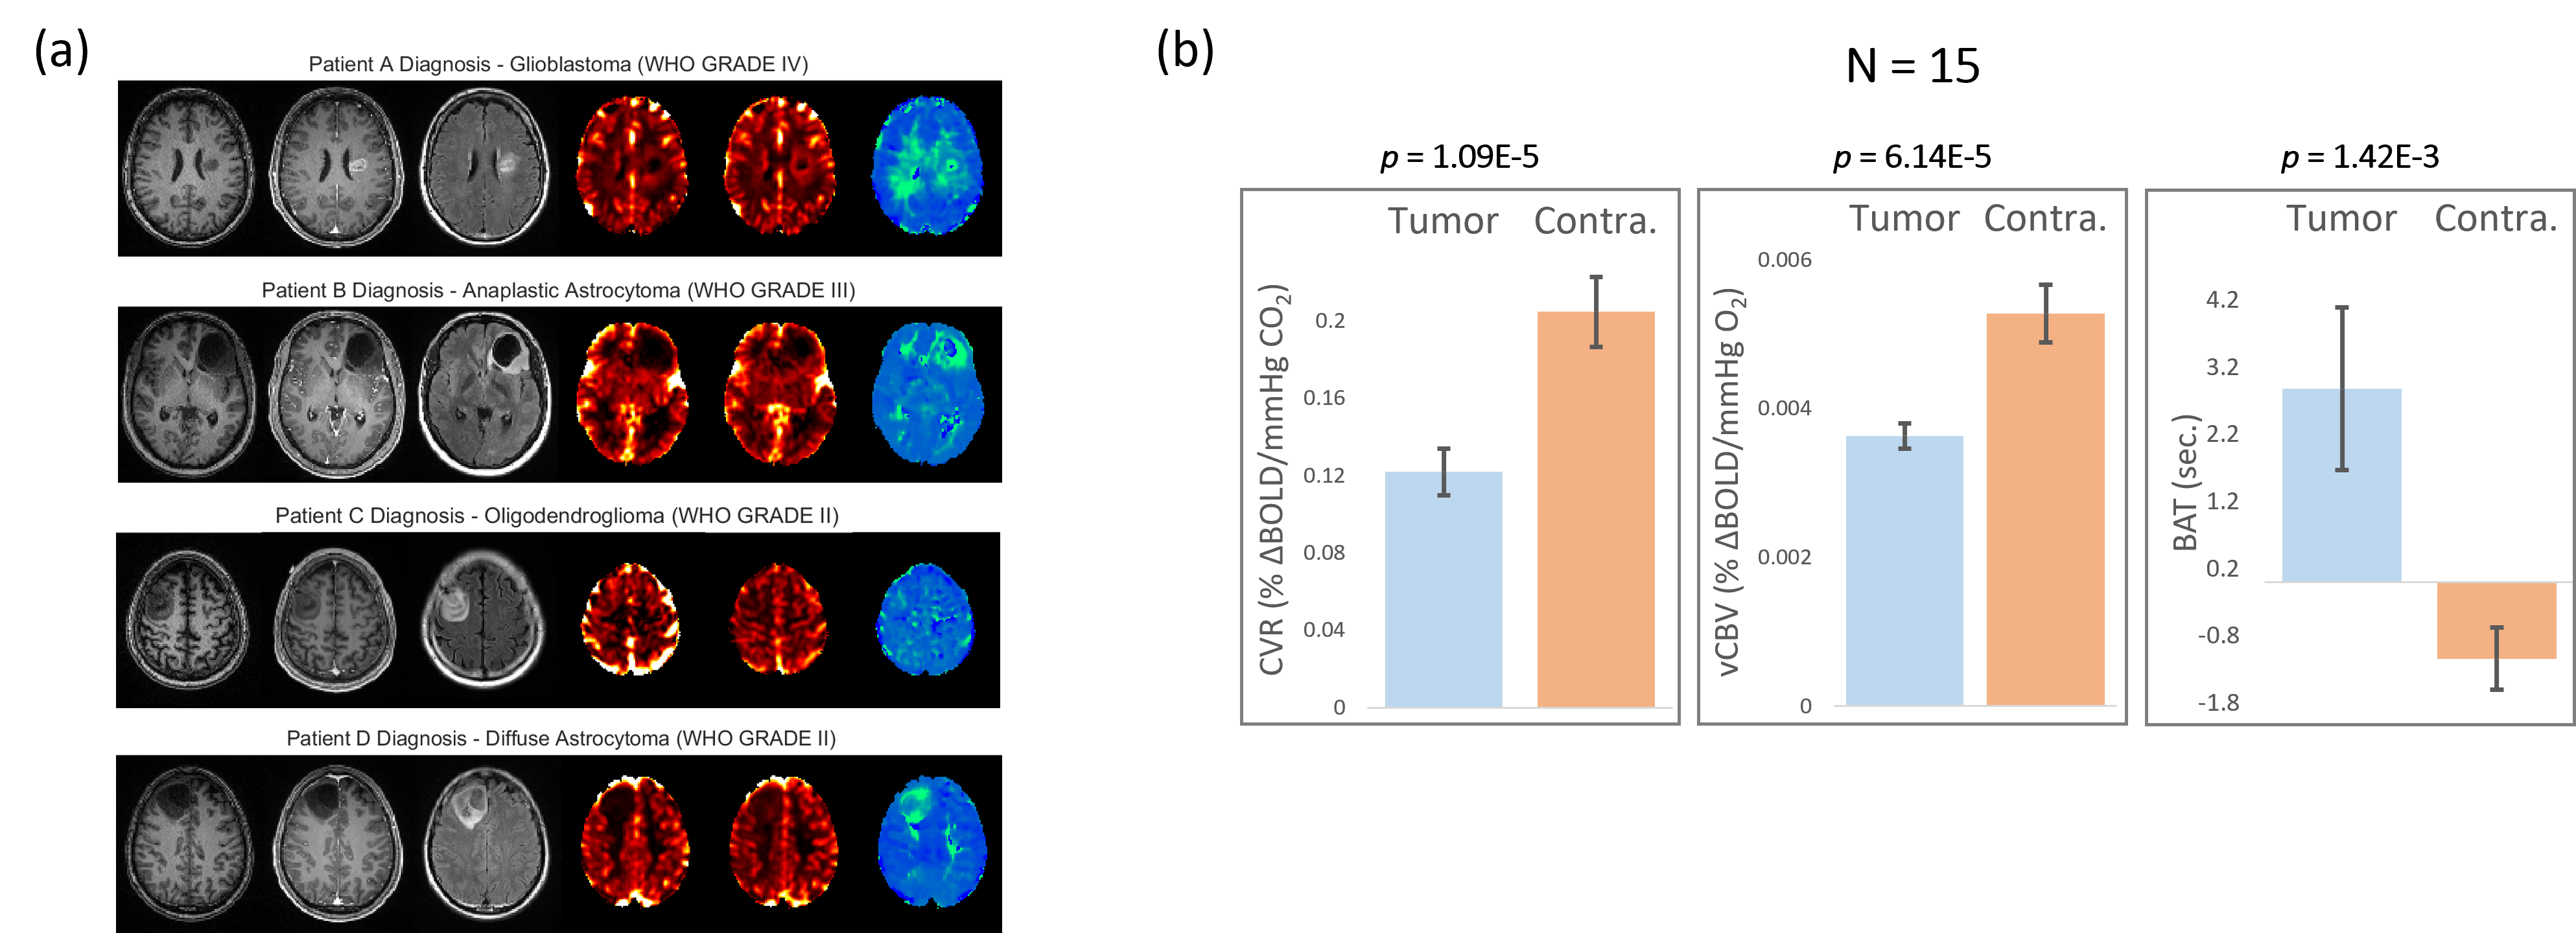
Fig. 2a shows the anatomical images (T1W, T1W gadolinium-enhanced, and FLAIR) and parametric maps (CVR in %∆BOLD/mmHg CO2, vCBV in %∆BOLD/mmHg O2, and BAT in seconds) for four patients: Patient A – WHO grade IV glioblastoma, Patient B – WHO grade III anaplastic astrocytoma, Patient C – WHO grade II oligodendroglioma, and Patient D – WHO grade II diffuse astrocytoma. CVR and vCBV is seen to be low (is darker) in tumor regions compared to contralateral and surrounding healthy tissue. This lower CVR region is seen to be the size of or larger than the tumor regions defined in the clinical images for astrocytomas but smaller for oligodendrogliomas. The low vCBV region is seen to be smaller compared to the CVR region for astrocytomas indicating that there may be angiogenesis in outer tumor regions, however, these vessels are not mature enough to respond to stimuli. The low vCBV region is seen to be around the same size as the tumor regions defined in the clinical images for oligodendrogliomas. Definitive statements are difficult to make due to the small sample size. Tumor regions are green in the BAT map indicating a longer response time to the CO2/O2 stimulus.Fig. 2b shows the CVR, vCBV, and BAT values for the tumor and contralateral side. Paired t-tests for the difference between ROIs were highly significant (p< 0.001) indicating that these maps enable differentiation between tumor and healthy tissue.
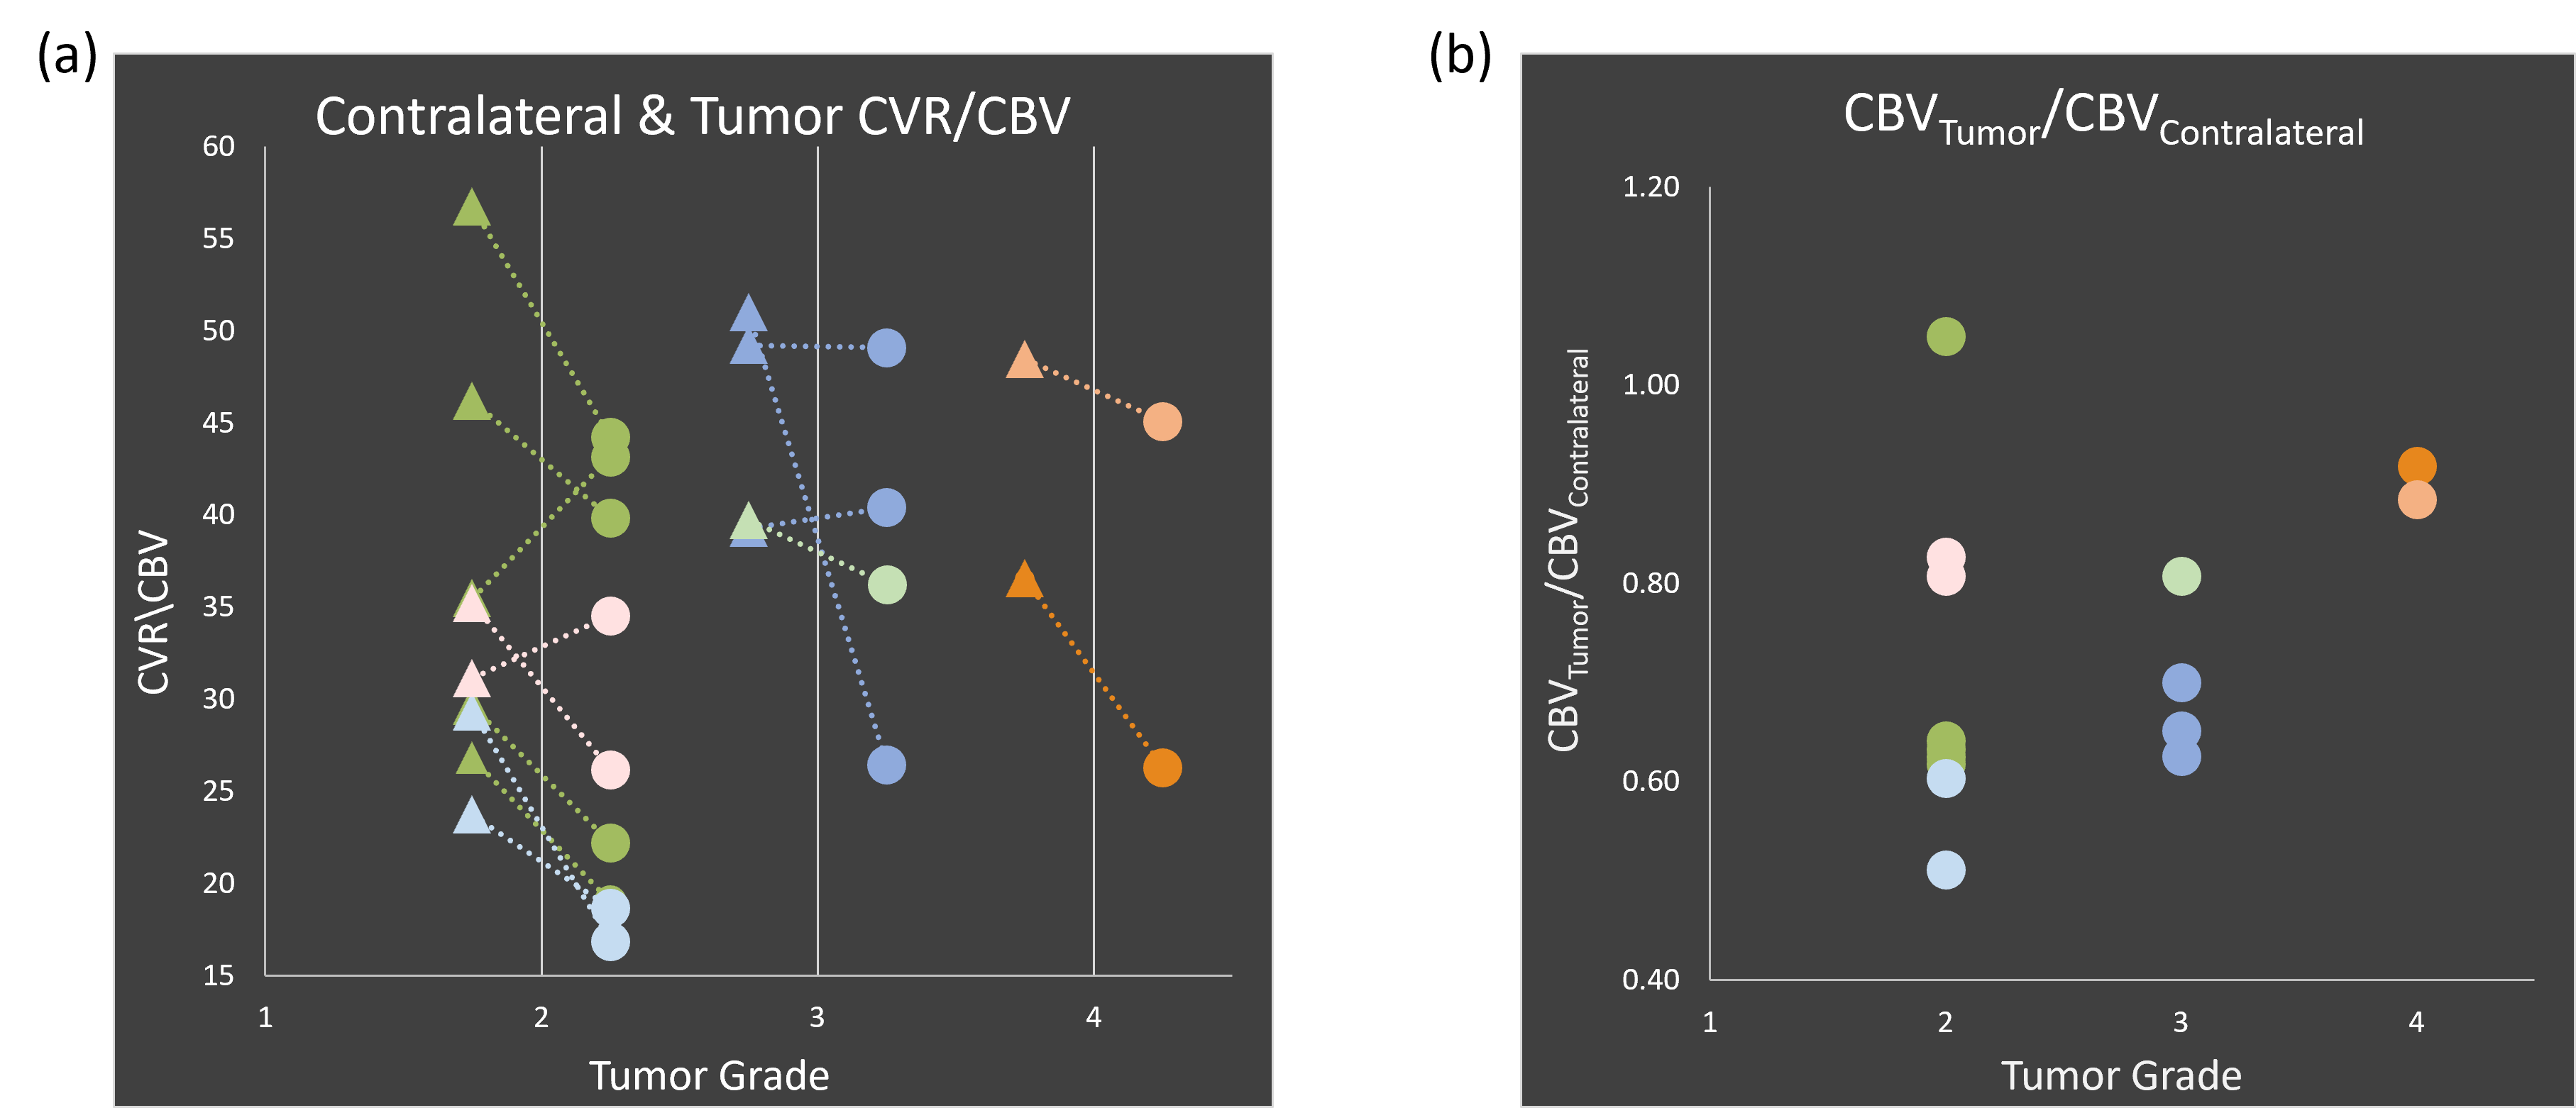
Fig. 3a shows the comparison of CVR/vCBV for contralateral and tumor ROIs. For most cases, there is a decrease seen for tumor CVR/vCBV (three subjects show increases).
Fig. 3b shows the relationship between tumor vCBV normalized by contralateral tissue vCBV, tumor grade, and glioma type. Higher vCBV is seen in higher grade gliomas (highest in glioblastomas followed by grade III). There is a wide variance of vCBV amongst the grade II gliomas, noting that oligodendrogliomas tend to have a higher vCBV and clustering by glioma type is observed.
Conclusion
We used an advanced technique to simultaneously evaluate CVR, vCBV, and BAT in glioma patients. The multiparametric maps were found to be able to accurately distinguish between tumor and normal tissue. Additionally, the maps showed features characteristic to different tumor classifications. This methodology could be a cost-effective way to help with tumor classification and presurgical planning in glioma patients.Acknowledgements
No acknowledgement found.References
- Liu P, Welch B.G., Li Y, Gu H, King D, Yang Y, Pinho M, Lu H. Multiparametric imaging of brain hemodynamics and function using gas-inhalation MRI. Neuroimage 2017; 146:715–723.
Figures