0003
Cross-Vendor Multiparametric Mapping of the Human Brain Using 3D-QALAS: A Multicenter & Multivendor Study1Department of Radiology, Juntendo University, Tokyo, Japan, 2Department of Radiology, The University of Tokyo, Tokyo, Japan, 3Athinoula A. Martinos Center for Biomedical Imaging, Charlestown, MA, United States, 4Department of Radiology, Harvard Medical School, Boston, MA, United States, 5Fetal Neonatal Neuroimaging and Developmental Science Center, Boston Children's Hospital, Boston, MA, United States, 6Department of Imaging Physics,, MD Anderson Cancer Center, Houston, TX, United States, 7SyntheticMR, Linköping, Sweden, 8Center for Medical Imaging Science and Visualization (CMIV), Linköping University, Linköping, Sweden, 9Faculty of Health Data Science, Juntendo University, Chiba, Japan, 10Department of Neurology, Juntendo University, Tokyo, Japan, 11Harvard/MIT Health Sciences and Technology, Cambridge, MA, United States
Synopsis
Keywords: YIA, Neuro
Motivation: To address the unmet need for a cross-vendor, multiparametric technique to facilitate data pooling across sites.
Goal(s): To evaluate a vendor-standardized multiparametric mapping scheme based on 3D-QALAS for whole-brain T1, T2, and proton density (PD) mapping.
Approach: Intra-scanner repeatability and inter-vendor reproducibility were evaluated in vivo on five different 3T systems from four vendors (GE, Philips, Siemens, and Canon). Patients with multiple sclerosis were scanned on systems from different vendors to assess the feasibility of the scheme in real-world clinical settings.
Results: 3D-QALAS provided T1, T2, and PD with coefficient of variations <4.0% using 3T scanners from different manufacturers.
Impact: The four major vendors used in this study constitute a considerable portion of the global installation base, demonstrating the value of cross-vendor quantitative technique 3D-QALAS for imaging in clinical sites with multiple vendors, as well as in multicenter research settings.
Introduction
A multiparametric technique1-5 that is compatible with multiple vendors is necessary to pool data among different sites and vendors. This can increase the size and diversity of the applicable patient population, thus enhancing the statistical power.6,7 However, few technologies have shown compatibility across vendors or provided reproducible values across MRI scanners from different vendors.One cross-vendor multiparametric technique is 3D-quantification using an interleaved Look–Locker acquisition sequence with a T2 preparation pulse (3D-QALAS).4,8 Here, we developed a vendor-standardized whole-brain multiparametric mapping scheme based on 3D-QALAS and assessed the intra-scanner repeatability and inter-vendor reproducibility of T1, T2, and proton density (PD) values in five different 3T systems from four major MRI vendors. Further, we performed an inter-vendor validation on patients with multiple sclerosis to assess the feasibility of 3D-QALAS in real-world clinical settings
Methods
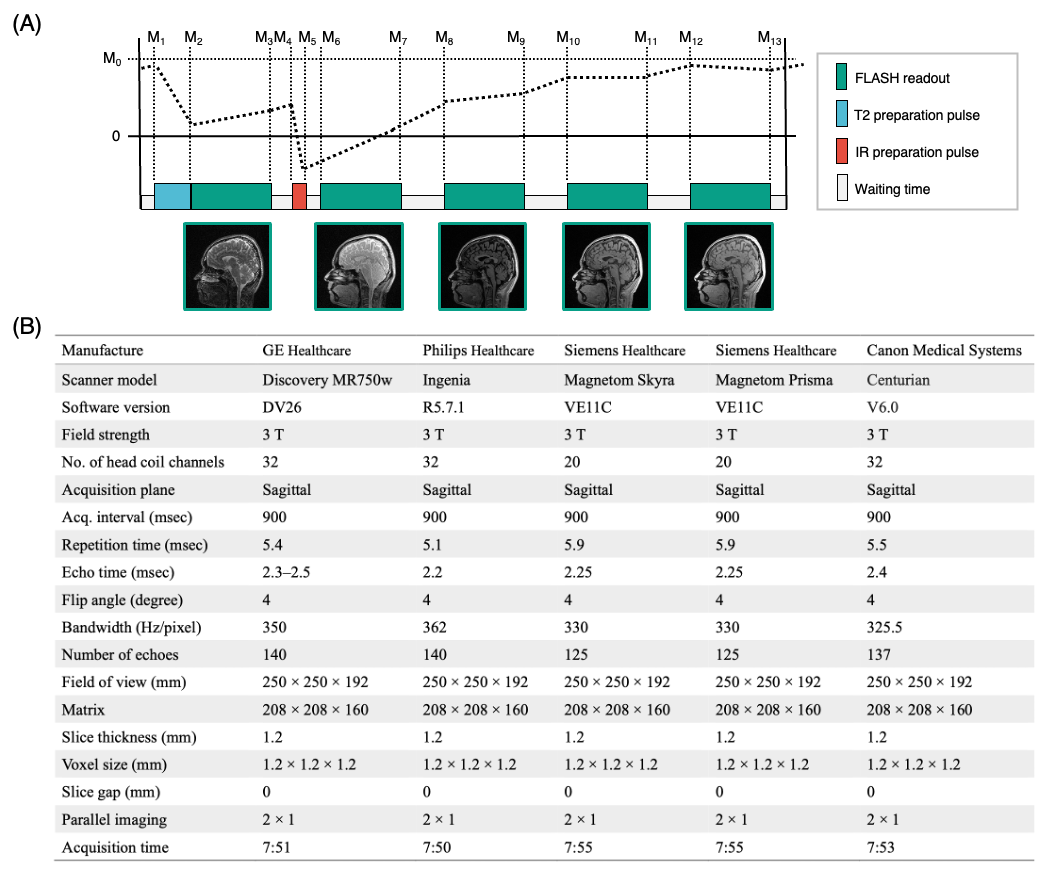
Sequence and acquisition protocolOur prospective multi-institutional study was approved by the local institutional review board of each institution. Participants provided written informed consent. Five 3T scanners manufactured by four vendors (GE Healthcare, Philips Healthcare, Siemens Healthcare, and Canon Medical Systems) were included from two academic institutions. The 3D-QALAS sequence was implemented in the MRI systems of all vendors; corresponding imaging parameters were kept as close as possible across all scanners (Figure 1).
Data Acquisition
Ten healthy volunteers underwent test-retest of vendor-standardized 3D-QALAS sequence with each scanner. Subjects were repositioned between the acquisitions to assess variability due to subject positioning. Each participant underwent imaging on all the scanners within two months. To further assess the feasibility of 3D-QALAS in real-world clinical settings, nine female patients with multiple sclerosis underwent imaging on two scanners from different vendors.
Postprocessing
Whole-brain T1, T2, and PD maps were derived via voxel-wise signal modeling-based parameter fitting on the 3D-QALAS source images using prototype SyMRI software. FreeSurfer9 was used to perform brain region-wise analysis with the Desikan-Killiany atlas.10 The mean T1, T2, and PD values were calculated for each brain structure in cortical gray matter (GM), subcortical GM, and white matter (WM) structures and WM lesions in patients.
Assessment
Intra-scanner repeatability for each scanner and structure was assessed using the within-subject coefficient of variation (CV), defined as the standard deviation [SD] of the three quantitative maps derived from test and retest over the mean of both time points.11 Inter-vendor reproducibility was also assessed using within-subject CV, defined as the SD divided by mean value calculated across all five scanners. Linearity, slope, intercept, and limits of agreement were used for comparisons among scanners. The intraclass correlation coefficient (ICC) using two-way random-effects model was also calculated to assess agreement between scanners.
Results
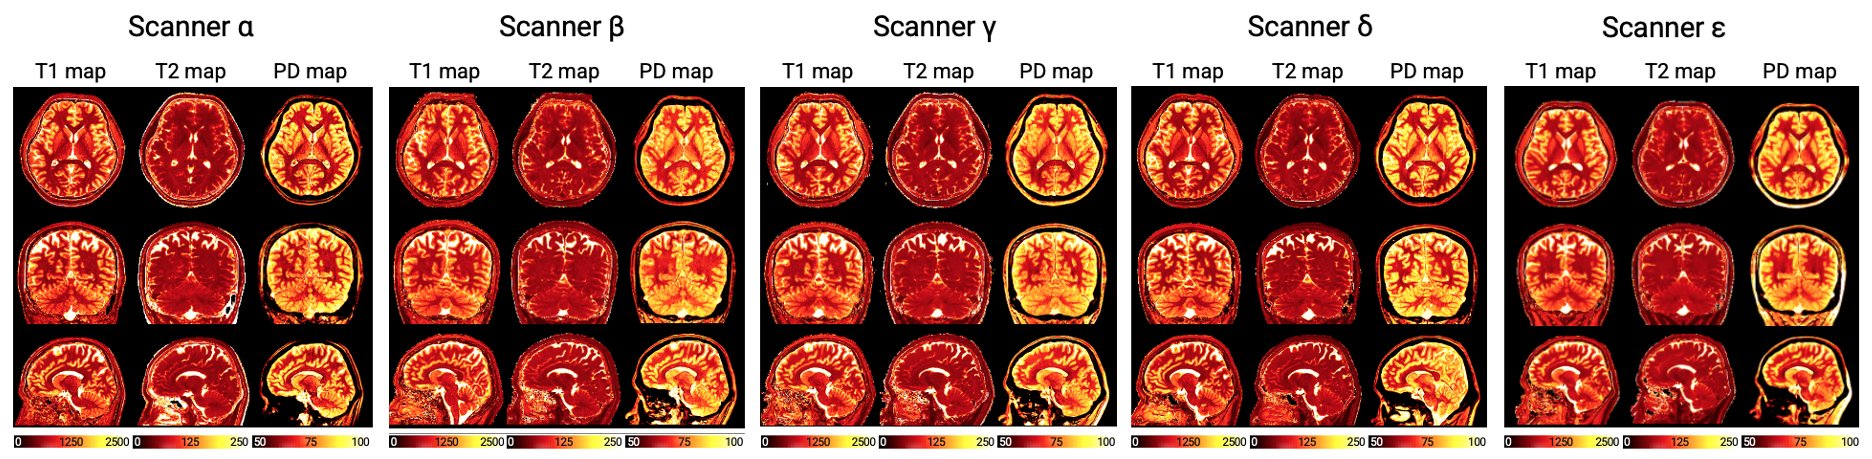
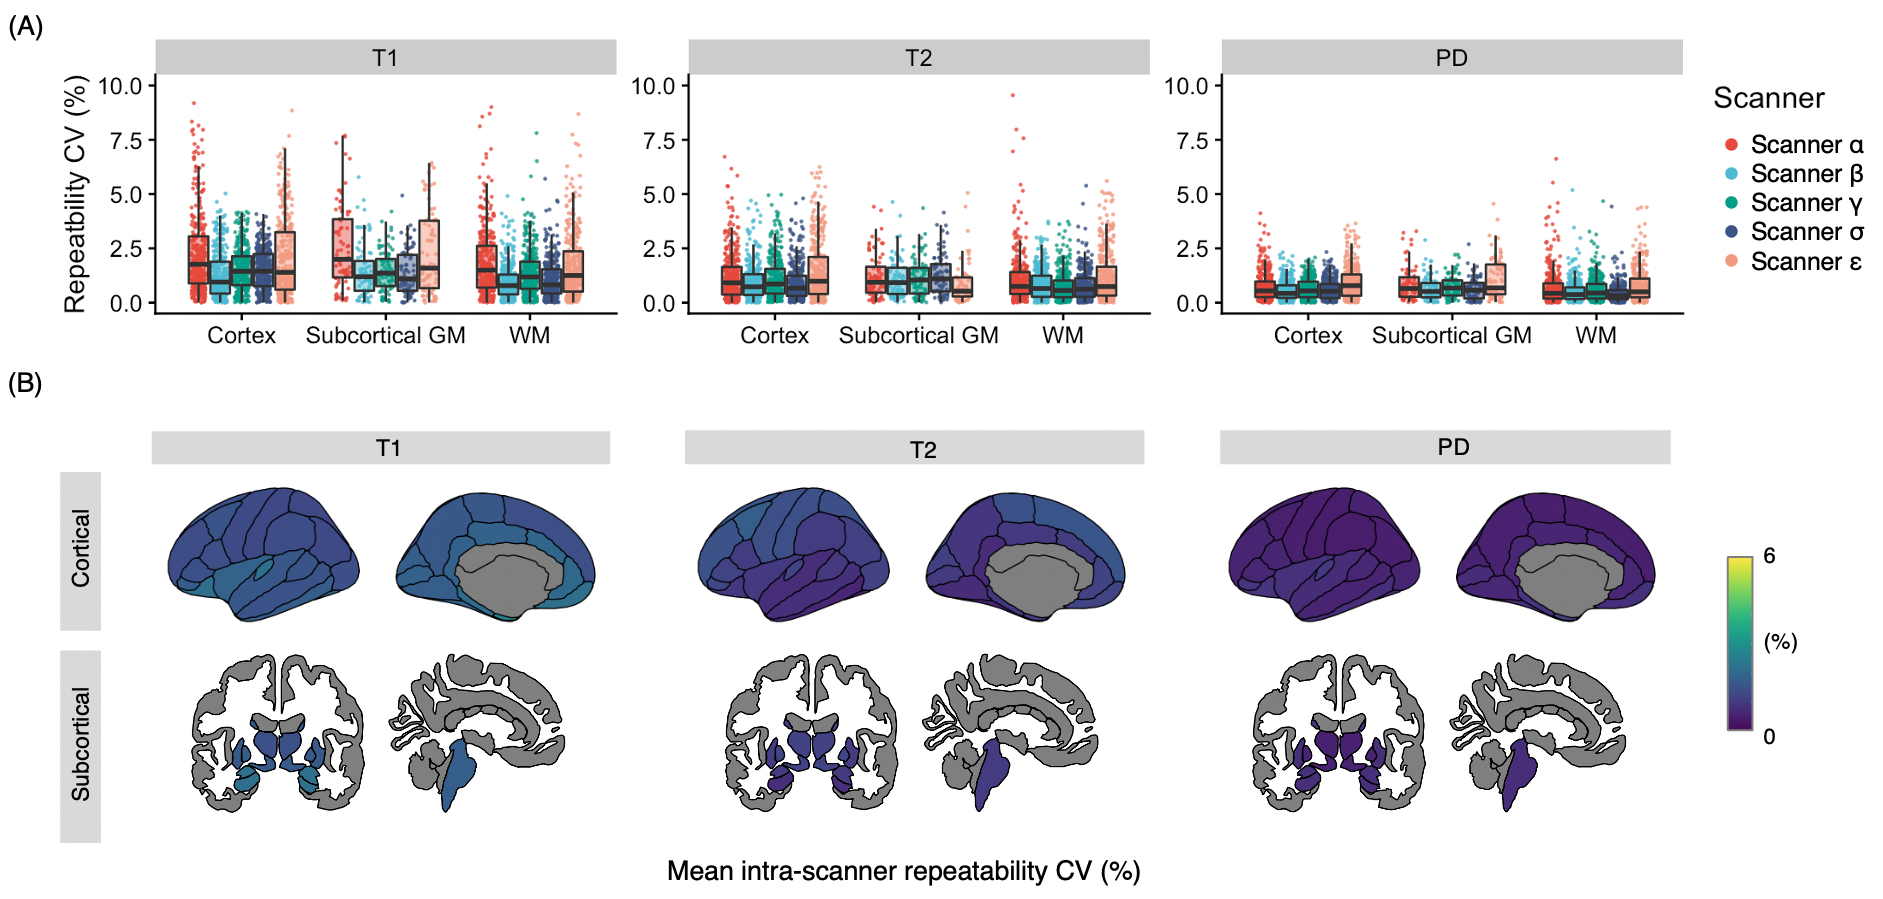
Quantitative values of five scanners from four vendorsRepresentative quantitative maps of a healthy subject are shown in Figure 2. The mean intra-scanner CVs for each scanner and structure ranged from 0.4 to 2.6% (Figure 3A). The overall structure-wise test-retest repeatability (mean intra-scanner CVs of the five scanners) were 1.6%, 1.1%, and 0.7% for T1, T2, and PD, respectively (Figure 3B).
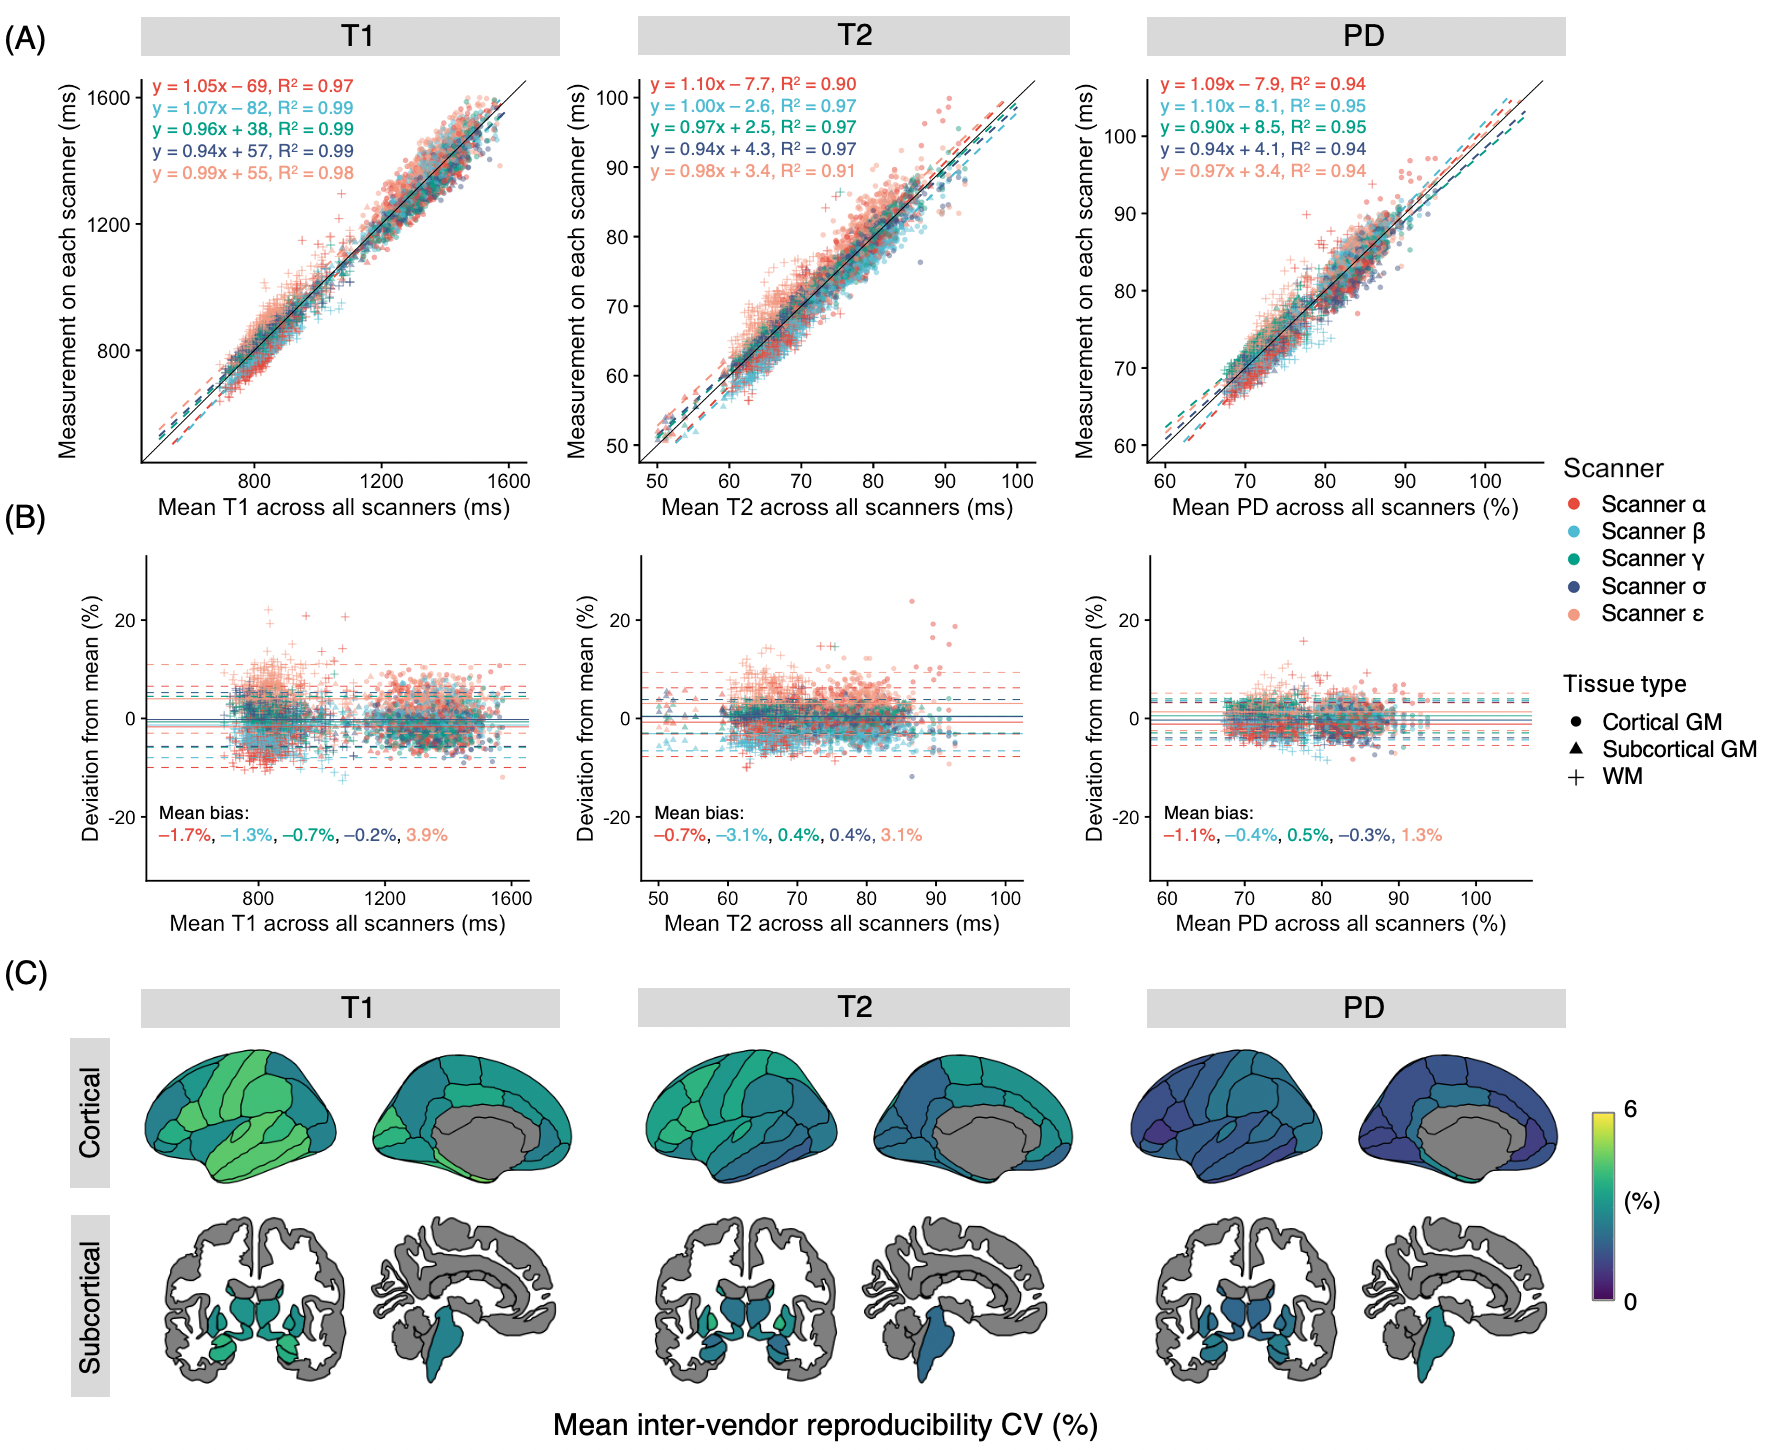
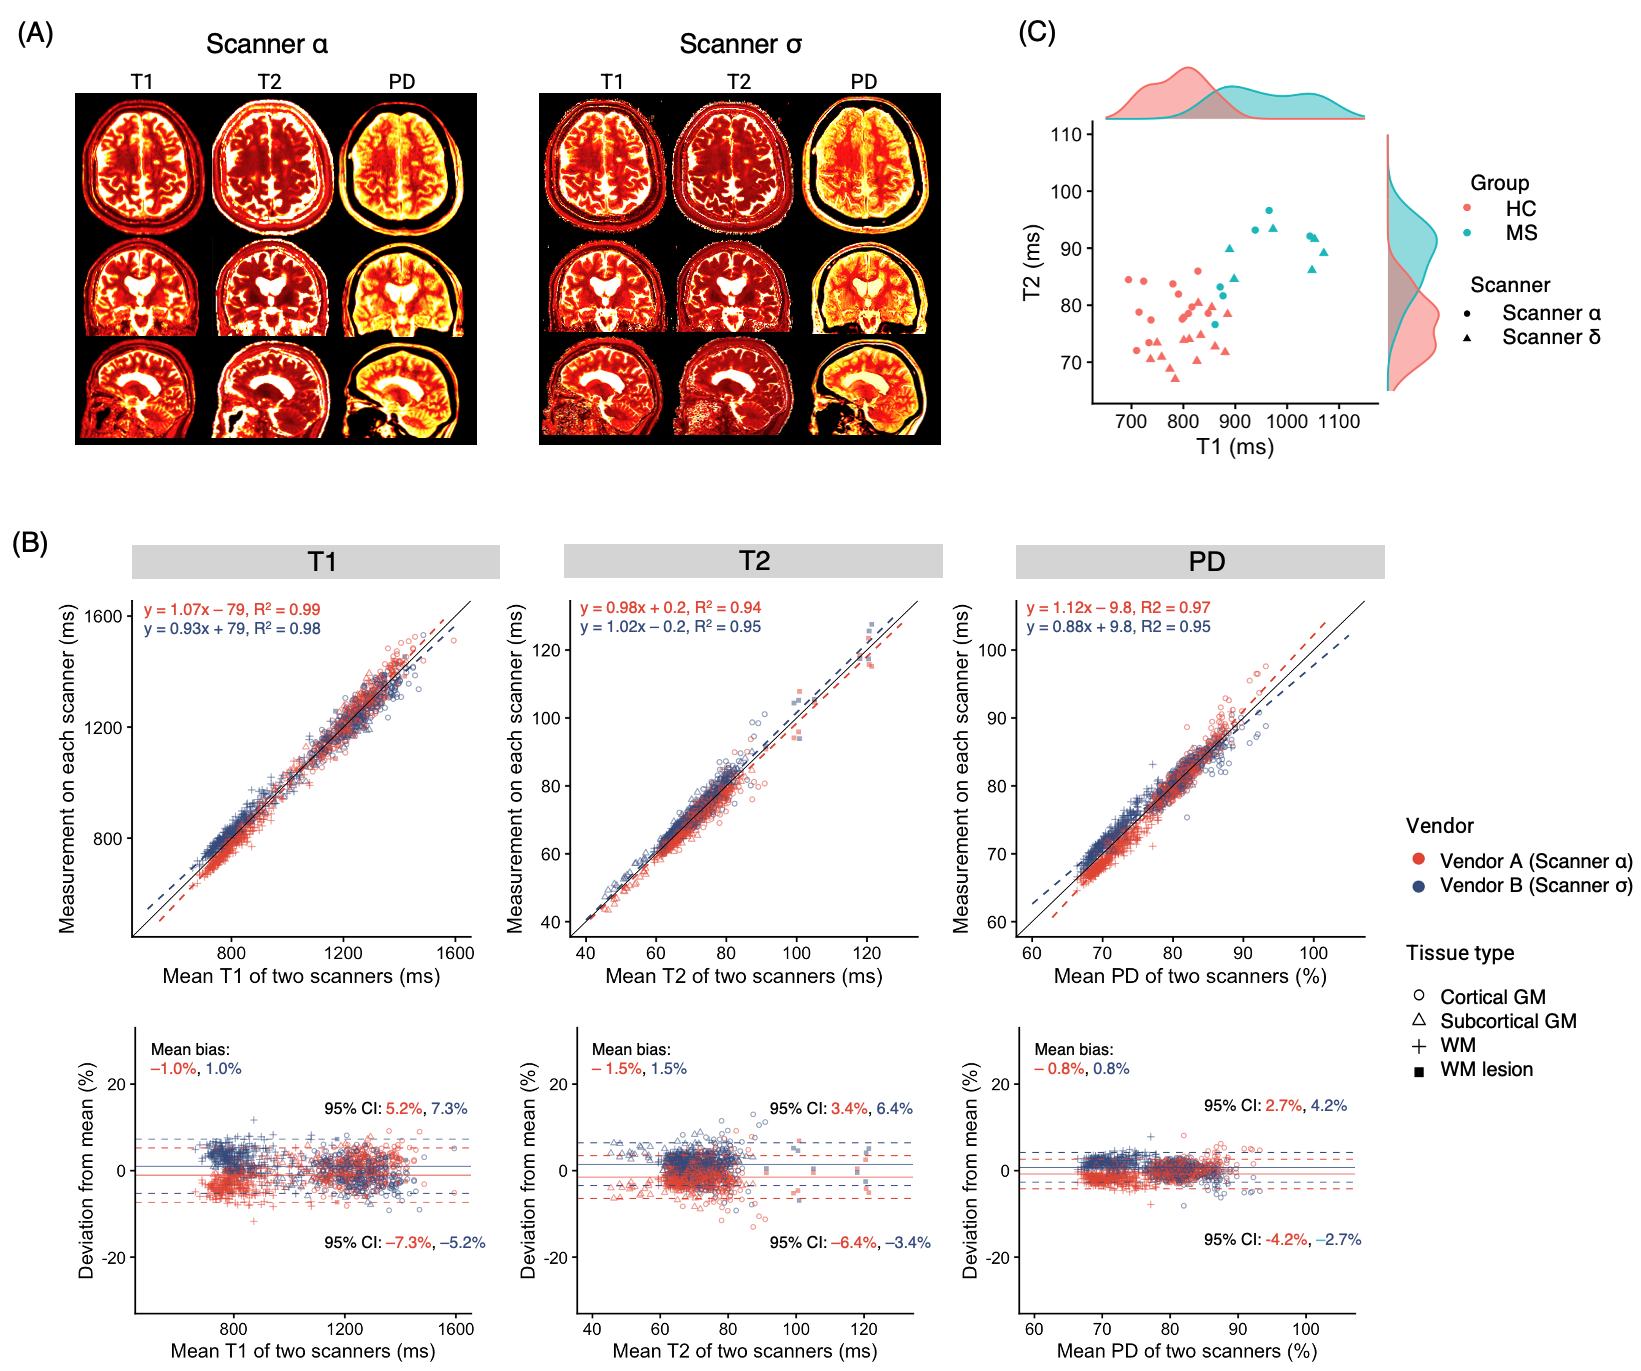
Overall, a high inter-vendor reproducibility was observed for all parameter maps (Figure 4A and 4B, ICC = 0.99, 0.97, and 0.98 for T1. T2, and PD, respectively). The structure-wise inter-scanner CV values are shown in Figure 4C.
Inter-vendor patient study
Representative quantitative maps of a patient with multiple sclerosis are shown in Figure 5A. High agreement was observed among the scanners for all structure measurements, including WM lesions (Figure 5B, ICC = 0.98, 0.92, and 0.94 for T1. T2, and PD, respectively). The white matter in healthy individuals and the normal-appearing white matter in those with multiple sclerosis were distinguishable, even when using scanners from different vendors (Figure 5C).
Discussion
In this study, we examined the intra-scanner and inter-vendor reproducibility of quantitative measurements obtained with 3D-QALAS, a cross-vendor whole-brain multiparametric mapping technique. Although the number of participants was small, this study included scanners from four major vendors, covering more than 90% of the global install base12. Our results show that the T1, T2, and PD values measured with 3D-QALAS were comparable across scanners and vendors.Importantly, the results demonstrate that the reproducibility coefficient (defined as 2.77 × within-subject CV) was smaller than the difference between the quantitative values of the lesion and the normal tissue: indicating that lesions can be distinguished from normal tissue even when data from scanners from multiple vendors are pooled.
Conclusion
In a cohort consisting of healthy volunteers and patients, T1, T2, and PD values measured with 3D-QALAS were in high agreement across 3T scanners from four major MRI vendors. This validation study may serve as a base for larger multi-institutional studies.Acknowledgements
No acknowledgement found.References
1. Jara H, Sakai O, Farrher E, et al. Primary Multiparametric Quantitative Brain MRI: State-of-the-Art Relaxometric and Proton Density Mapping Techniques. Radiology. 2022;305(1):5-18. doi:10.1148/radiol.211519
2. Ma D, Gulani V, Seiberlich N, et al. Magnetic resonance fingerprinting. Nature. 2013;495(7440):187-192. doi:10.1038/nature11971
3. Wang F, Dong Z, Reese TG, et al. Echo planar time-resolved imaging (EPTI). Magn Reson Med. 2019;81(6):3599-3615. doi:10.1002/mrm.27673
4. Fujita S, Hagiwara A, Hori M, et al. Three-dimensional high-resolution simultaneous quantitative mapping of the whole brain with 3D-QALAS: An accuracy and repeatability study. Magn Reson Imaging. 2019;63:235-243.
5. Ma S, Nguyen CT, Han F, et al. Three-dimensional simultaneous brain T1 , T2 , and ADC mapping with MR Multitasking. Magn Reson Med. 2020;84(1):72-88. doi:10.1002/mrm.28092
6. Seiberlich N, Gulani V, Campbell-Washburn A et al. Quantitative Magnetic Resonance Imaging, Volume 1 – 1st Edition. 2020.
7. QIBA Concepts. https://qibawiki.rsna.org/index.php/QIBA_Concepts
8. Kvernby S, Warntjes MJ, Haraldsson H, Carlhäll CJ, Engvall J, Ebbers T. J Cardiovasc Magn Reson. 2014 Dec 20;16:102. Simultaneous three-dimensional myocardial T1 and T2 mapping in one breath hold with 3D-QALAS.
9. Fischl B. FreeSurfer. Neuroimage 2012;62:774–781
10. Desikan RS, Segonne F, Fischl B, et al. An automated labeling system for subdividing the human cerebral cortex on MRI scans into gyral based regions of interest. Neuroimage 2006;31:968–980.
11. Weingärtner S, Desmond KL, Obuchowski NA, et al. Development, validation, qualification, and dissemination of quantitative MR methods: Overview and recommendations by the ISMRM quantitative MR study group. Magn Reson Med. 2022;87(3):1184-1206.
12. https://seekingalpha.com/article/3405705-fonar-corp-undervalued-niche-player-in-the-world-of-mri-scanners
Figures