MRI of Renal Oxygen Availability
1NorthShore University HealthSystem, Evanston, IL, United States
Synopsis
Keywords: Body: Kidney, Contrast mechanisms: fMRI, Cross-organ: Oxygenation
Unlike most organs, in the kidneys, oxygen consumption changes with blood flow and increase in blood flow doesn't necessary lead to increased oxygen delivery. Further, there is a regional variation in blood and oxygen supply within the kidneys necessitating imaging based approach. BOLD MRI is the only non-invasive method to-date to evaluate renal oxygen availability. It is most useful for detecting acute changes following pharmacologic maneuvers. Limitations in conventional ROI analysis have been identified, creating an interest in alternative methods, including whole kidney analysis such as twelve layer concentric objects (TLCO).Highlights
- Unlike most organs, kidneys are unique in that the regional tissue oxygenation is not flow limited and hence there is an inherent need to evaluate renal oxygenation independent of blood flow.
- BOLD MRI allows for evaluation of intra-renal oxygen availability in humans, but it’s specificity to oxygenation is limited especially when comparing cohorts. T2* or R2* can be used as a quantitative parameter but their direct relationship to oxygen availability is not simple. Quantitative BOLD MRI may allow for direct oxygen availability measurement, but logistically more complex
- Clinical research to date include applications of BOLD MRI to reno-vascular hypertension, renal transplants, ureteral obstruction, and diabetic nephropathy/chronic kidney disease. o Position papers and technical recommendations were published recently by an international consortium, PARENCHIMA (renalMRI.org)
- Alternate methods to measure oxygenation include electron paramagnetic resonance and fluorine-19 MRI, both involving exogenous materials and hence limited to pre-clinical settings.
Target Audience
Radiologists, nephrologists, physicists, MR scientists, and MR technologists who are interested in clinical and/or research studies of the kidney.Outcomes/Objectives
Attendees will gain an appreciation for the significance of renal oxygen status independent of renal blood flow. They will learn how to evaluate relative oxygen status of the kidney using MRI and see examples of both pre-clinical and clinical applications being pursued. Advantages, perspectives and limitations of MRI methods in the evaluation of intra-renal oxygen availability will also be discussed. BOLD MRI is increasingly used in clinical research as part of a multi-parametric MRI protocol [1].Purpose
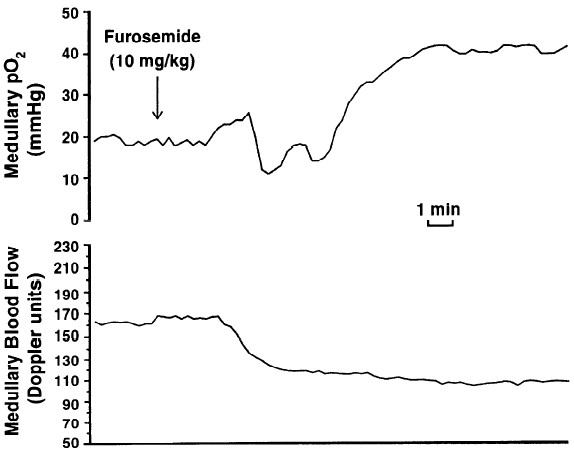
In most organs oxygenation is tightly linked to blood flow, in which case perfusion imaging may be sufficient to understanding regional oxygen status. In the kidneys, especially in the medulla, oxygen consumption could change along with or independent of flow (Figure 1). So there is a need to evaluate renal oxygenation apart from perfusion. Kidneys as a whole have the lowest difference in pO2 difference between the renal artery and vein [2], suggesting that they may be well oxygenated. However, kidneys actually have regions that can be characterized to be hypoxic [3]. In order to appreciate the spatial gradients in oxygen availability, spatially resolved measurement such as imaging is necessary. Early measurements were made using microelectrodes inserted into rat kidneys [4]. With the availability of non-invasive imaging, translation of these invasive studies to humans became possible [5]. Blood oxygenation level dependent (BOLD) MRI has been the most widely used technique to evaluate renal oxygen availability to-date.Methods
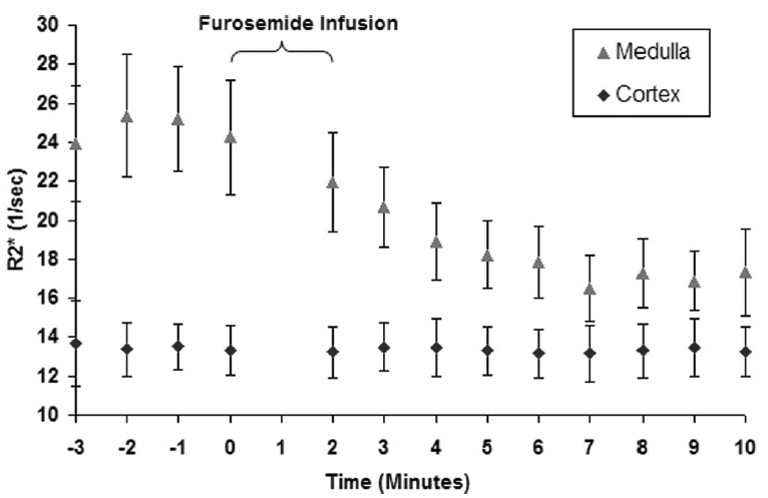
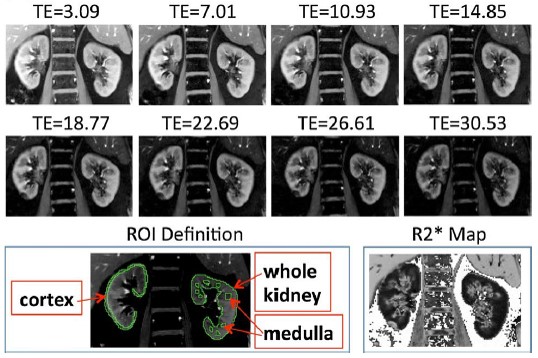
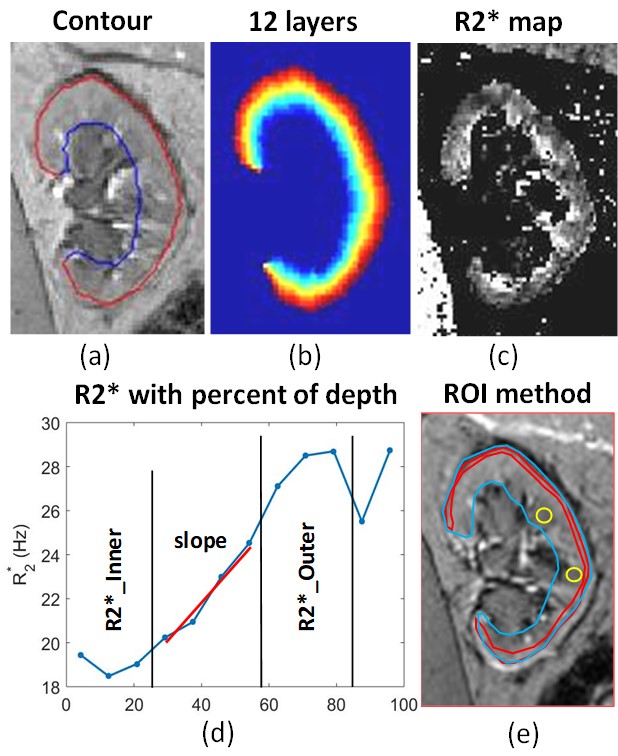
BOLD MRI is inherently sensitive to the presence of deoxygenated hemoglobin (Hb) in the blood. If one assumes that blood oxygenation is in a dynamic equilibrium with the surrounding tissue oxygenation, BOLD MRI can be used to evaluate changes in tissue oxygen availability. Early studies with BOLD MRI in humans [5] duplicated results using microelectrodes in rat kidneys (Figure 2).While the early studies used EPI based acquisitions, R2* mapping through mGRE is now common, resulting in higher quality images and a quantitative analysis [6]. Combined with breath-holding, a single slice acquisition can be performed in about 10 to 15 s (Figure 3). Early studies primarily used small ROIs to sample cortex and outer medulla. For objectivity large cortical and whole kidney ROIs are preferred. Whole kidney ROIs can also be automatically subdivided in to multiple layers allowing for appreciating depth variation (Figure 4) [7].
Applications
mGRE sequence is now a standard on all major vendor platforms and all of them offer in-line mapping options, making BOLD MRI readily available for renal oxygenation studies. This in turn has afforded an opportunity to duplicate the initial findings independently by several investigators throughout the world. However, most vendors implement log-linear fits and it may be preferable to use exponential fits using offline analysis such as FireVoxel [firevoxel.org].To-date, BOLD MRI has been applied in the clinic to evaluate renal vascular hypertension [8], renal transplants [9, 10], ureteral obstruction [11] and diabetic nephropathy/chronic kidney disease [12, 13]. Renal medullary hypoxia has an inherent relevance to acute kidney injury and pre-clinical data lend strong support [14, 15]. However, clinical translation is lacking primarily due to logistical issues rather than technical feasibility. Unlike structural MRI, functional MRI methods require a level of normalization in terms of dietary intake and use of other pharmacological agents. For a comprehensive review please refer to a recent position paper [16].
Discussion & Conclusion
Renal BOLD MRI is feasible and independently verified in in pre-clinical models against invasive microprobes. However, applications to the clinic are not without certain practical limitations. We may need consensus on the preparation of subjects prior to the study and in analytical methods. A four hour fast prior to the scan is a viable solution. Objective analysis of R2* maps require whole kidney segmentation and use of automated process to obtain depth variation such as with TLCO [7]. While R2*/T2* can be used as a quantitative marker, translation to absolute pO2 has remained elusive. Quantitative BOLD MRI with the inclusion of independent estimates of fractional blood volume and hematocrit may allow for estimation of regional blood PO2 [17].Feasibility has been demonstrated with electron paramagnetic resonance (EPR) [18] and Fluorine-19 MRI [19] to measure renal pO2. However, EPR requires implantation of Lithium phthalocyanine (LiPc) crystals and F-19 MRI requires exogenous substance to be injected in to the blood.
Acknowledgements
PVP is supported in part by NIDDK, R21-DK079080 and U2CDK114886.References
1. Selby, N.M., et al., Magnetic resonance imaging biomarkers for chronic kidney disease: a position paper from the European Cooperation in Science and Technology Action PARENCHIMA. Nephrol Dial Transplant, 2018. 33(suppl_2): p. ii4-ii14.
2. Leonhardt, K.O. and R.R. Landes, Oxygen tension of the urine and renal structures. Preliminary report of clinical findings. N Engl J Med, 1963. 269: p. 115-21.
3. Brezis, M. and S. Rosen, Hypoxia of the renal medulla--its implications for disease. N Engl J Med, 1995. 332(10): p. 647-55.
4. Aukland, K. and J. Krog, Renal oxygen tension. Nature, 1960. 188: p. 671.
5. Prasad, P.V., R.R. Edelman, and F.H. Epstein, Noninvasive evaluation of intrarenal oxygenation with BOLD MRI. Circulation, 1996. 94(12): p. 3271-3275.
6. Prasad, P.V., et al., Breath-hold R2* mapping with a multiple gradient-recalled echo sequence: Application to the evaluation of intrarenal oxygenation. Jmri-Journal of Magnetic Resonance Imaging, 1997. 7(6): p. 1163-1165.
7. Milani, B., et al., Reduction of cortical oxygenation in chronic kidney disease: evidence obtained with a new analysis method of blood oxygenation level-dependent magnetic resonance imaging. Nephrol Dial Transplant, 2017. 32(12): p. 2097-2105.
8. Gloviczki, M.L., L.O. Lerman, and S.C. Textor, Blood oxygen level-dependent (BOLD) MRI in renovascular hypertension. Curr Hypertens Rep, 2011. 13(5): p. 370-7.
9. Han, F., et al., The significance of BOLD MRI in differentiation between renal transplant rejection and acute tubular necrosis. Nephrol Dial Transplant, 2008. 23(8): p. 2666-72.
10. Djamali, A., et al., BOLD-MRI assessment of intrarenal oxygenation and oxidative stress in patients with chronic kidney allograft dysfunction. Am J Physiol Renal Physiol, 2007. 292(2): p. F513-22.
11. Thoeny, H.C., et al., Renal oxygenation changes during acute unilateral ureteral obstruction: assessment with blood oxygen level-dependent mr imaging--initial experience. Radiology, 2008. 247(3): p. 754-61.
12. Inoue, T., et al., Noninvasive evaluation of kidney hypoxia and fibrosis using magnetic resonance imaging. J Am Soc Nephrol, 2011. 22(8): p. 1429-34.
13. Prasad, P.V., et al., Multi-Parametric Evaluation of Chronic Kidney Disease by MRI: A Preliminary Cross-Sectional Study. PLoS One, 2015. 10(10): p. e0139661.
14. Li, L.P., et al., Evaluation of intrarenal oxygenation in iodinated contrast-induced acute kidney injury-susceptible rats by blood oxygen level-dependent magnetic resonance imaging. Invest Radiol, 2014. 49(6): p. 403-10.
15. Li, L.P., et al., Efficacy of preventive interventions for iodinated contrast-induced acute kidney injury evaluated by intrarenal oxygenation as an early marker. Invest Radiol, 2014. 49(10): p. 647-52.
16. Pruijm, M., et al., Renal blood oxygenation level-dependent magnetic resonance imaging to measure renal tissue oxygenation: a statement paper and systematic review. Nephrol Dial Transplant, 2018. 33(suppl_2): p. ii22-ii28.
17. Prasad, P.V., et al. Quantitative BOLD MRI for Estimating Intra-renal Oxygen Availability: Are Kidneys Hypoxemic in CKD? in Annual Meeting of the International Society of Magnetic Resonance in Medicine. 2023. Toronto, Canada.
18. James, P.E., et al., Endotoxin-induced changes in intrarenal pO2, measured by in vivo electron paramagnetic resonance oximetry and magnetic resonance imaging. Free Radic Biol Med, 1996. 21(1): p. 25-34.
19. Hu, L., et al., Assessing intrarenal nonperfusion and vascular leakage in acute kidney injury with multinuclear (1) H/(19) F MRI and perfluorocarbon nanoparticles. Magn Reson Med, 2014. 71(6): p. 2186-96.
20. Brezis, M., Y. Agmon, and F.H. Epstein, Determinants of intrarenal oxygenation. I. Effects of diuretics. Am J Physiol, 1994. 267(6 Pt 2): p. F1059-62.
21. Li, L.P., et al., Renal BOLD MRI in patients with chronic kidney disease: comparison of the semi-automated twelve layer concentric objects (TLCO) and manual ROI methods. MAGMA, 2020. 33(1): p. 113-120.
Figures