5430
Comparison of compressed sensing accelerated MR elastography to standard breath-hold gradient recalled echo MRE for estimating liver stiffness1University of Vermont, Burlington, VT, United States, 2Radiology, University of Vermont Medical Center, Burlington, VT, United States, 3Radiology Oncology & Medical Physics, University of Vermont Medical Center, Burlington, VT, United States
Synopsis
The standard MRE(sMRE) uses four breath-hold, each of 14–22 s, to stage liver fibrosis. The long breath-hold time challenges most children and adult patients with limited breath-hold capability. The compressed sensing (CS) technique was used to accelerate the MRE (csMRE) acquisition to shorten the breath-hold duration (~10s). The preliminary results showed that the LS estimated from csMRE strongly correlated to sMRE and showed strong agreement in the normal to mild liver fibrosis stage. However, it underestimates the liver stiffness in the elevated liver stiffness. The confident available area for LS estimation in csMRE increased 38% compared to sMRE.
Purpose
Magnetic resonance elastography (MRE) is an effective approach to noninvasively assess liver stiffness (LS) and has been widely clinically used for chronic liver disease and staging liver fibrosis. The standard clinical MRE protocol uses four breath-hold, each of 14-22 seconds, 2D gradient recalled echo (GRE) based technique to obtain four slices in the liver. The long breath-hold time often challenges both children and adult patients with limited breath-hold capability. We investigated the utility of compressed sensing (CS) for MRE (csMRE) to accelerate the MRE acquisition and evaluated the accuracy of liver fibrosis staging in the cohort of clinical patients.Methods
Patient population: 34 patients (age 54.9±14.6years; 13 males, BMI 34.2±11.2kg/m2) were referred for LS quantification and scanned on a 1.5T scanner (Philips, Ingenia Ambition). The data were retrospectively analyzed. The institutional review board approved the waiver of individual consent.MRE acquisition parameters:
Standard MRE (sMRE): FOV = 450 x (~360) x 55mm3, four 2D axial slices with a gap of 5mm at the level of the largest liver area, Acquired voxel size = 1.5 x 4.7 x 10mm3, reconstructed matrix size: 384 x 384, TR/TE/Flip angle = 50ms/20ms/20o, sense factor = 2.0; bandwidth = 287.4Hz/pixel, breath-hold time = 16 - 22s. Four breath-holds were used to acquire all four slices. The motion encoding gradient was applied at the Feet-Head direction to encode the four-wave images per slice. The amplitude of the acoustic driver varied between 40-90% depending on the patient’s BMI. The MRE frequency was 60Hz.
Compressed sensing MRE (csMRE): The CS factor of 2.8 was used with the system default denoising level, which resulted in a breath-hold of ~10s. All the other MR acquisition parameters were kept the same as sMRE in the same patient.
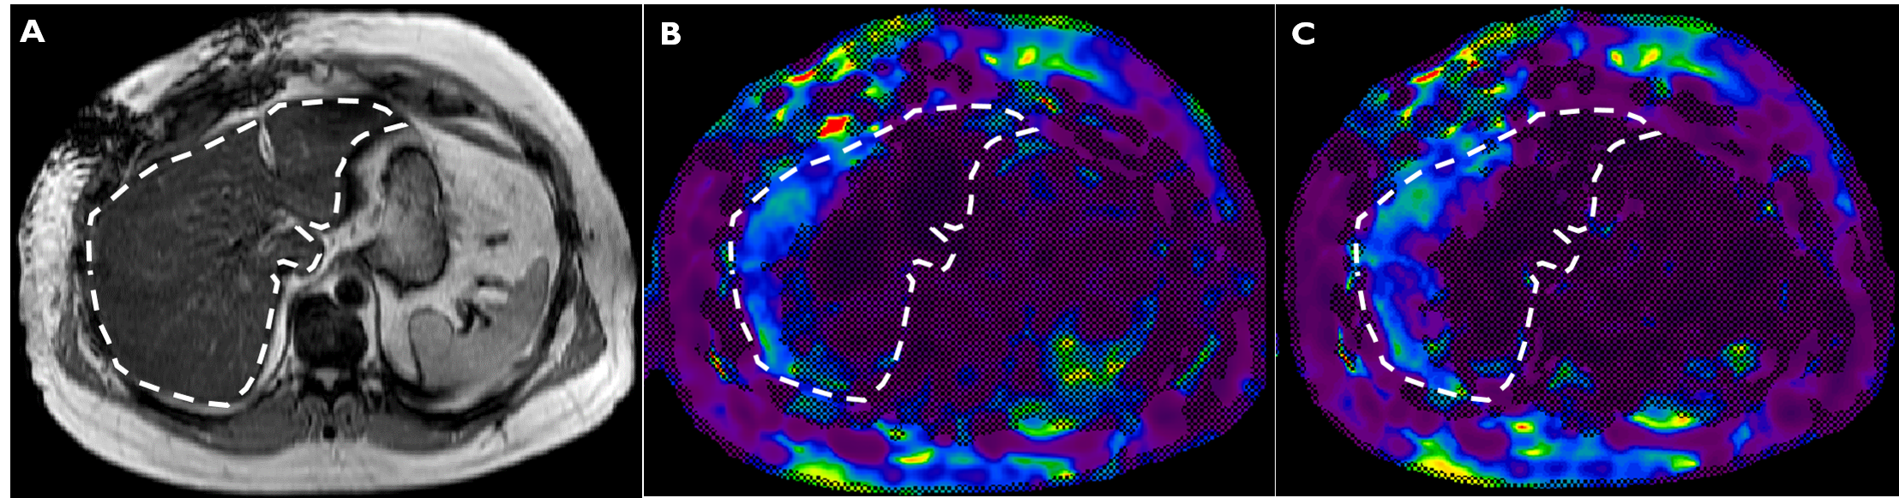
MRE Data analysis: The MRE wave, stiffness, and confidence (95%) maps were reconstructed on the canner using the MRE package. The ROIs were drawn on the four slices to calculate LS and available confident area on each slice for both sMRE and csMRE data sets (Fig. 1). The Bland-Altman analysis, linear regression, and boxplots were used to evaluate the LS agreement and area of confident coverage between sMRE and csMRE.
Results
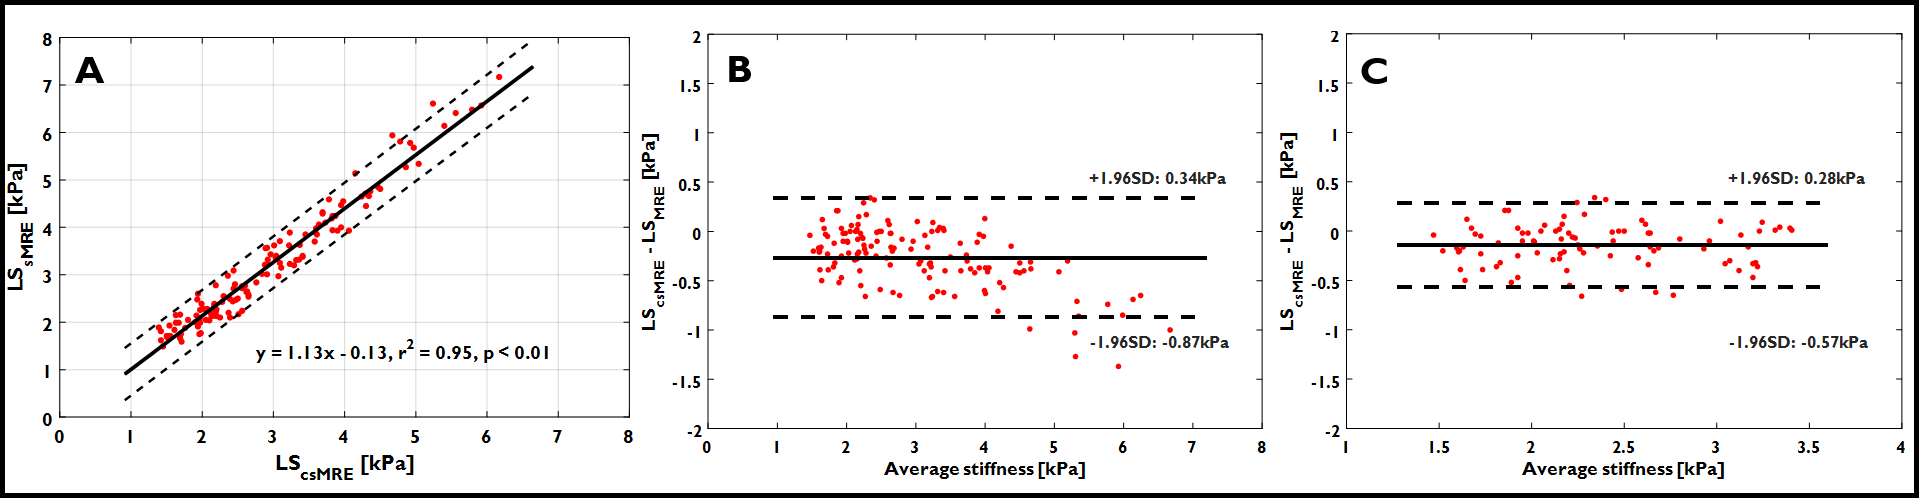
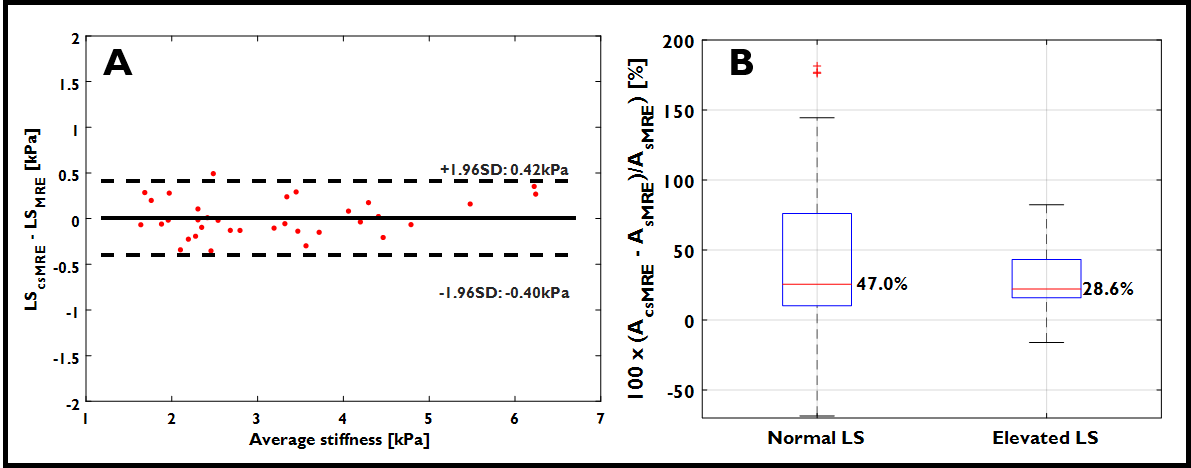
A total of 136 (4 slices x 34 patients) LS measurements were analyzed. The linear regression of the LS demonstrated that the LScsMRE strongly correlates with LSsMRE (r2 = 0.95, p< 0.01) (Fig. 2A). The Bland-Altman analysis demonstrated agreement between LScsMRE and LSsMRE (-0.27±0.31kPa) and showed the systematic underestimate of LS (Fig. 2B). This negative bias showed much higher as the liver fibrosis stage increase and lead to a higher chance of misclassified the advanced fibrosis stages(6 out of 9 advanced fibrosis case (>3.5kPa) decreased to a lower fibrosis stage) in LScsMRE. Therefore a calibration of the LScsMRE is needed. Using the calibration curve from linear regression, there is only one advanced fibrosis case that was misclassified and showed negligible bias across all the fibrosis stages (0.01±0.21kPa) (Fig. 3A).The average confident area valid for LS calculation in csMRE (AcsMRE) increased by 38.1% compared to sMRE (AsMRE) across all the 136 LS pairs. Specifically, a median increase of 47.0% and 28.6% for normal and elevated LS (>2.9kPa) patients, respectively.
Conclusions
CS accelerated MRE acquisition and decreased the breath-hold time by more than 30%. The LS values from csMRE are consistent with those from sMRE in the lower grade liver fibrosis (normal, mild to moderate) with negligible bias. However, significantly underestimate the LS in the advanced liver stages (Severe), and calibration is needed. The larger available LS confident area yielded more diagnosis confidence map area. A larger cohort of patients is required in order to verify these findings.Acknowledgements
No acknowledgement found.References
1. Guglielmo et al, RadioGraphics, 39(7),1881-2168, 2019
2. Yin et al, Radiology, 278(1),114-124, 2016
3. Zhang et al, JMRI, 43(3),704-712, 2015
Figures