5429
The clinical benefit of high-resolution 3D proton density at 3T in the discrimination between intracranial aneurysm and normal variants1Diagnostic Imaging, Monash Health, Melbourne, Australia
Synopsis
At 3T, a three-dimensional proton density (3D PD) weighted sequence plays a supplementary role to the time-of-flight MR angiography (TOF MRA) to improve diagnosis and significantly decreases indeterminate findings for aneurysm. This leads to better patient care and a measurable decrease in the likelihood for the patient to undergo surveillance or more invasive tests that use ionising radiation and intravenous contrast media like Computed Tomography Angiography (CTA) and Digital Subtraction Angiography (DSA). The anxiety and stress that patients experience due to inconclusive findings and ongoing surveillance has been significantly alleviated since the inclusion of the 3D PD to the protocol.
Background
Normal variants such as infundibula and vascular fenestrations can occur at the origin of cerebral arteries. The incidence of normal variants is as high as 25%.1 An infundibulum is a conical, triangular or funnel shaped dilatation, and fenestrations represent incomplete fusion or duplication of a vessel. The appearances of these variants can be mistaken for an aneurysm which can lead to unnecessary patient surveillance and concern. The ability to distinguish between these pathologies on non-invasive imaging is clinically important to neuro-interventional radiologists and neurosurgeons in determining which patients require ongoing surveillance.2 A patient’s quality of life may also be affected due to fear, anxiety and inconvenience.3At Monash Health, we introduced a high-resolution 3D proton density (PD) sequence to complement the high-resolution time-of-flight magnetic resonance angiogram (TOF MRA) within the aneurysm protocol at 3T. This has led to improved distinction between infundibula, fenestrations and true intracranial saccular aneurysms. The direct result of this improved detection is a significant reduction in unnecessary surveillance. This leads to better patient care by alleviating the patient's anxiety and concern.
Teaching Point
Proton density (PD) is a basic spin echo pulse sequence which is generated using a long repetition time (TR) and short echo time (TE).The PD sequence is acquired on a 3.0 Tesla Vida system with a 64-channel head coil (Siemens, Erlangen, Germany) using an axial 3D turbo spin echo SPACE sequence with the following parameters: Repetition time (TR) 1800 ms; echo time (TE) 43 ms; flip angle 120 degrees; matrix 448 x 426; field of view 200 mm; slice thickness 0.4mm (interpolated to 0.2mm); number of excitations 1.4; scan coverage 32 mm; turbo spin-echo factor 80; acceleration Grappa 2; total acquisition time 6min 29s.
The ability to do multi-planar reconstructions (MPR’s) from the source images provides clearer delineation of arterial structures.4 Small vascular branches can be easily traced from their origins.
The PD weighting is an excellent vessel wall imaging technique, with black blood demonstrated. With its high resolution and high signal-to-noise ratio, it can show smaller vascular structures3 which are not sometimes seen on conventional TOF MRA, which suffers from inherent outflow effects.5
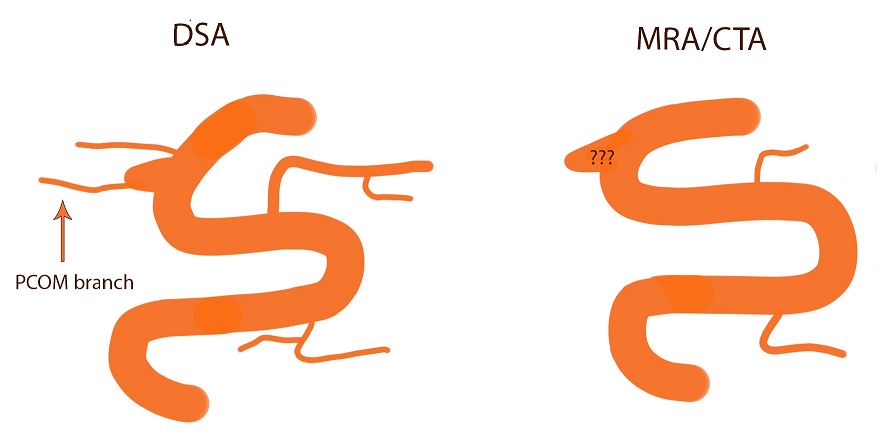
In order to distinguish between aneurysm and normal variants like infundibula or fenestrations, the TOF MRA needs to demonstrate an obvious adjacent branch. If the branch is too small to be seen, then deciding between aneurysm and normal variant is not possible with absolute certainty. (Figure 1). A high number of false positive aneurysms or indeterminate findings is reported to be a limitation of conventional TOF MRA.2
Often the adjacent small intracerebral branches are not visualised on TOF MRA or CTA which, at the site of an outpouching, causes uncertainty about the presence of an aneurysm. It leaves clinicians unable to diagnose with confidence.
Case Study
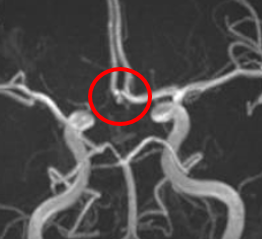
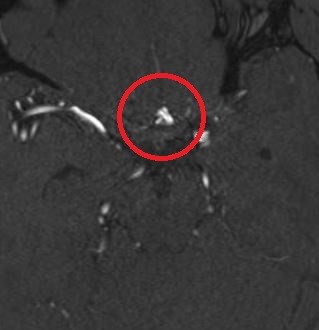
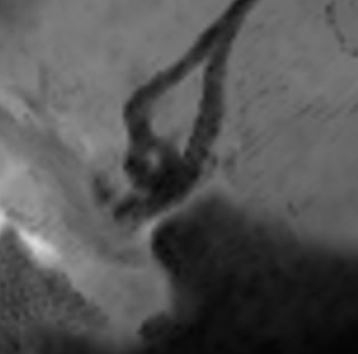
A 44-year-old female presented for outpatient MR imaging in 2018 with persistent left sided pulsatile tinnitus. External imaging was reported as a suspected abnormality of the dura at the left superior para-median frontal region. A dural arteriovenous fistula (DAVF) was suggested, however, upon imaging at our institution, no DAVF could be identified. The consultant neuro-interventional radiologist reported an incidental finding of a 2mm aneurysm of the anterior communicating artery (Figures 2 and 3).
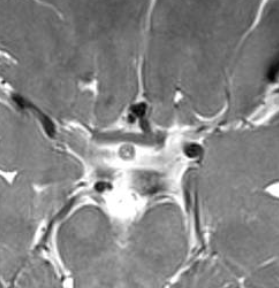
The patient was then followed up annually with MRI/MRA over the next four years due to this incidental finding. On the patients fourth return visit, the 3D PD sequence had been instituted as part of the routine aneurysm screening protocol. PD source images (Figure 4) with multi-planar reconstruction (Figure 5) demonstrated that the outpouching initially thought to represent an inferiorly directed anterior communicating artery aneurysm was in fact a fenestration of the anterior communicating artery with no evidence of aneurysm at this location.
The advantage of the 3D PD sequence is the ability to distinguish between the low signal of a blood vessel, intermediate signal of neural tissue and high signal of cerebrospinal fluid (CSF).2 Therefore, it provides excellent delineation of intracranial arteries and connecting branches.
Until now, there have been very few non-invasive imaging options available to aid in the diagnosis of intracranial aneurysm besides TOF MRA and CTA. DSA is still considered the gold standard for the assessment of intracranial vessels and aneurysms, however, this carries with it risks associated with procedural complications including stoke, and the patients exposure to ionising radiation and iodinated contrast media.1,2 Other limiting factors include access to the DSA suite and the expense.
Conclusion
At 3T, the 3D PD sequence plays a supplementary role and complements the TOF MRA to improve diagnostic accuracy of aneurysm and decrease the number of indeterminate or false positive diagnoses.3 This in turn results in improved patient care through the reduction of invasive DSA examinations, with its risks of complications, along with a decrease in unnecessary MRI/MRA surveillance which leads to considerably reduced patient concern, anxiety and the inconvenience of yearly follow-up.2,3,6Acknowledgements
We would like to acknowledge Professor Roland Bammer and Associate Professor Ronil Chandra for their professional guidance in the development of this sequence which has improved patient outcomes at our institution.References
1. Sun Z-K, Li Y-D, Li M-H, Chen S-W, Tan H-Q. Detection of infundibula using three-dimensional time-of-flight magnetic resonance angiography with volume rendering at 3.0 Tesla compared to digital subtraction angiography. J Clin Neurosci. 2010;18(4):504-8.
2. Kim S, Chung J, Cha J, Kim BM, Kim DJ, Kim YB, et al. Usefulness of high-resolution three-dimensional proton density-weighted turbo spin-echo MRI in distinguishing a junctional dilatation from an intracranial aneurysm of the posterior communicating artery: a pilot study. J Neurointerv Surg. 2020;12(3):315-9.
3. Kim JW, Shin N-Y, Kim YD, Lee S-K, Lim SM, Oh SW. Added Value of 3D Proton-Density Weighted Images in Diagnosis of Intracranial Arterial Dissection. PLoS One. 2016;11(11):e0166929-e.
4. Yoon SJ, Shin N-Y, Lee JW, Huh SK, Park KY. Localization and Treatment of Unruptured Paraclinoid Aneurysms: A Proton Density MRI-based Study. J Cerebrovasc Endovasc Neurosurg. 2015;17(3):180-4.
5. Sun L-J, Li Y-D, Li M-H, Wang W, Gu B-X. Aneurysm outflow angle at MRA as discriminant for accurate diagnosis and differentiation between small sidewall cerebral aneurysms and infundibula. J Neurointerv Surg. 2017;9(6):591-4.
6. Yim Y, Jung SC, Kim JY, Kim S-O, Kim BJ, Lee DH, et al. Added diagnostic values of three-dimensional high-resolution proton density-weighted magnetic resonance imaging for unruptured intracranial aneurysms in the circle-of-Willis: Comparison with time-of-flight magnetic resonance angiography. PLoS One. 2020;15(12):e0243235-e.
Figures