5425
Metabolic Tumor Volume prediction by using Hand Craft Fuzzy Rule Base System (FRBS) on Simultaneous PET/MRI1Department of Molecular Imaging and Nuclear Medicine, PET SUITE: Indraprastha Apollo Hospitals and House of Diagnostics, Delhi, India, 2Department of Physics, Vivekananda Global University, Jaipur, India
Synopsis
18F-FDG PET/MRI can be helpful for diagnosing, staging, restaging, and assessing the post therapeutic response in breast cancer patients. Metabolic tumor volume (MTV) may be more reliable but volumetric assessments of FDG PET needs correct tumor segmentation. We have proposed hand craft fuzzy rule base system to improve tumor volume by using simultaneous PET/MRI for accurate MTV estimation. Four breast cancer patients underwent FDG PET/MRI for staging purpose. Pathological tumor volume was compared with MRI volume, Ktrans volume and MTV computed by hand craft fuzzy rule and the results showed fuzzified tumor volume were more accurate compared with other volumes.
Introduction
Breast cancer patients' tumour size, which is a component of the TNM (tumor/nodes/metastases) staging system, is a crucial indicator of their prognosis. Because achieving a negative resection margin after surgery might reduce tumour recurrence. Accurate tumour size measurement affects surgical approach and prognosis prediction1,2. Using 18F-FDG PET/MRI), a non-invasive technique for assessing glucose metabolism, can be helpful for diagnosing, staging, restaging, and assessing the post therapeutic response in patients with breast cancer3. The metabolic tumor volume (MTV) or total lesion glycolysis (TLG) of 18F-FDG PET may be more reliable but on the other hand the volumetric parameters have yet to be introduced into normal clinical practise. This is because, volumetric assessments of FDG PET need correct tumor segmentation4,5. MRI has the best resolution, but there is a problem of overestimating tumor size in up to 56% of patients6,7. Fuzzified tumor volume may improve the tumor volume estimation.Purpose
We have proposed hand craft fuzzy rule base system to improve tumor volume by using simultaneous PET/MRI for accurate MTV estimation.Methodology
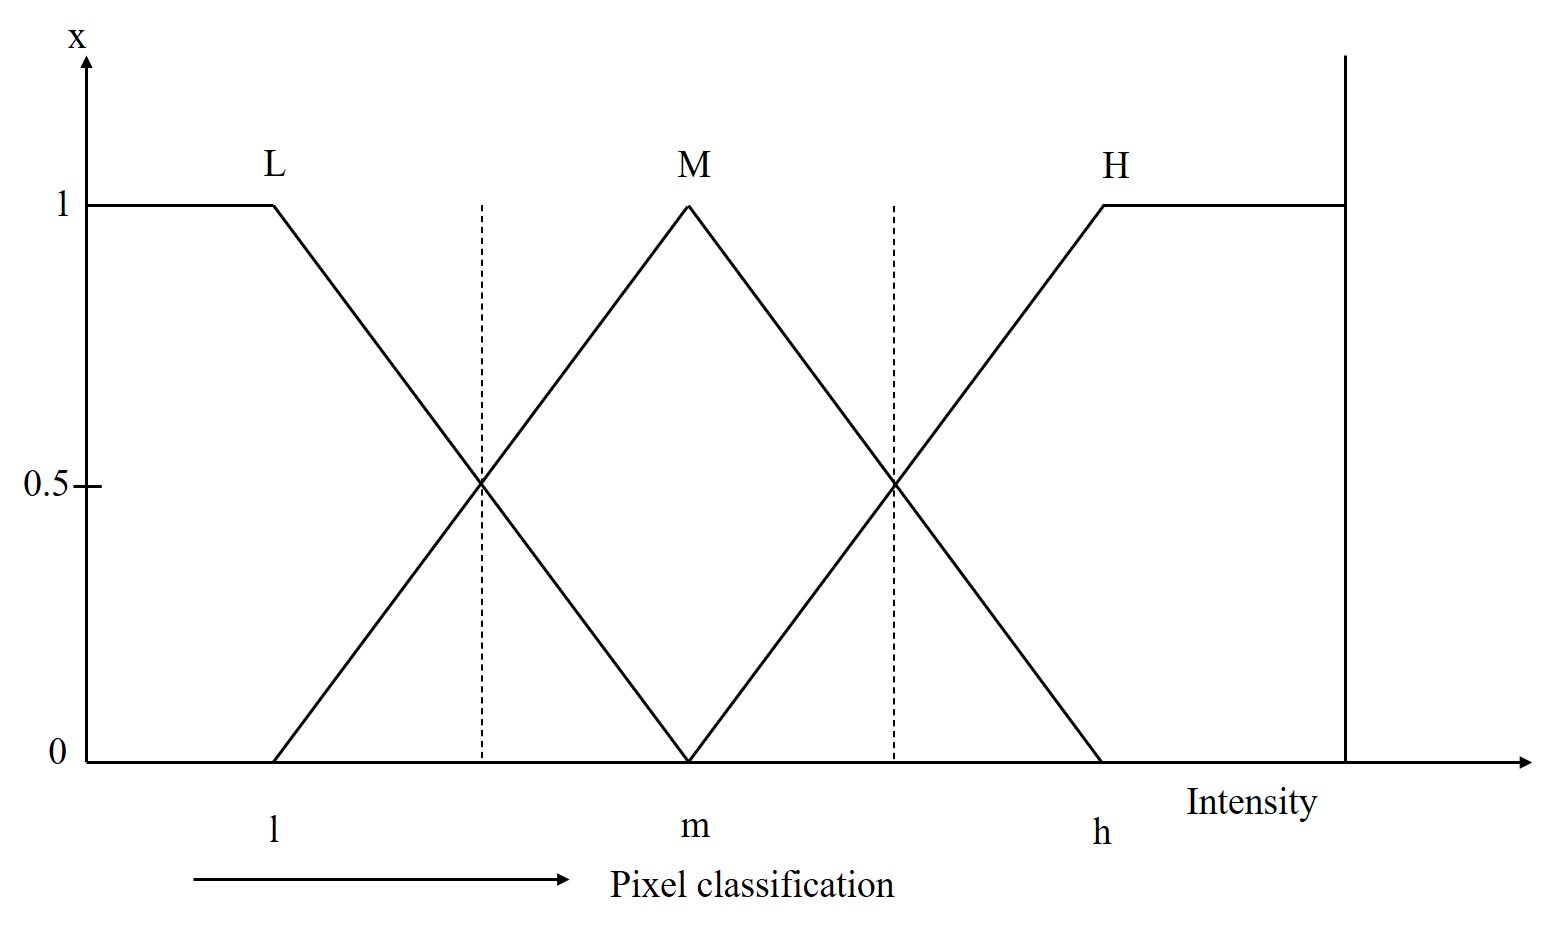
Four breast cancer patients underwent FDG PET/MRI for staging purpose. Pathological tumor volume was compared with MRI volume, Ktrans volume and MTV computed by hand craft fuzzy rule.To fuzzify the value, we defined three triangular functions (left triangle, triangle, and right triangle), as shown in Figure 1. The intensity and class borders are represented by the x-axis (horizontal axis), while the associated fuzzy membership value is represented by the y-axis (vertical axis)8. Depending on the degree of belongingness, the fuzzy membership value of each intensity value is calculated and assigned a linguistic fuzzy value L, M, or H.
The pixel classification was achieved using fuzzy if–then rules. If A, then B is the general form of the rule, where A is the antecedent and B is the result. Each pixel is assigned nine membership values. We obtain appropriate labels for the pixel in terms of tissue type (Malignant and benign) utilising fuzzy rules based on their membership values. The following is the algorithm:
1. Match the matrix size of all the parameters. i.e. Ktrans, Post contrast intensity and PET.
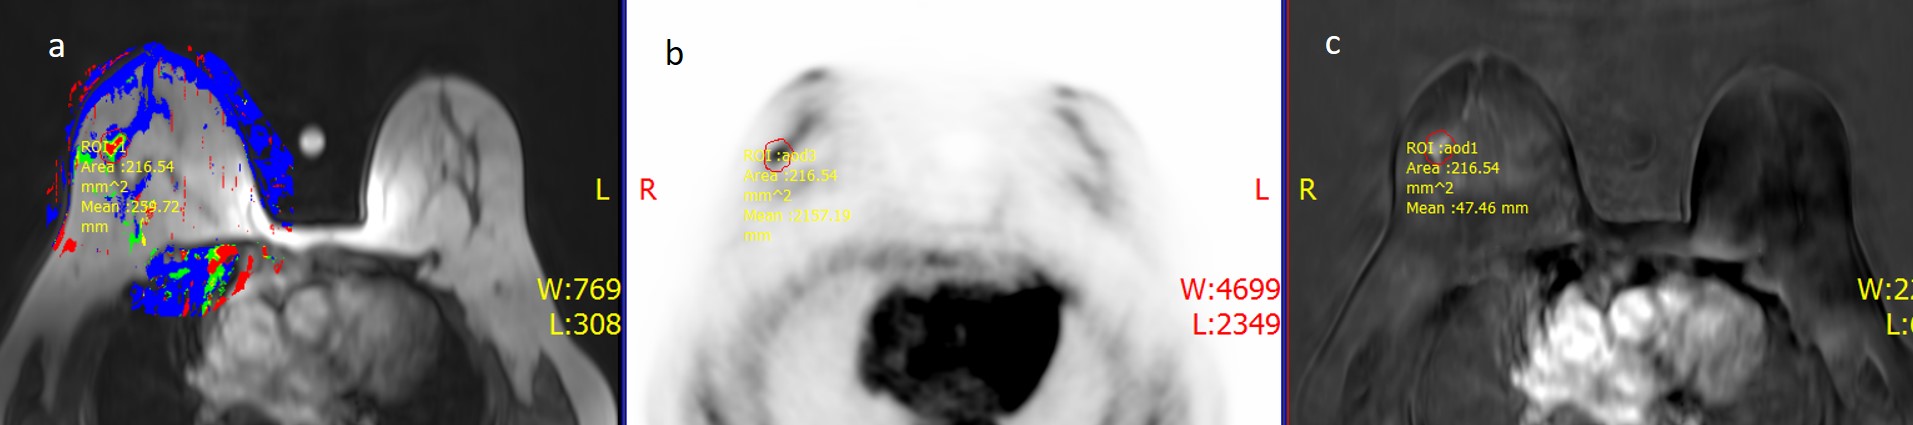
2. Create the ROI in Post contrast subtracted image and pasted in Ktrans and PET image by using Radvista software (Figure-2).
3. Select the pixel to be classified.
4. Use fuzzy rules to classify the pixel into Ktrans, Post contrast intensity and PET SUV.
5. Calculate the volume on the base of voxel.
Handcrafted fuzzy rules
The goal of the study was to sort each pixel into one of the several tissue kinds (Malignant or Benign). Handcrafted FRBS were used to classify the pixels. We applied a mix of additional spatial domain features to classify these pixels. These criteria were based on the Ktrans High, Medium, and Low pixel values, as well as the PET SUV value and Post Contrast intensity. Less than 0.15 in Ktrans, less than 1.0 PET SUV and less than 190 intensity value were considered as normal thus not include in the equation. Low, Medium and High value of the Ktrans, Post contrast intensity and PET SUV define as below:
1. Ktrans value L=0.15, M=0.30 and High= 0.56.
2. Intensity L=190, Medium= 230 and High = 265
3. PET SUV L= 1, Medium= 1.5 and High= 2.0
The membership value of the consequent was determined by using the membership value of the antecedents. If many rules were fired for a pixel, classification was determined by the label with the highest membership value.
The twenty-seven handcrafted rules that had been considered for classification were:
Example
1. IF Intensity is L AND SUV is M AND Ktrans is H THEN M
2. IF Intensity is L AND SUV is L AND Ktrans is H THEN B
3. IF Intensity is H AND SUV is M AND Ktrans is H THEN M
4. IF Intensity is H AND SUV is L AND Ktrans is H THEN M
For example, if a pixel's intensity value in Ktrans, post contrast intensity and PET SUV is low, the pixel is most likely to be Benign. Same, if a pixel's intensity value in Ktrans, post contrast intensity and PET SUV is high, the pixel is most likely to be malignant.
Results
In this experiment, four histo-pathologically proved breast cancer patient tumor volume was evaluated by using FRBS. Histopathological tumor volume was compared with MRI volume, Ktrans volume and MTV computed by hand craft fuzzy rule and the results showed fuzzified tumor volume were more accurate compared with other volumes shown in Table 1.| Patient No. | No. of Pixel | Malignant Nature | Benign Nature | Voxel Size | Pathological Volume (cm3) | MRI Volume (cm3) | Ktrans Volume (cm3) | MTV computed by FRBS (cm3) |
| 1 | 2903 | 290 | 2613 | 4.39x1.41x4 mm | 3.51 | 2.73 | 4.08 | 3.59 |
| 2 | 1118 | 191 | 927 | 4.39x1.41x4 mm | 2.25 | 1.65 | 2.77 | 2.36 |
| 3 | 328 | 309 | 20 | 4.79x1.53x4 mm | 10.08 | 3.67 | 3.57 | 9.05 |
| 4 | 567 | 287 | 280 | 4.39x1.41x4 mm | 3.51 | 3.96 | 3.00 | 3.55 |
Conclusion:
We demonstrated that the accurate MTV computation by using hand craft FRBS was possible. The cohort size was small thus needed to be verified on large cohort and may be helpful for chemotherapy response evaluation.Acknowledgements
No acknowledgement found.References
1. Grimsby GM, Gray R, Dueck A et al. Is there concordance of invasive breast cancer pathologic tumor size with magnetic resonance imaging? Am J Surg 2009; 198: 500-4.2. Amano G, Ohuchi N, Ishibashi T et al. Correlation of three-dimensional magnetic resonance imaging with precise histopathological map concerning carcinoma extension in the breast. Breast Cancer Res Treat 2000; 60: 43-55.
3. Taneja S, Jena A, Goel R, Sarin R Kaul S. Simultaneous whole-body 18F-FDG PET-MRI in primary staging of breast cancer: a pilot study. Eur J Radiol. 2014; 83: 2231-39.
4. Cheebsumon P, van Velden FHP, Yaqub M, et al. Effects of image characteristics on performance of tumor delineation methods: a test–retest assessment. J Nucl Med. 2011;52:1550–8.
5. Moon SH, Hyun SH, Choi JY. Prognostic significance of volumebased PET parameters in cancer patients. Korean J Radiol. 2013;14: 1–12.
6. Onesti JK, Mangus BE, Helmer SD, Osland JS. Breast cancer tumor size: correlation between magnetic resonance imaging and pathology measurements. Am J Surg 2008; 196: 844-8; discussion 9-50.
7. Haraldsdottir KH, Jonsson T, Halldorsdottir AB et al. Tumor size of invasive breast cancer on magnetic resonance imaging and conventional imaging (Mammogram/Ultrasound): comparison with pathological size and clinical implications. Scand J Surg 2017; 106: 68-73.
8. Shashi Bhushan Mehta, Santanu Chaudhury, Asok Bhattacharyya, Amarnath Jena. “Handcrafted fuzzy rules for tissue classification” Magnetic Resonance Imaging 26 (2008) 815–823.
Figures