5418
Quantitative assessment of anterior talofibular ligament quality in chronic ankle instability using T2* relaxation time1Division of Radiology and Nuclear Medicine, Sapporo Medical University Hospital, Sapporo, Japan, 2Department of Orthopedic Surgery, Sapporo Medical University School of Medicine, Sapporo, Japan, 3Second Division of Physical Therapy, Sapporo Medical University School of Health Sciences, Sapporo, Japan
Synopsis
This study investigated the feasibility of quantitative assessment of anterior talofibular ligament (ATFL) quality in chronic ankle instability (CAI) using T2* relaxation time. A prediction equation for the normal ATFL reference value was calculated in healthy volunteers. The ratio between the normal reference value and the patient's T2* value showed a significant positive correlation with the talar tilt angle on stress radiograph. There was also increasing trend in T2* values for poor ligament quality in the arthroscopic findings. T2* relaxation times are promising for quantitatively assessing ATFL quality preoperatively.
Background and Purpose
Ankle sprain is one of the most frequent injuries during daily living and sports activities, most commonly associated with anterior talofibular ligament (ATFL) injury. Chronic ankle instability (CAI) is a common problem after ATFL injury, and surgery is indicated if conservative treatment fails. ATFL repair is the first-line CAI surgical treatment when the residual ligament remains. Although it is suggested that the residual ligament’s quality influences the treatment outcome1, few studies have examined any method of preoperative ATFL quantitative assessment. The purpose of this study was to investigate the feasibility of quantitative evaluation of ATFL quality in CAI using T2* relaxation time.Methods
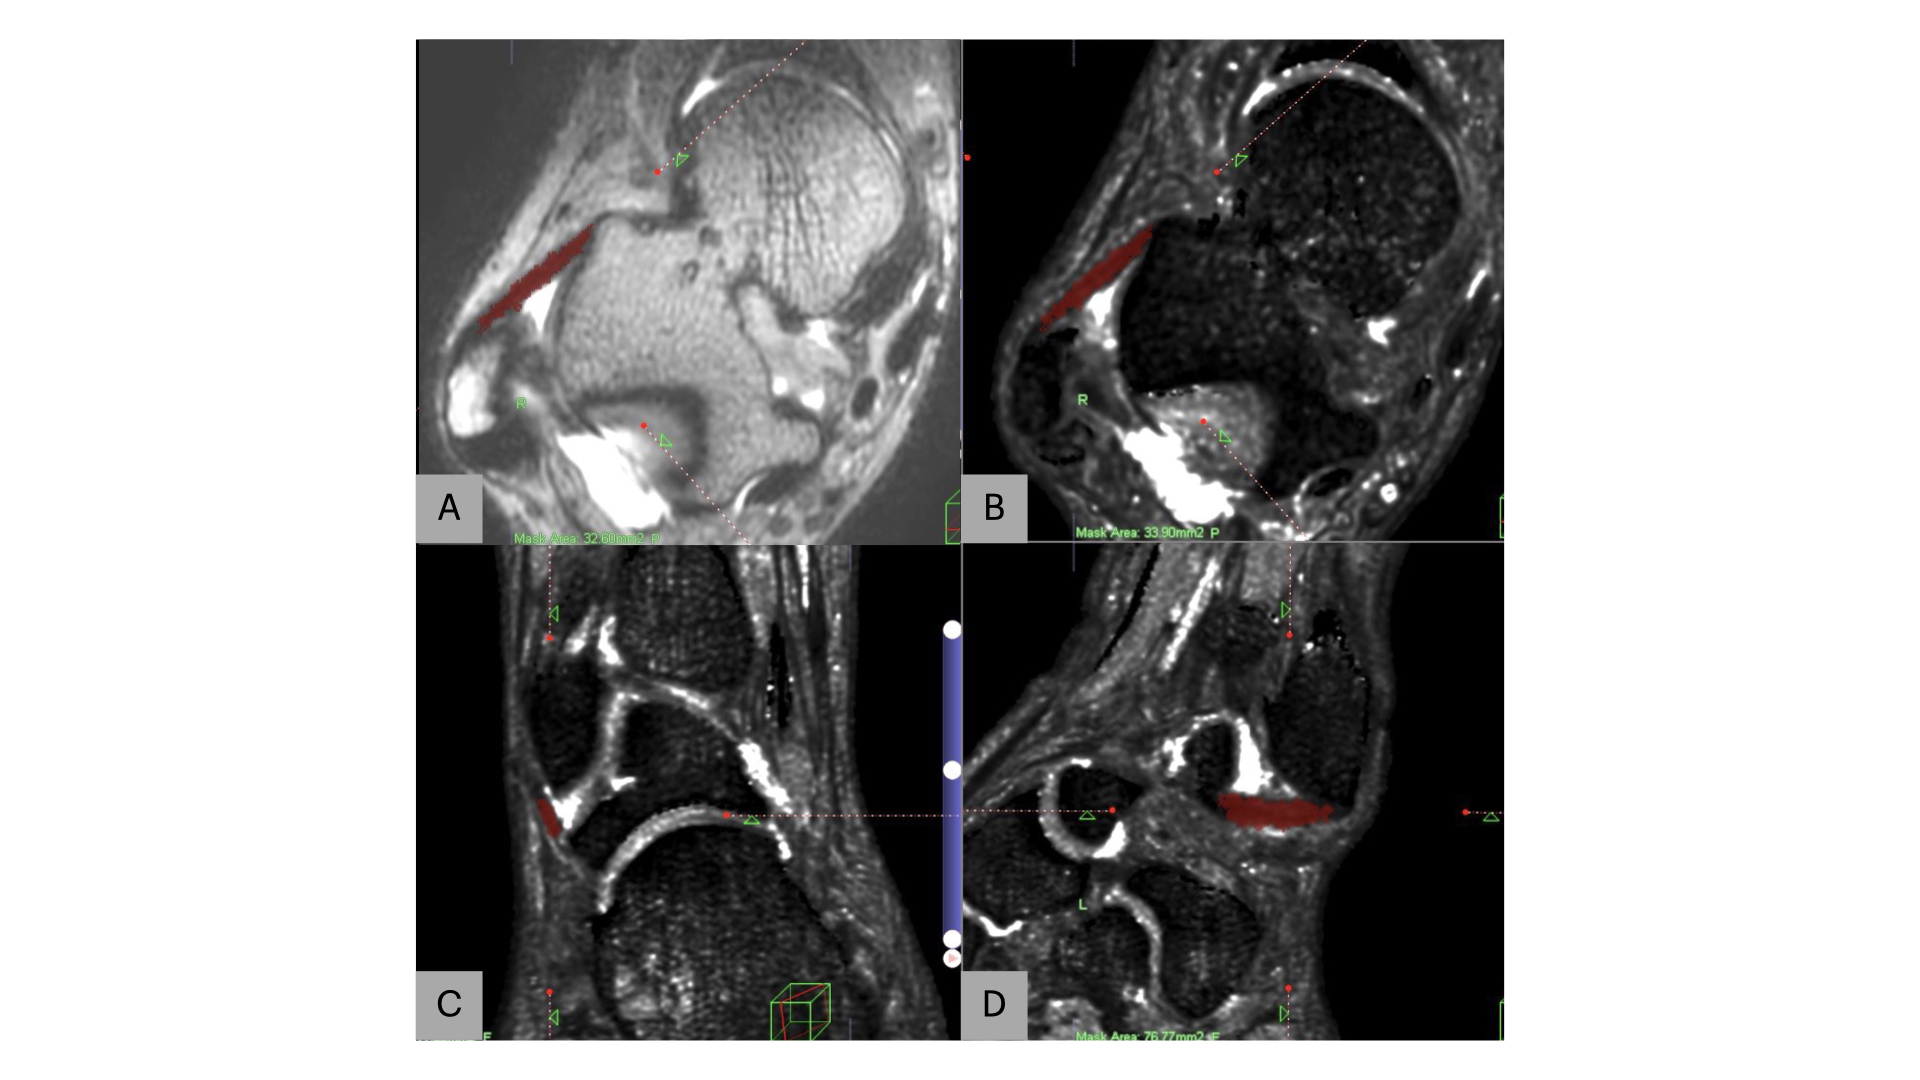
A total of 13 patients with CAI (7 males, 6 females; 16–66 years old) and 30 healthy volunteers (16 males, 14 females; 23–60 years old) were enrolled in this study. All patients and healthy volunteers underwent 3T MRI consisting of structural 3D T2 weighted images along with T2* map images. The T2* map image parameters were as follows: TR = 32 ms; TE = 2.3, 4.6, 6.9, 9.2, 11.5, 13.8, and 16.1 ms; flip angle = 13° and voxel size = 0.6 × 0.6 × 0.6mm. The entire ATFL T2* values from the T2* map was measured (Fig. 1). In the healthy group, T2* normal reference value was calculated using the prediction equation (variables: age, height, weight) in a multiple linear regression model. T2* ratio was defined as the ratio of the actual T2* value of the patient's own ATFL to the normal reference value for each patient. The talar tilt angle (TTA) was measured from the stress radiograph using Telos device, and the ATFLs tension (taut, mild laxity, and laxity) and quality (excellent, moderate, and poor) were evaluated from arthroscopic findings2.Results
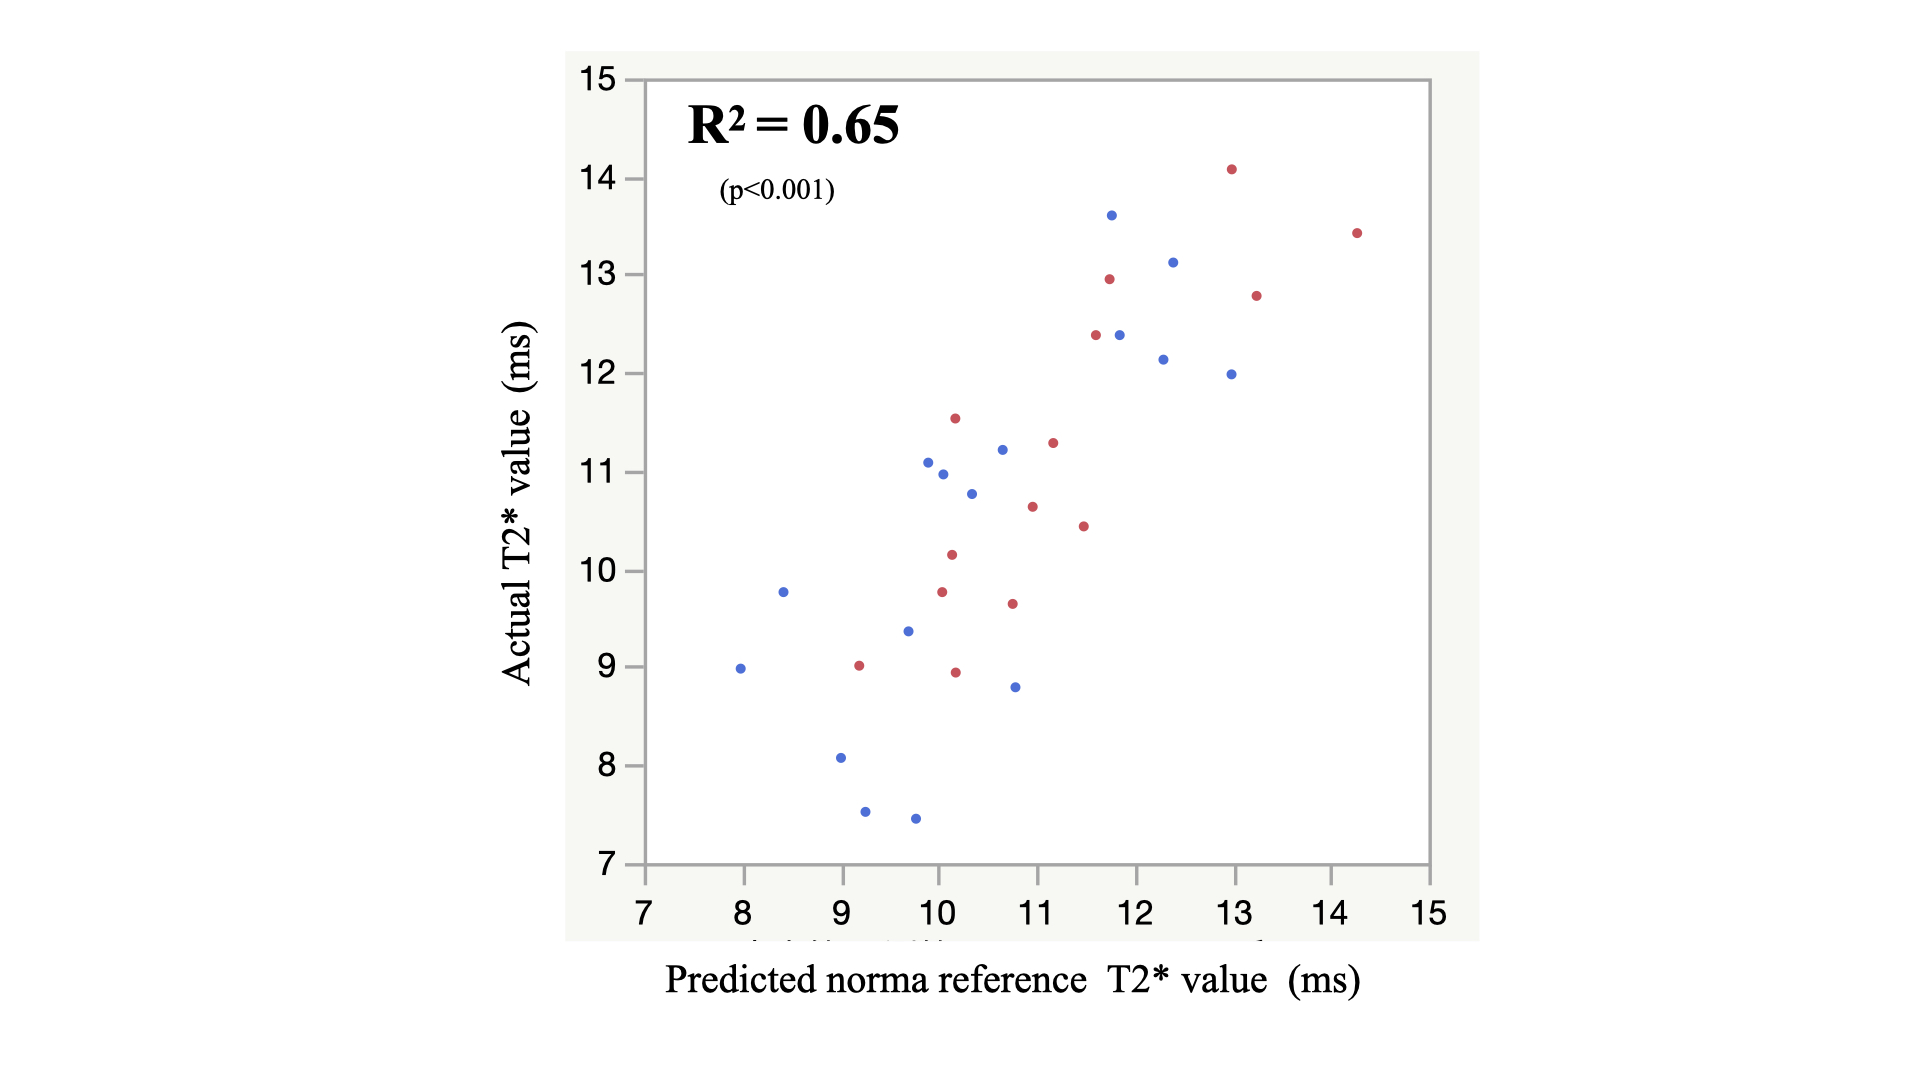
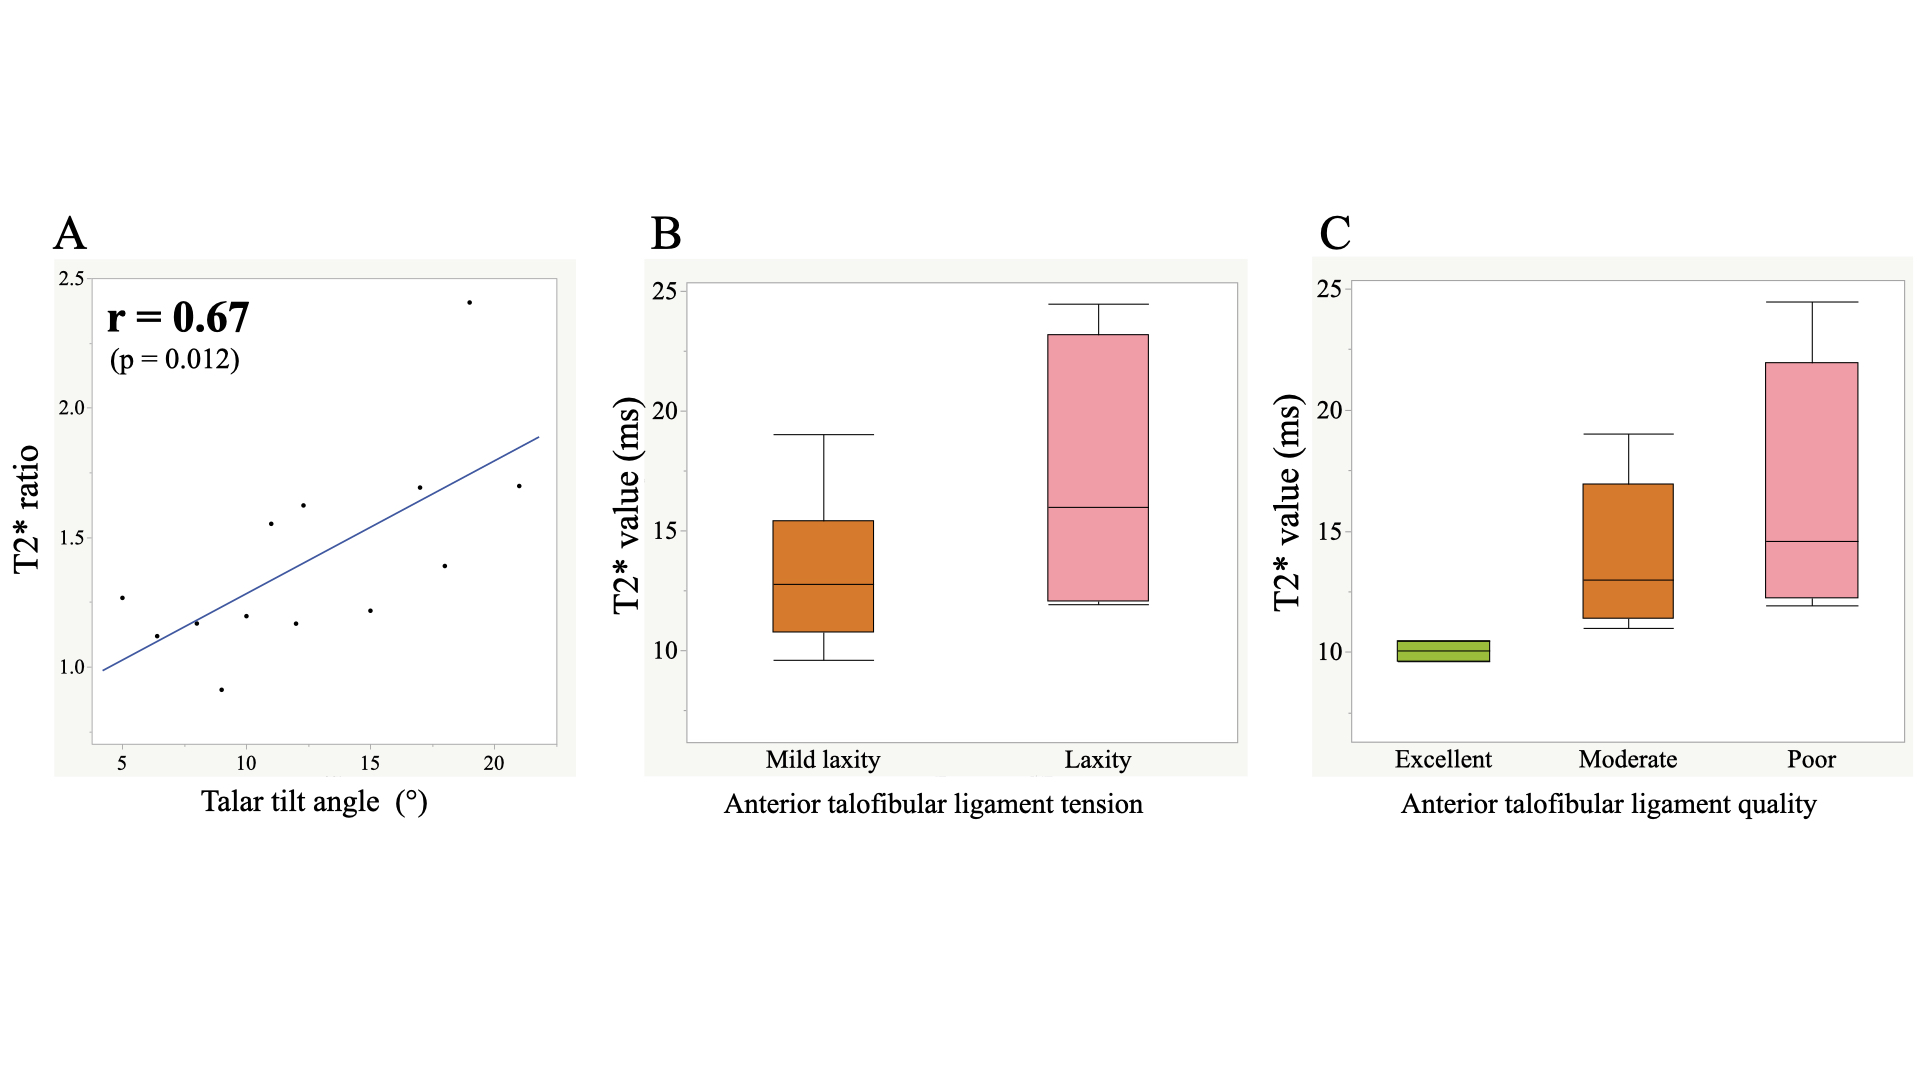
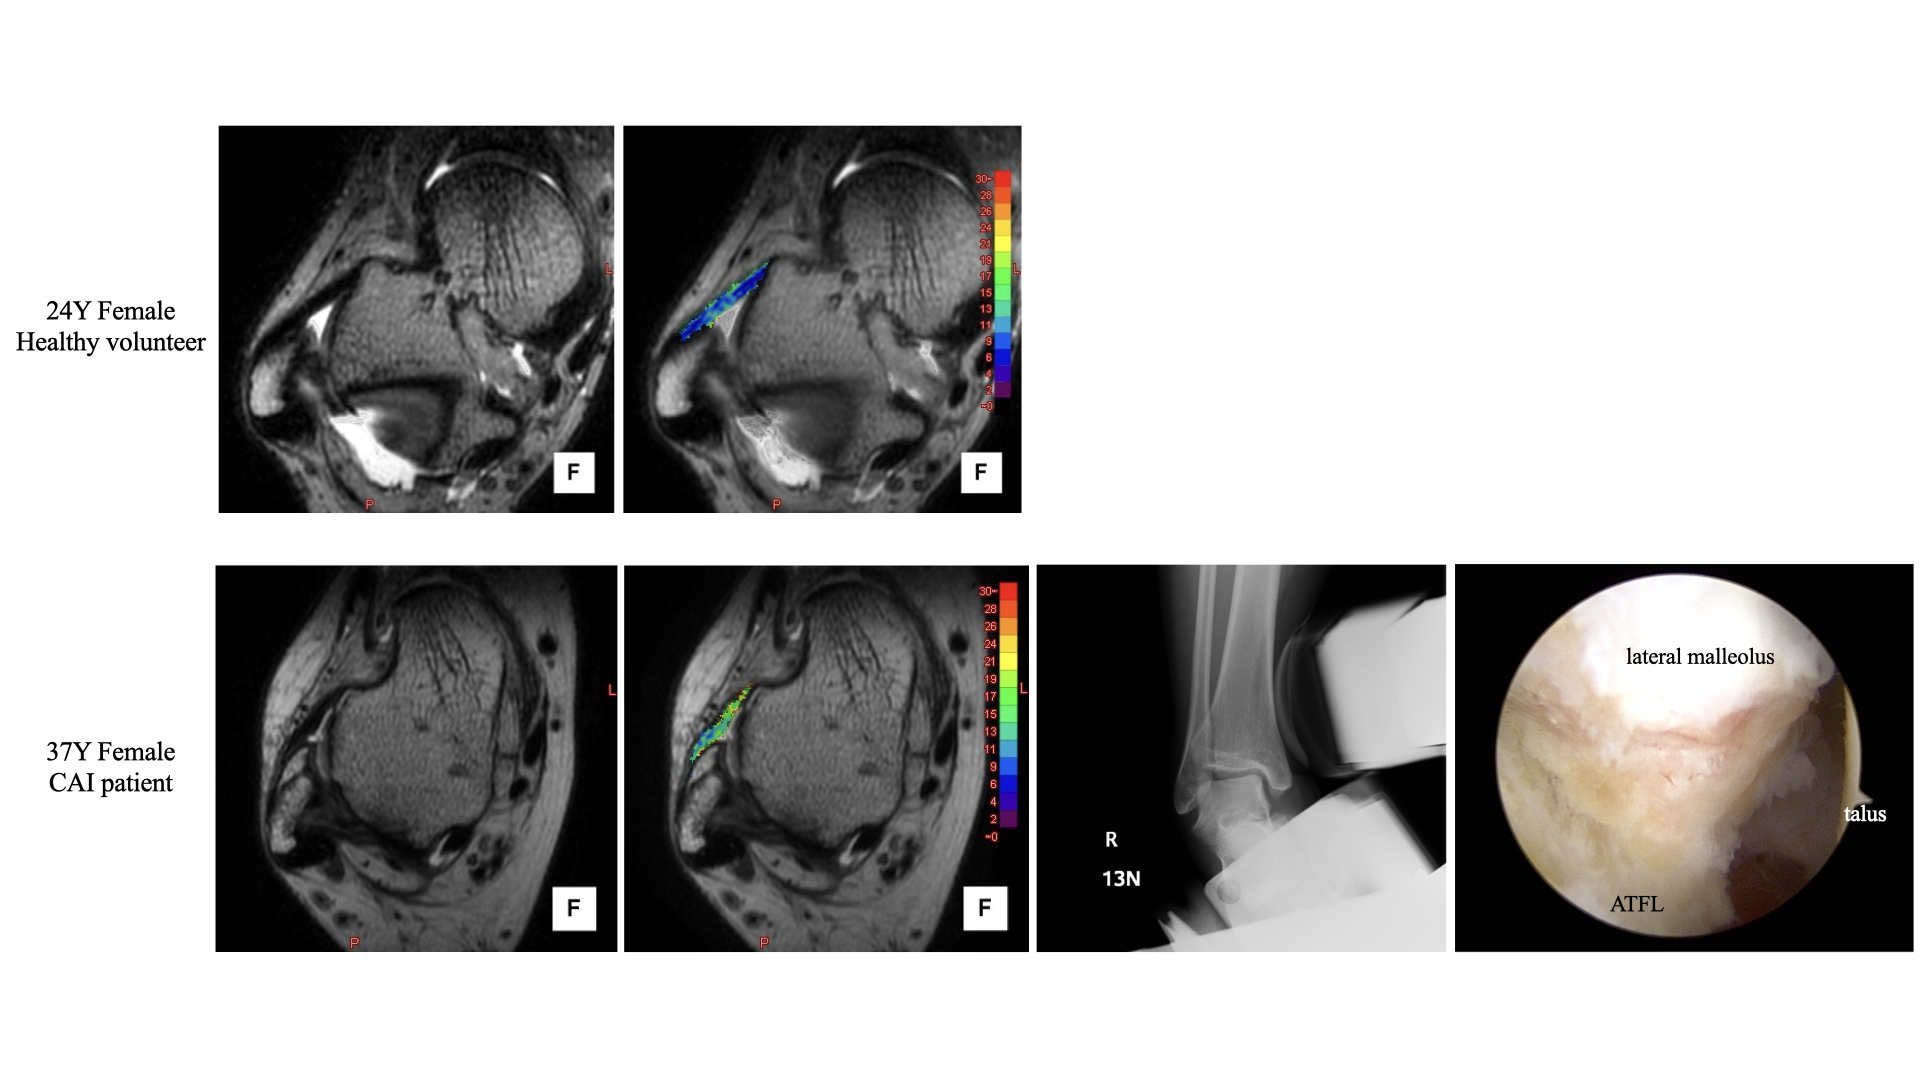
T2* values of the ATFL in the healthy and CAI groups were 10.40 ± 1.72 ms and 14.36 ± 4.30 ms, respectively; significantly higher in the CAI group (p < 0.05). Prediction equation of normal reference T2* value was [14.9 + 0.14 × age (years) −4.7 × height (m) −0.03 × weight (kg)] (R2 = 0.65, p < 0.001) (Fig. 2). The mean TTA was 12.6 ± 5.0° and arthroscopic findings were as follows: ATFL tension (taut: 0, mild laxity: nine cases, laxity: four cases); quality (excellent: two cases, moderate: six cases, poor: five cases). There was a significant positive correlation between the T2* ratio and TTA (r = 0.67, p = 0.012) showing a trend toward higher T2* values as the intraoperative findings increased from mild laxity to laxity, or excellent, moderate, or poor (Fig. 3). Representative 3D T2 image, T2* map fusion image, stress radiograph, and arthroscopic images are shown in Fig. 4.Conclusion
T2* values in patients with CAI were higher than those in healthy subjects and, moreover, tended to be higher with decreased ATFL tension and quality in arthroscopic findings. The T2* ratio correlated with TTA, suggesting that T2* relaxation times are promising for quantitatively assessing ATFL quality preoperatively.Acknowledgements
The authors would like to thank Enago (www.enago.jp) for the English language review.References
1. Michels F, Pereira H, Calder J, et al. Searching for consensus in the approach to patients with chronic lateral ankle instability: ask the expert. Knee Surg Sports Traumatol Arthrosc. 2018;26(7):2095-2102.
2. Ahn J, Choi JG, Jeong BO. The signal intensity of preoperative magnetic resonance imaging has predictive value for determining the arthroscopic reparability of the anterior talofibular ligament. Knee Surg Sports Traumatol Arthrosc. 2021;29(5):1535-1543.
Figures