5406
Radomics Model and Deep Learning Model Based on T1WI Image for Acute Lymphocytic Leukemia Identification1Hunan Children's Hospital, Changsha, China, 2Fuzhou University, Fuzhou, China, 3MR Scientific Marketing, Siemens Healthineers, Guangzhou, China
Synopsis
This study investigated the feasibility of radomics model and deep learning model Based on T1WI image for acute lymphocytic leukemia identification. The results showed that both radomics model and deep learning model can effectively distinct ALL children and normal children. And radomic model is better.
Abstract
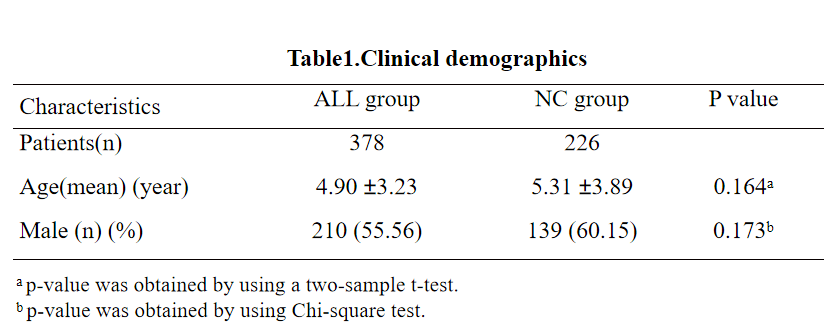
Objective:The purpose of this study was to explore the value of radomics model and deep learning model based on T1WI image for acute lymphocytic leukemia identification.Methods:A total of 604 T1WI images of ALL children (ALL group) and normal children (NC group) from 2015 to 2022, including 378 cases in ALL group and 226 cases in NC group. Radomics features were extracted independently by two radiologists after manually marking the region of interest (ROI) along the slope edge in the median sagittal position of T1WI. All samples were randomly divided into the training set and the validation set according to 9:1. In the training set, the radomics features with a correlation coefficient greater than 0.99 were included in the study, and the recursive feature elimination was used to select the features, and finally the support vector machine was used to classify the radomics model. In addition, the training set images were input into the Efficientnet-B3 network model to establish a deep learning model. The above two models were validated in the validation set, and the sensitivity, the specificity, and the area under the ROC curve were calculated to evaluate the diagnostic efficacy of the different models.
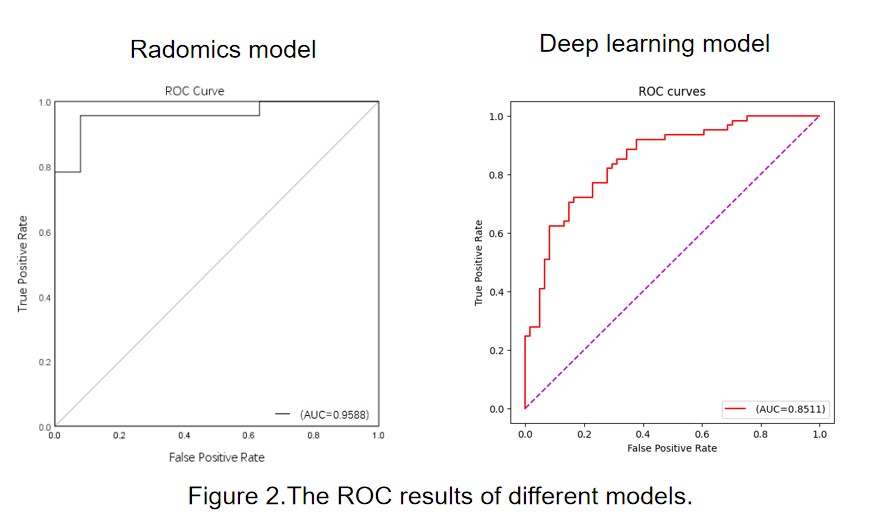
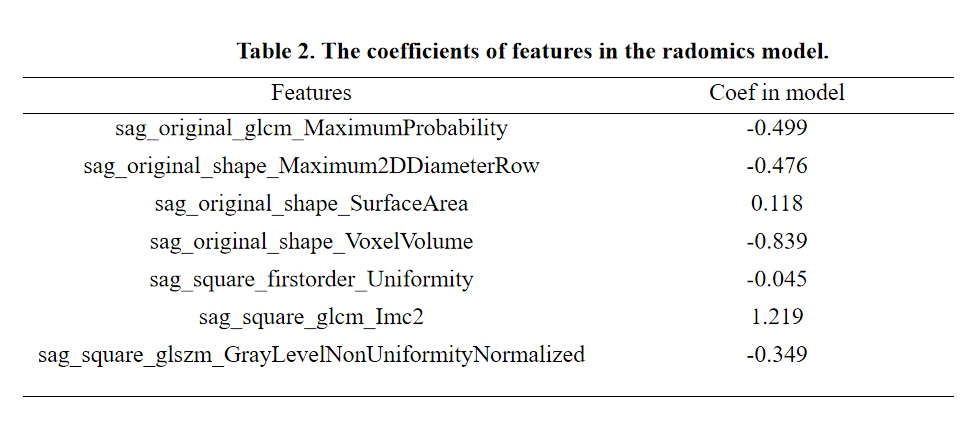
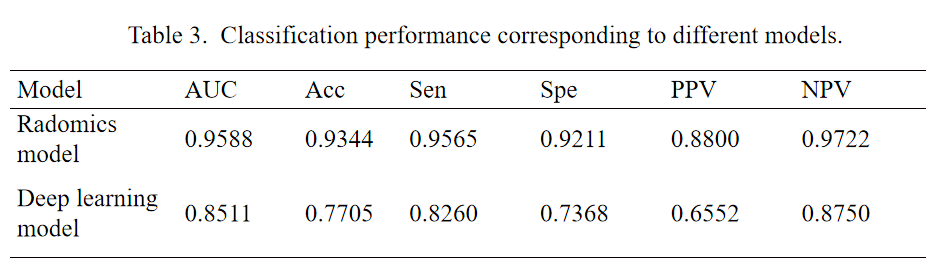
Results: Seven features were selected from radomics model. And the model of radomics / deep learning achieved an AUC of 0.9588/0.8511 on the test data set. The sensitivity/specificity/positive predictive value (PPV)/negative predictive value (NPV) achieved to 0.9565/0.9211/0.8800/0.9722 for radomics model and 0.8260/0.7368/0.6552/0.8750 for deep learning model.
Conclusion:Only using radomics model or deep learning model could distinguish ALL children from normal children. And radomics model is better.
Acknowledgements
We extend our thanks to all of the authors for their expertassistance in this work.References
[1]Zhang, Y., Wang, S., Zhang, J. et al. Elucidating minimal residual disease of paediatric B-cell acute lymphoblastic leukaemia by single-cell analysis[J].Nature cell biology,2022,24(2):242-252.
[2]Chen Y, Li J, Zhao Z. Redox Control in Acute Lymphoblastic Leukemia: From Physiology to Pathology and Therapeutic Opportunities. Cells. 2021 May;10(5):1218.
[3]Patrick A Brown, Bijal Shah, et al. Journal of the National Comprehensive Cancer Network: JNCCN 2021 09 20;19(9):1079-1109.
[4]Ehrenfeld V., Fulda S. Thioredoxin inhibitor PX-12 induces mitochondria-mediated apoptosis in acute lymphoblastic leukemia cells. Biol. Chem. 2020;401:273-283.
[5]Leithner D, Horvat JV, Ochoa-Albiztegui RE, et al. Imaging and the completion of the omics paradigm in breast cancer. Der Radiologe. 2018 Nov;58(Suppl 1):7-13.
[6]Andersen MB,Harders SW,Ganeshan B, et al.CT texture analysis can help differentiate between malignant and benign lymph nodes in the mediastinum in patients suspected for lung cancer[J].Acta Radiol,2016,57(6):669-676.
[7]Tu W,Sun G,Fan L,et al.Radiomics signature:a potential and incremental predictor for EGFR mutation status in NSCLC patients, comparison with CT morphology[J].Lung Cancer,2019,132(1):28-35.
[8]Divya D,Ganeshbabu TR.Fitness adaptive deer hunting-based re gion growing and recurrent neural network for melanoma skin cancer detection[J].Int JImag Syst Tech,2020,30(3):731-752.
[9]Yang Song, Jing Zhang, et al. FeAure Explorer:A tool for developing and comparing radomics models[J].PloS one 2020;15(8):e0237587.
Figures
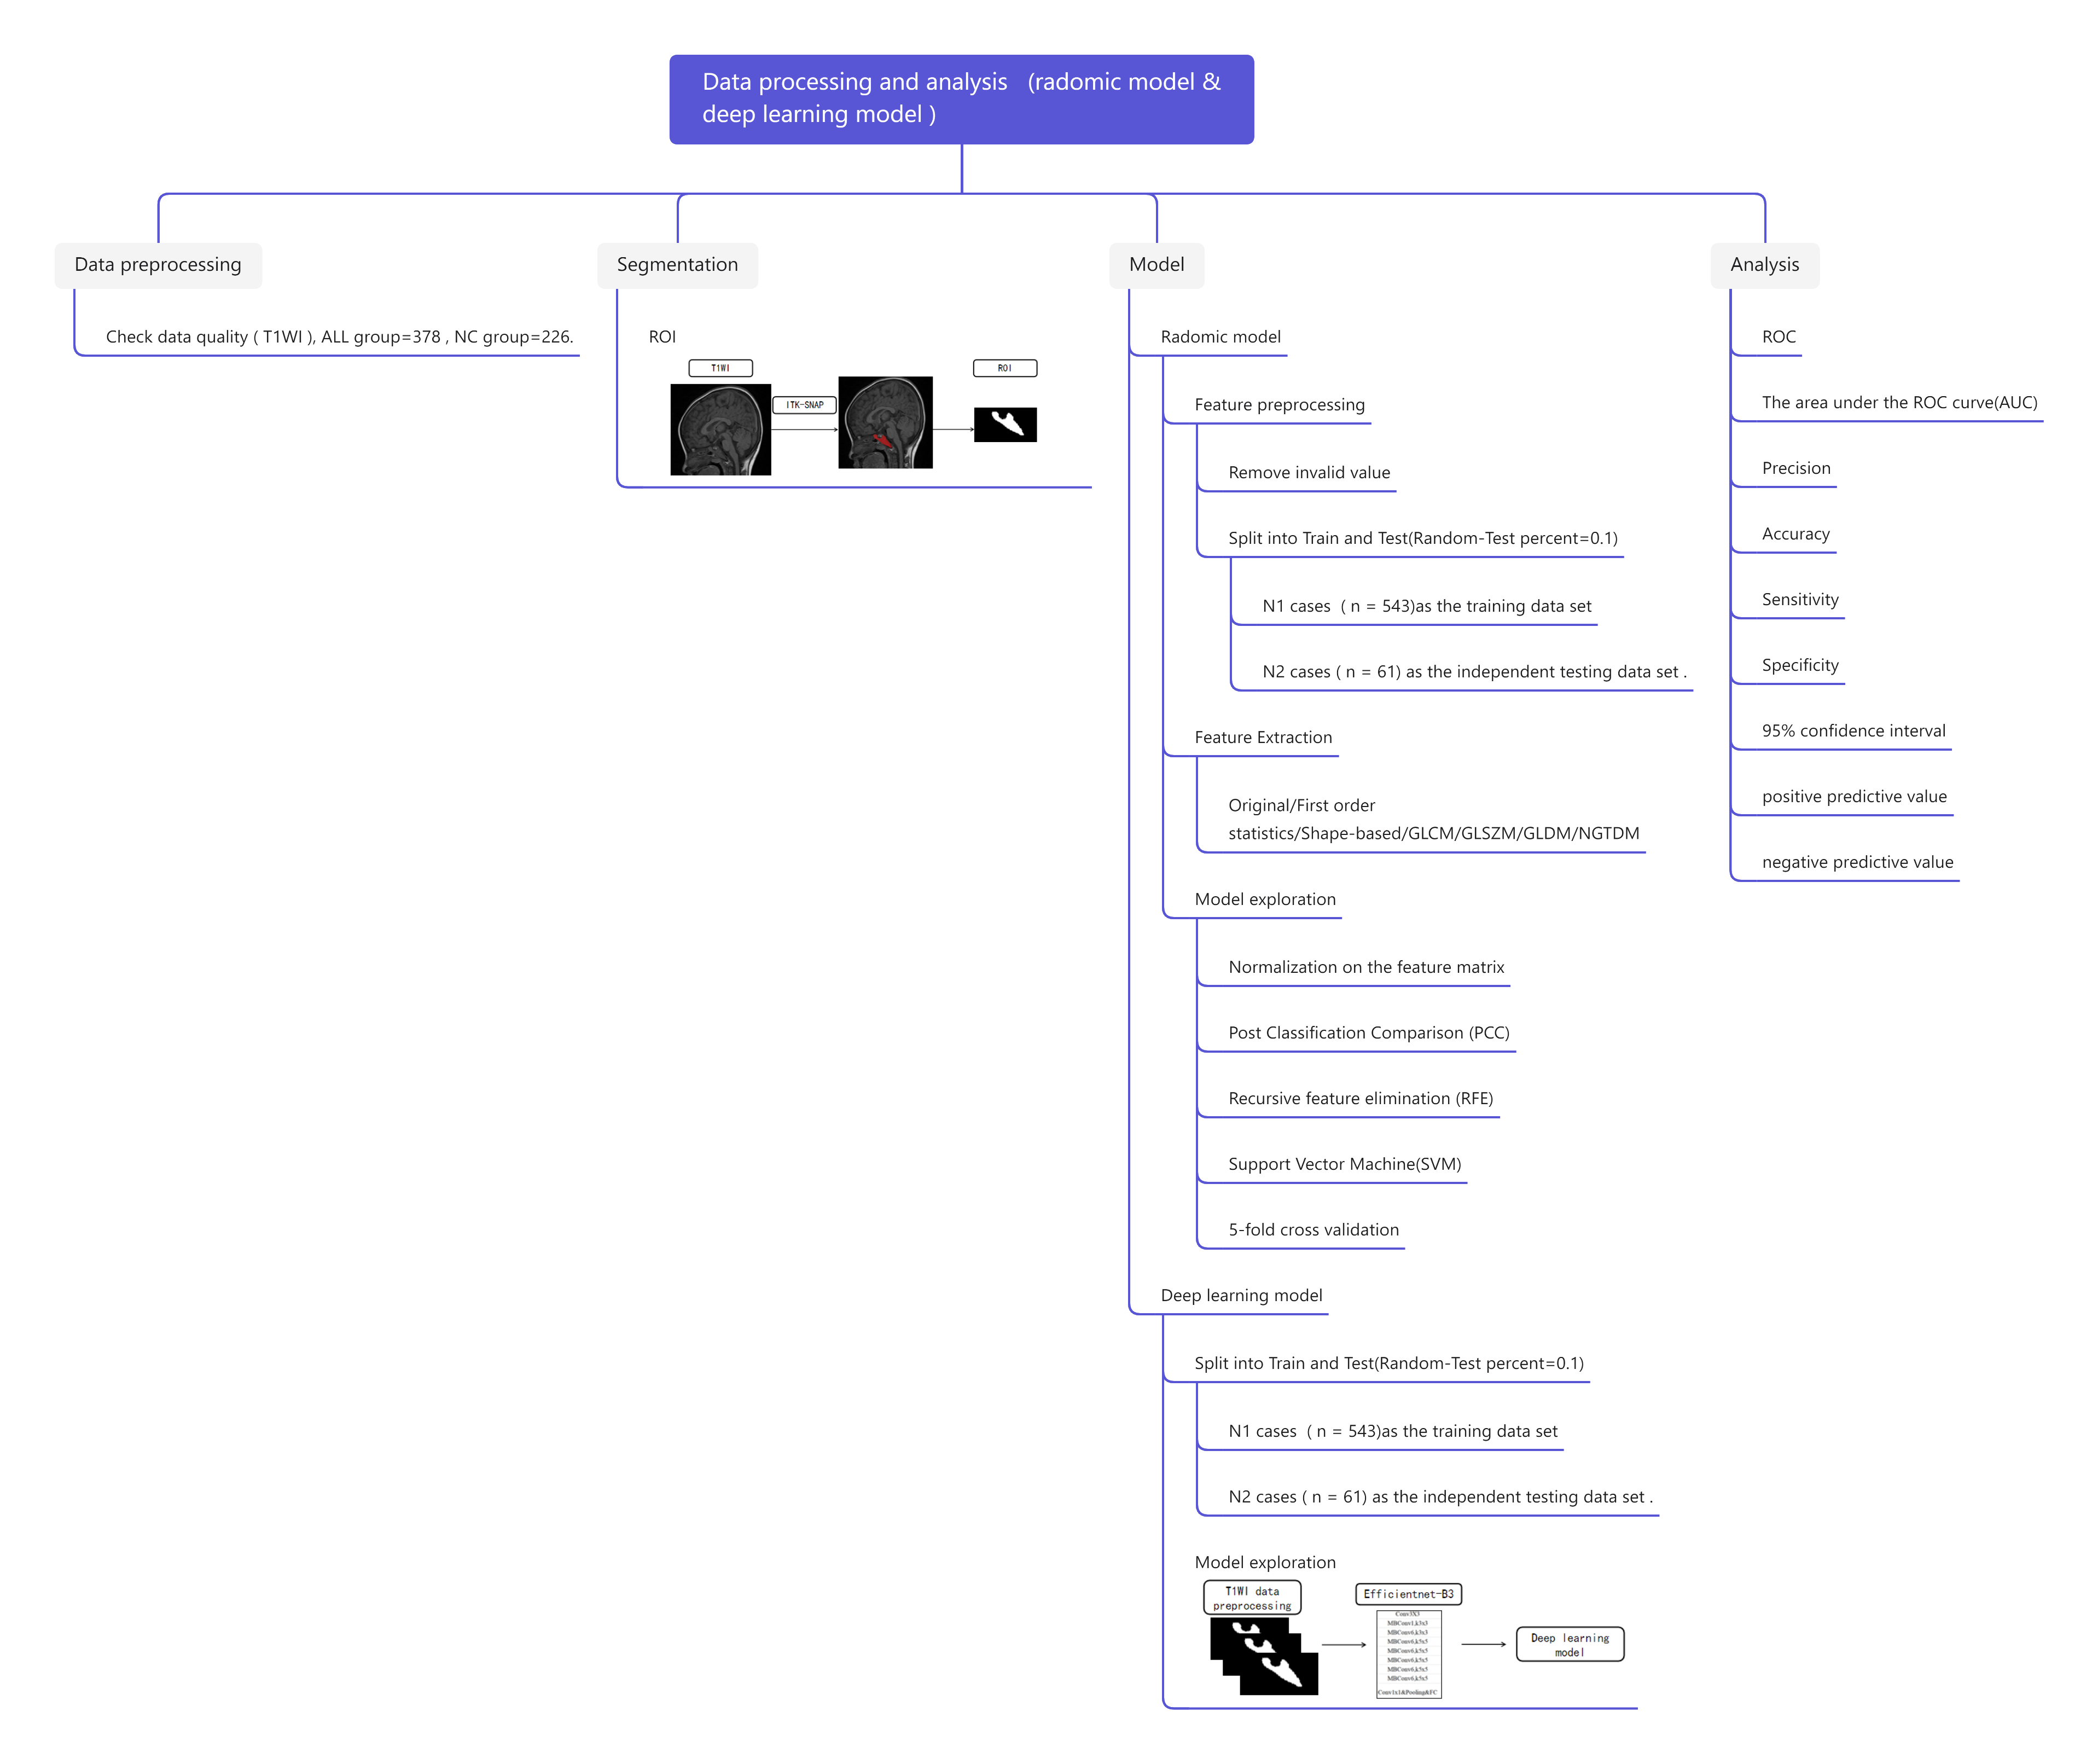
Figure 1. Data processing and analysis (radomics model & deep learning model)