5403
Incremental value of right ventricle function and T2* Mapping for judging the occurrence and development of cirrhotic cardiomyopathy in Rabbits1The Affiliated Hospital of Southwest Medical University, Luzhou, China, 2Philips Healthcare, Chengdu, China
Synopsis
This study analyzed the T2* mapping sequence and ventricular function parameters to assess cardiac injury in early cirrhotic cardiomyopathy (CCM) in a rabbit model. At the 2ed week, the ejection fraction (EF) of right ventricle (RV) decreased and the T2* value of 10th segment for LV increased significantly. The liver showed mild iron deposition at the 4th. T2* value of the 10th segment was negatively correlated with that of liver. Suggesting the iron deposition in CCM were not synchronous. Finding the T2* mapping combine right ventricle function for evaluating the occurrence and development of cardiac and liver injury with CCM.
Introduction
The morbidity and mortality rate of liver cirrhosis have increased year by year with the total worldwide death of 1.16 million every year [1]. Among them, about 25 – 70% of patients have developed heart related diseases during the progress of cirrhosis and following treatment. This kind of subclinical at rest and has clinical manifestations under stress is called cirrhotic cardiomyopathy (CCM) for this cardiac insufficiency without previous heart disease and finally leading to systolic and diastolic dysfunction and dysrhythmia.[2-5] Due to the lack of early clinical characteristics and effective diagnostic methods, the diagnosis of CCM is often missed or delayed.At present, the left ventricular ejection fraction (LVEF) and Longitudinal strain (GLS) are the standard dysfunction indexes for the diagnosis of CCM [6]. Except for early changes in the heart function, iron homeostasis in the myocardium are also an earlier initiated process that may lead to cardiomyocyte injury, and cardiac iron deficiency by itself mediates the development of cardiac dysfunction and morphological abnormalities[7]. This study therefore hypothesizes that iron deficiency may be a complementary monitoring indicator of CCM. Moreover, a series of studies demonstrated that patients with CCM have normal LV contractility with normal LVEF at rest, but significantly right ventricle (RV) expansion and hypertrophy which may be the result of increased preload[8-10], which may be expected to be a favorable indicator for CCM. This study established the rabbit model of cholestatic cirrhosis to monitoring the ocurrence and develpment of cardiac and liver damage using T2* mapping combined ventricular function, obtaining the early MRI time and MRI threshold parameters for diagnosing CCM.Methods
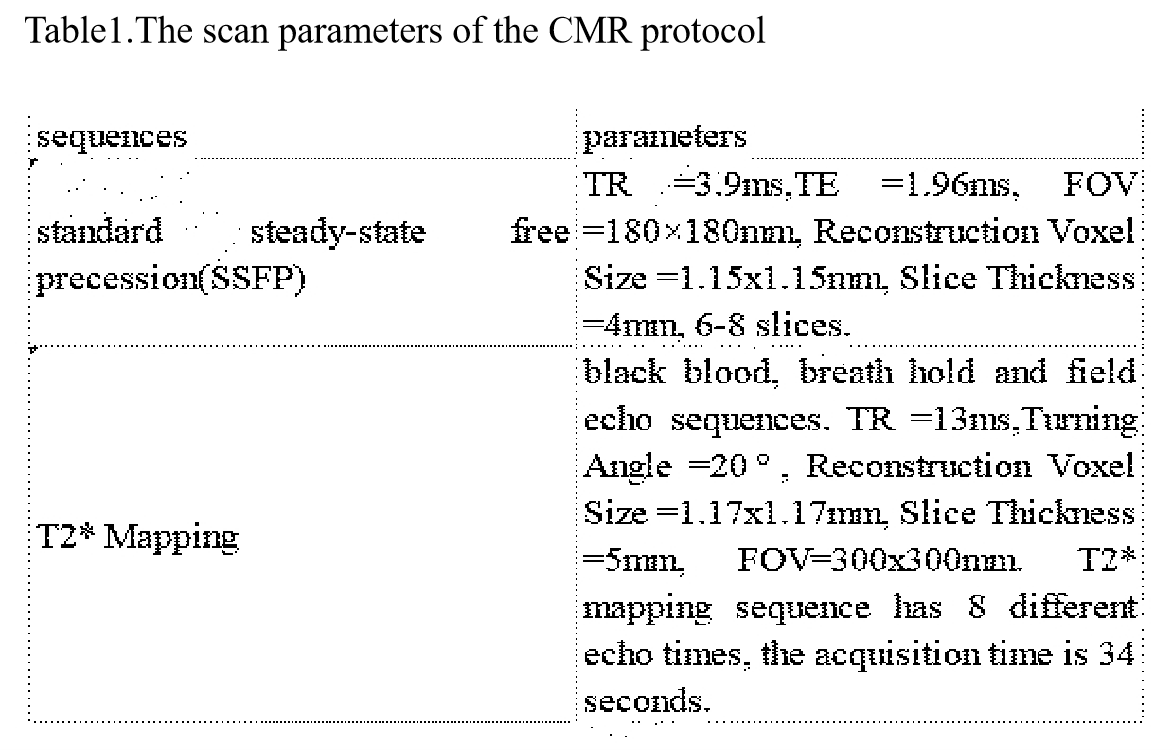
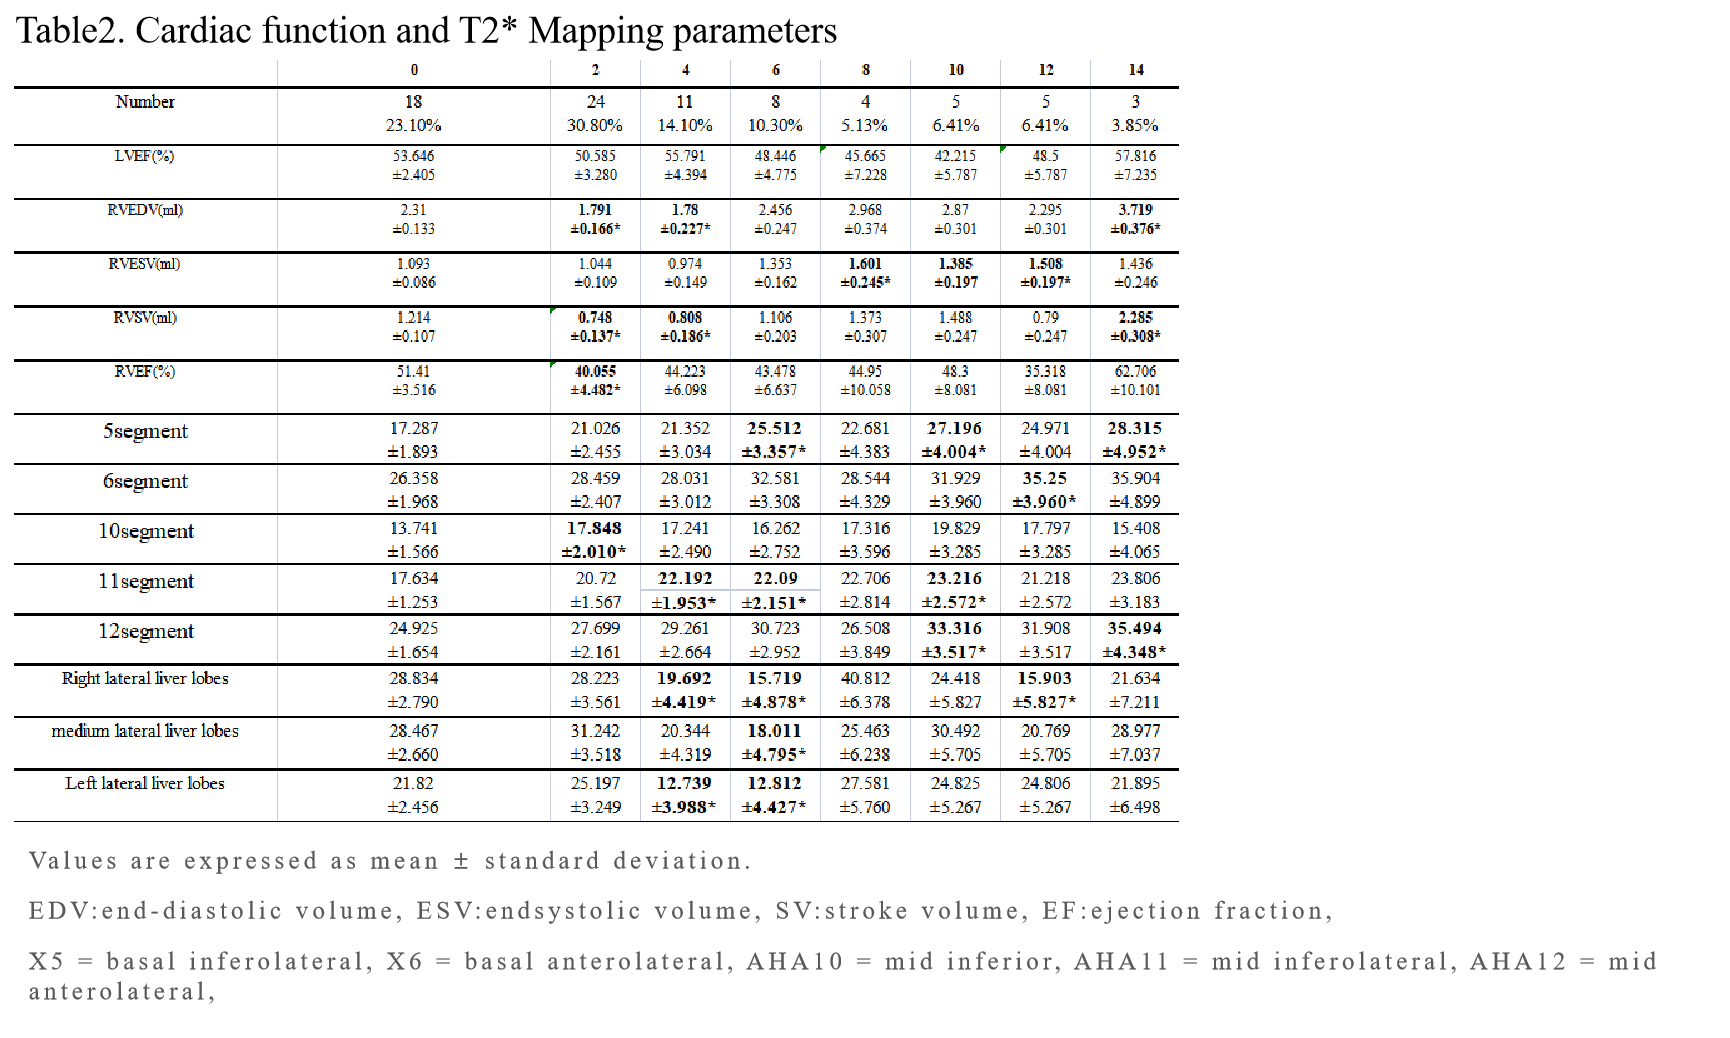
This study was conducted according to the principles of the Declaration of Helsinki. 30 New Zealand male rabbits (weight: 2.0-2.3kg) were recruited. All rabbits underwent 1.5T cardiac MR examination (Achieva, Philips Healthcare, Netherlands). The CMR protocol includes standard steady-state free precession (SSFP) and T2* mapping sequences with the scan parameters listed in Table 1.A baseline MRI scan was performed before operatio, and MRI scan was performed every two weeks after operation. After MRI scanning, 1-3 rabbits were randomly killed as pathological tissue reference of different groups. The rabbits were divided into 9 groups according to the cycle, including 0W (n=25), 2W (n=25), 4W (n=11), 6W (n=8), 8W (n=4), 10W (n=5), 12W (n=5), 14W (n=3). Then, Cardiac functional parameters, the T2* value of 16 segments of the left ventricle, the T2* value of liver parenchyma, and damaged state of myocardial cells were obtained. A mixed linear model and univariable and multivariable receiver operating characteristic (ROC) analysis were used to evaluated T2* mapping combined heart function, so as to obtain the earliest MRI diagnosis time of early cardiac injury for cirrhotic cardiomyopathy. Moreover, the correlation between liver and heart involvement was assessed to provide a one-stop non-invasive examination method T2* mapping of MRI for the follow-up and examination of patients with cirrhosis and cardiomyopathy.Results
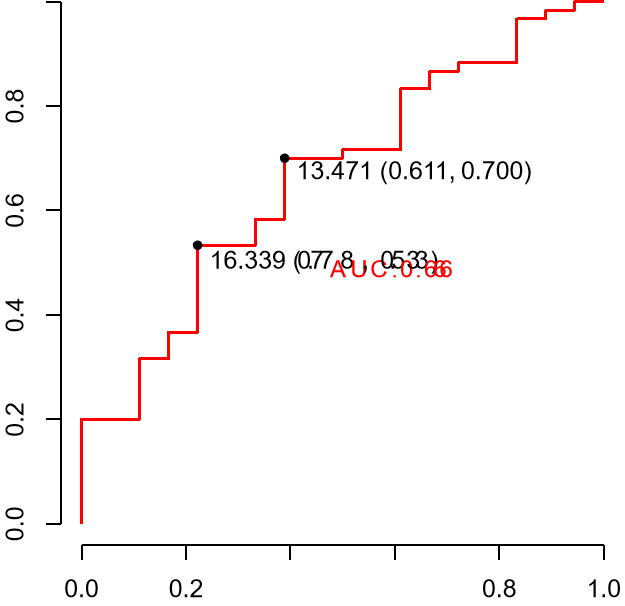
At the second mold week, the RVEF decreased significantly with more than 10% and the T2* value of 10th segment for LV increased significantly. Moreover, the T2* values of myocardial lateral wall (include the 5th、6th、11th、12th segment) showed a wide increase at 6-14 weeks. But the LVEF had no significant change (p<0.05). The cut-off T2* value for diagnosing CCM at 2th week was 13.471, which had the area under the curve (AUC) value of 0.666, sensitivity value of 0.700 and specificity value of 0.611. The T2* value of liver began to decrease at the 4th week(p<0.05), the left lateral liver lobes showed mild iron deposition at the 4th, 6th week and the iron deposition in heart and liver in cirrhotic cardiomyopathy were not synchronous. T2* value of the 10th segment was negatively correlated with that of liver (r=-0.234,p<0.05). There is a positive correlation between RVEDV and the T2* values of liver (P<0.05, r=0.255). There is a negatively correlation between the 10th segment of T2* values and cardiac function parameters, especially LVEDV (P<0.01, r=-0.363), LVESV(P<0.05, r=-0.272), RVEDV(P<0.05, r=-0.249).Conclusions
RVEF combined with T2* mapping of the 10th segment has some value in early CCM. Then,the iron content of left ventricluar myocardial lateral wall kept decreasing with the CCM disease progressed, suggesting that the T2* mapping is still sensitive in monitoring the progression of CCM. The left lateral liver lobes showed mild iron deposition. The iron deposition in heart and liver in cirrhotic cardiomyopathy were not synchronous.Acknowledgements
No acknowledgement found.References
[1] Mokdad AA, Lopez AD, Shahraz S, et al. Liver cirrhosis mortality in 187 countries between 1980 and 2010: a systematic analysis. BMC Med. 2014. 12: 145.
[2] Kim HM, Kim HK, Lee JH, et al. Myocardial structural and functional changes in patients with liver cirrhosis awaiting liver transplantation: a comprehensive cardiovascular magnetic resonance and echocardiographic study. J Cardiovasc Magn Reson. 2020. 22(1): 25.
[3] Iwakiri Y, Groszmann RJ. The hyperdynamic circulation of chronic liver diseases: from the patient to the molecule. Hepatology. 2006. 43(2 Suppl 1): S121-31.
[4] KOWALSKI HJ, ABELMANN WH. The cardiac output at rest in Laennec's cirrhosis. J Clin Invest. 1953. 32(10): 1025-33.
[5] Schrier RW, Arroyo V, Bernardi M, Epstein M, Henriksen JH, Rodés J. Peripheral arterial vasodilation hypothesis: a proposal for the initiation of renal sodium and water retention in cirrhosis. Hepatology. 1988. 8(5): 1151-7.
[6] Merli M, Torromeo C, Giusto M, Iacovone G, Riggio O, Puddu PE. Survival at 2 years among liver cirrhotic patients is influenced by left atrial volume and left ventricular mass. Liver Int. 2017. 37(5): 700-706.
[7] Nagao M, Matsuo Y, Kamitani T, et al. Quantification of myocardial iron deficiency in nonischemic heart failure by cardiac T2* magnetic resonance imaging. Am J Cardiol. 2014. 113(6): 1024-30.
[8] Valeriano V, Funaro S, Lionetti R, et al. Modification of cardiac function in cirrhotic patients with and without ascites. Am J Gastroenterol. 2000. 95(11): 3200-5.
[9] Günay N, Erdem Ş, Güvenç TS, et al. Morphologic and Functional Changes in Right-Sided Cardiac Chambers in Patients With Chronic Liver Disease and Normal Pulmonary Artery Pressure. J Ultrasound Med. 2018. 37(7): 1681-1691.
[10] Wasemiller S, Earle T, Kashner M, Foster G, Silvet H. Right Ventricular Ejection Fraction in Ischemic Versus Nonischemic Cardiomyopathy. Am J Cardiol. 2016. 117(2): 278-81.
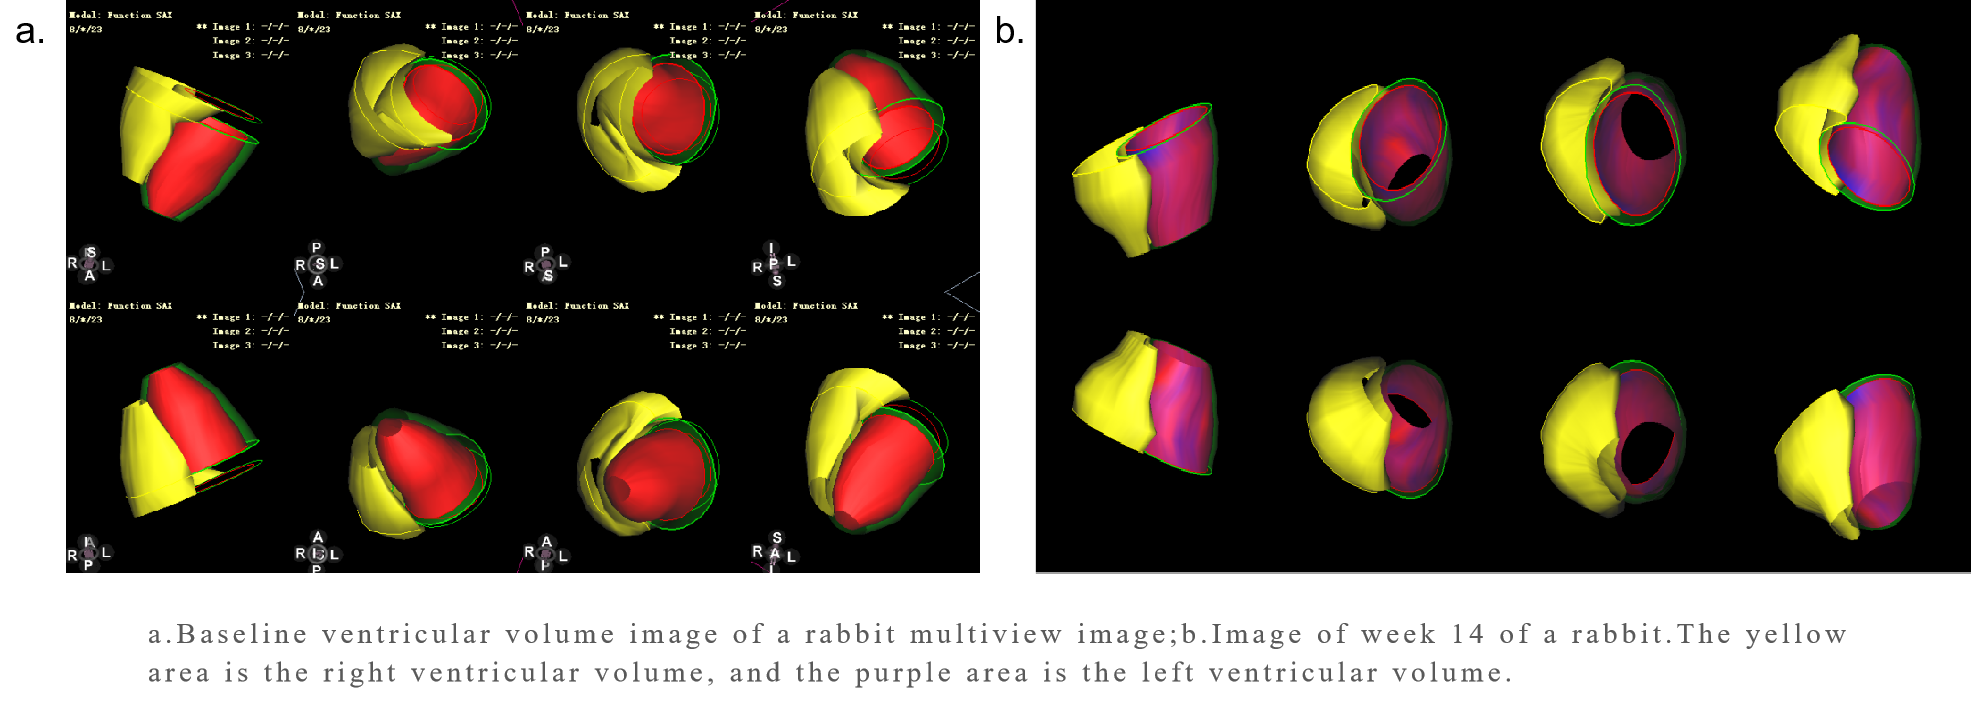
Figures