5401
Magnetic Resonance Imaging as a Prognostic Disability biomarker in C Multiple Sclerosis: A Systematic Review and Meta-Analysis
Amjad Ibrahim Altokhis1, Abrar Alamrani2, Abdulmajeed Alotaibi3, Anna Podlasek4, and Amjad Altokhis5
1Clinical Neurology, University of Nottingham, Nottingham, United Kingdom, 2Faculty of Health, York University, Toronto, ON, Canada, 3University of Nottingham, Nottingham, United Kingdom, 4anna.podlasek@nottingham.ac.uk, Nottingham, United Kingdom, 5Clinical Neurology, University of nottingham, Nottingham, United Kingdom
1Clinical Neurology, University of Nottingham, Nottingham, United Kingdom, 2Faculty of Health, York University, Toronto, ON, Canada, 3University of Nottingham, Nottingham, United Kingdom, 4anna.podlasek@nottingham.ac.uk, Nottingham, United Kingdom, 5Clinical Neurology, University of nottingham, Nottingham, United Kingdom
Synopsis
Imaging biomarker for disability in Multiple Sclerosis
Abstract
To date, there are no definite imaging predictors for long-term disability in multiple sclerosis (MS). Magnetic resonance imaging (MRI) is the key prognostic tool for MS, primarily at the early stage of the disease. Recent findings showed that white matter lesion (WML) counts and volumes could predict long-term disability for MS. However, the prognostic value of MRI in the early stage of the disease and its link to long-term physical disability have not been assessed systematically and quantitatively. A meta-analysis was conducted using studies from four databases to assess whether MS lesion counts and volumes at baseline MRI scans could predict long-term disability, assessed by the expanded disability status scale (EDSS). Fifteen studies were eligible for the qualitative analysis and three studies for meta-analysis. T2 brain lesion counts and volumes after the disease onset were associated with disability progression after 10 years. Four or more lesions at baseline showed a highly significant association with EDSS 3 and EDSS 6, with a pooled OR of 4.10 and 4.3, respectively. The risk increased when more than 10 lesions were present. This review and meta-analysis confirmed that lesion counts and volumes could be associated with disability and might offer additional valid guidance in treatment decision-making. Future work is essential to determine whether these prognostic markers have high predictive potential.Acknowledgements
No acknowledgement found.References
1. MAGNIMS consensus guidelines on the use of MRI in multiple sclerosis—establishing disease prognosis and monitoring patients. Nat Rev Neurol. 2015;11(10):597–606.
2. Heesen C, Kasper J, Segal J, Köpke S, Mühlhauser I. Decisional role preferences, risk knowledge and information interests in patients with multiple sclerosis. Mult Scler. 2004 Dec;10(6):643–50.
3. Brand J, Köpke S, Kasper J, Rahn A, Backhus I, Poettgen J, et al. Magnetic Resonance Imaging in Multiple Sclerosis – Patients’ Experiences, Information Interests and Responses to an Educ
4. Smith D, Gaillard F. Multiple sclerosis. Radiopaedia.org [Internet]. 2008 May 2; Available from: http://radiopaedia.org/articles/1700
Figures
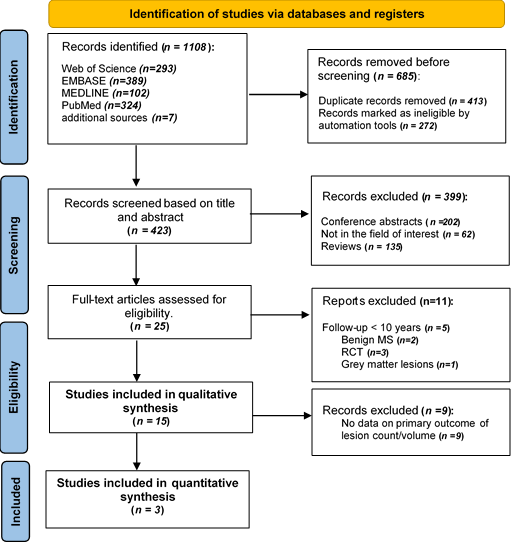
RISMA flow diagram, illustrating the systematic search strategy and study selection. 3.2. Cohort Description
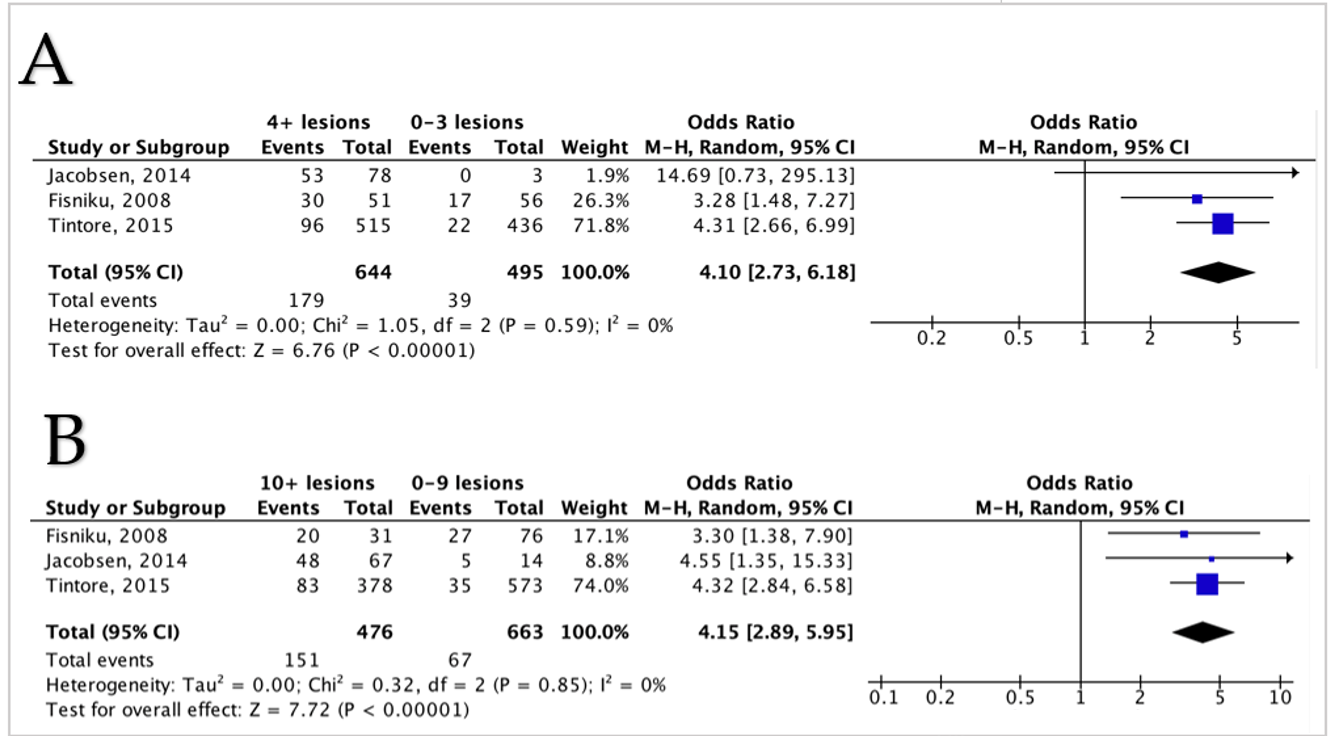
Figure 2. Forest plot demonstrating the odds of EDSS 3 with comparisons between different lesion counts (A,B); (A) a comparison between 0–3 lesions versus 4 or more lesions, (B) a comparison between lesions of 0–9 lesions versus 10 or more lesions. CI = confidence interval, I2 = heterogeneity index, df = degree of freedom.
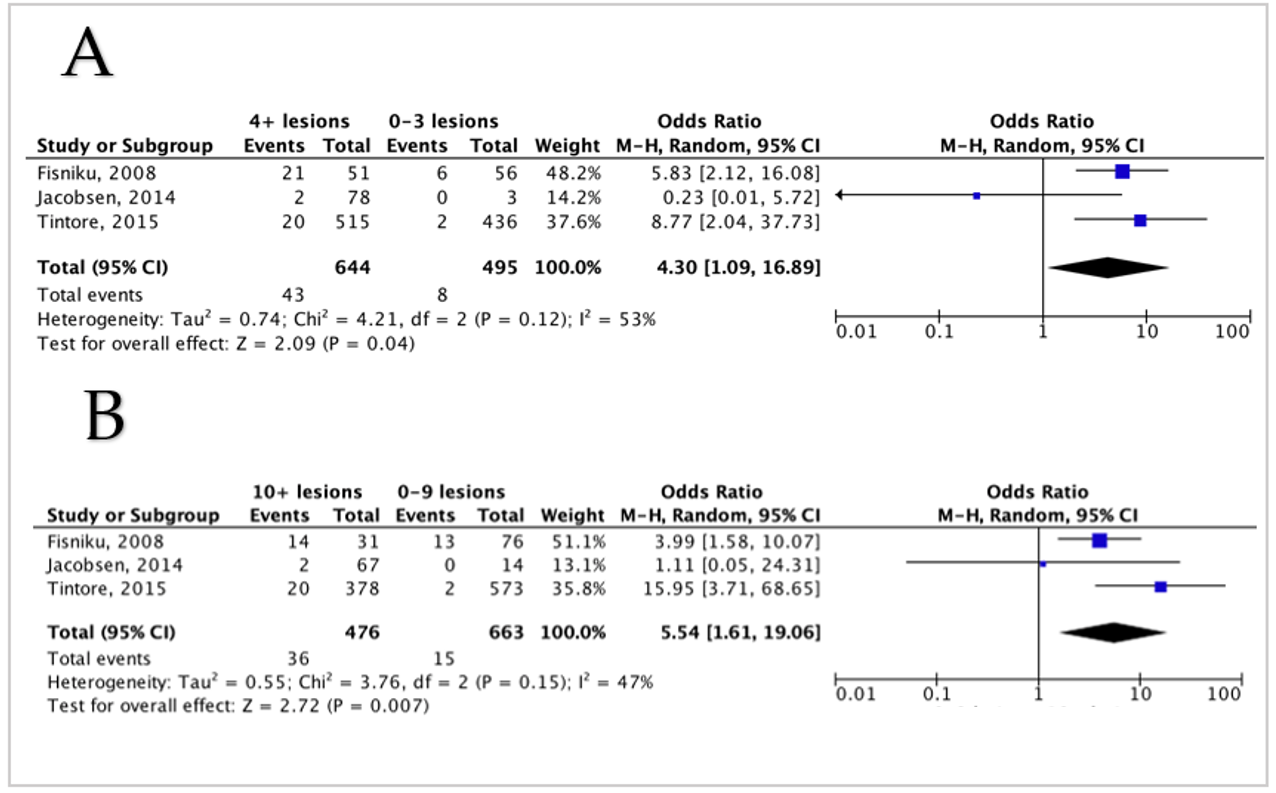
Figure 3. Forest plot demonstrating the odds of EDSS 6 with comparisons between different lesion counts (A,B); (A) a comparison between 0–3 lesions versus 4 or more lesions, (B) a comparison between lesions of 0–9 lesions versus 10 or more lesions. CI = confidence interval, I2 = heterogeneity index, df = degree of freedom.
DOI: https://doi.org/10.58530/2023/5401