5396
Predictors of long-term disability in MS patients using routine MRI data: a 15-year retrospective study1Clinical Neurology, University of Nottingham, Nottingham, United Kingdom, 2University of Nottingham, Nottingham, United Kingdom, 3University of nottingham, Nottingham, United Kingdom
Synopsis
MRI disability predictors in Multiple Sclerosis using routine MRI data: a 15-year longtudinal study
Introduction
Early identification of patients at high risk of progression could help with a personalised treatment strategy. Magnetic Resonance Imaging (MRI) measures have been proposed to predict long-term disability in Multiple Sclerosis (MS), but a reliable predictor that can be easily implemented clinically is still needed.Aim
Assess MRI measures during the first 5 years of the MS disease course for the ability to predict progression at 10+ years.Methods
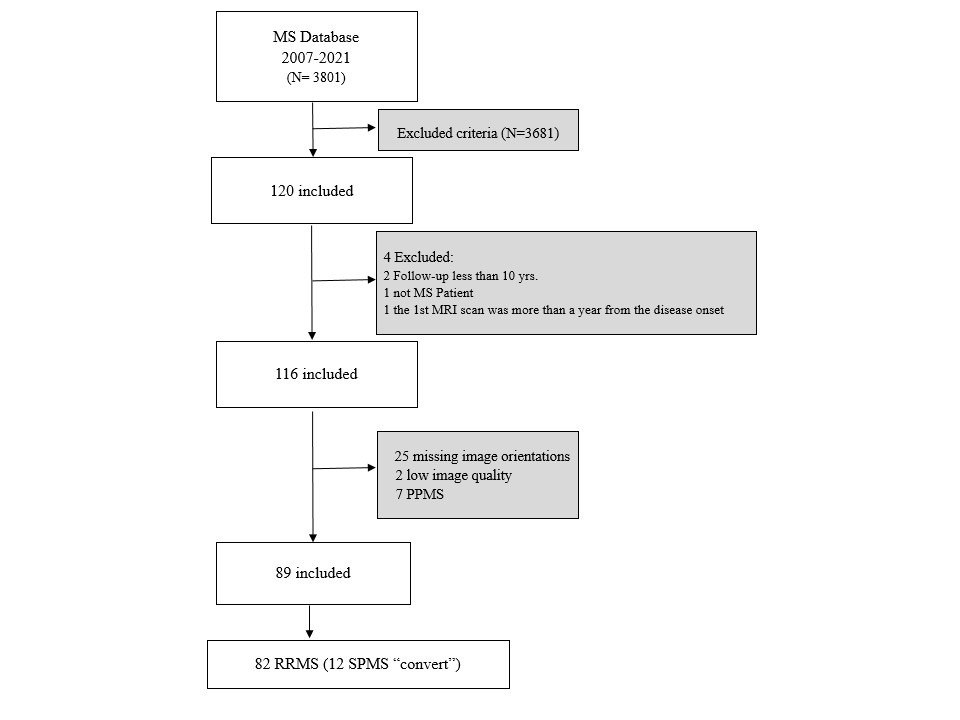
Eighty-two MS patients (53 females), with ≥10 years of clinical follow-up and having two MRI scans, were included. Clinical data were obtained at baseline, follow-up and at ≥10 years. White Matter Lesion (WML) counts and volumes, and four linear brain sizes were measured on T2/FLAIR “Fluid-Attenuated-Inversion-Recovery” and T1-weighted images.Results
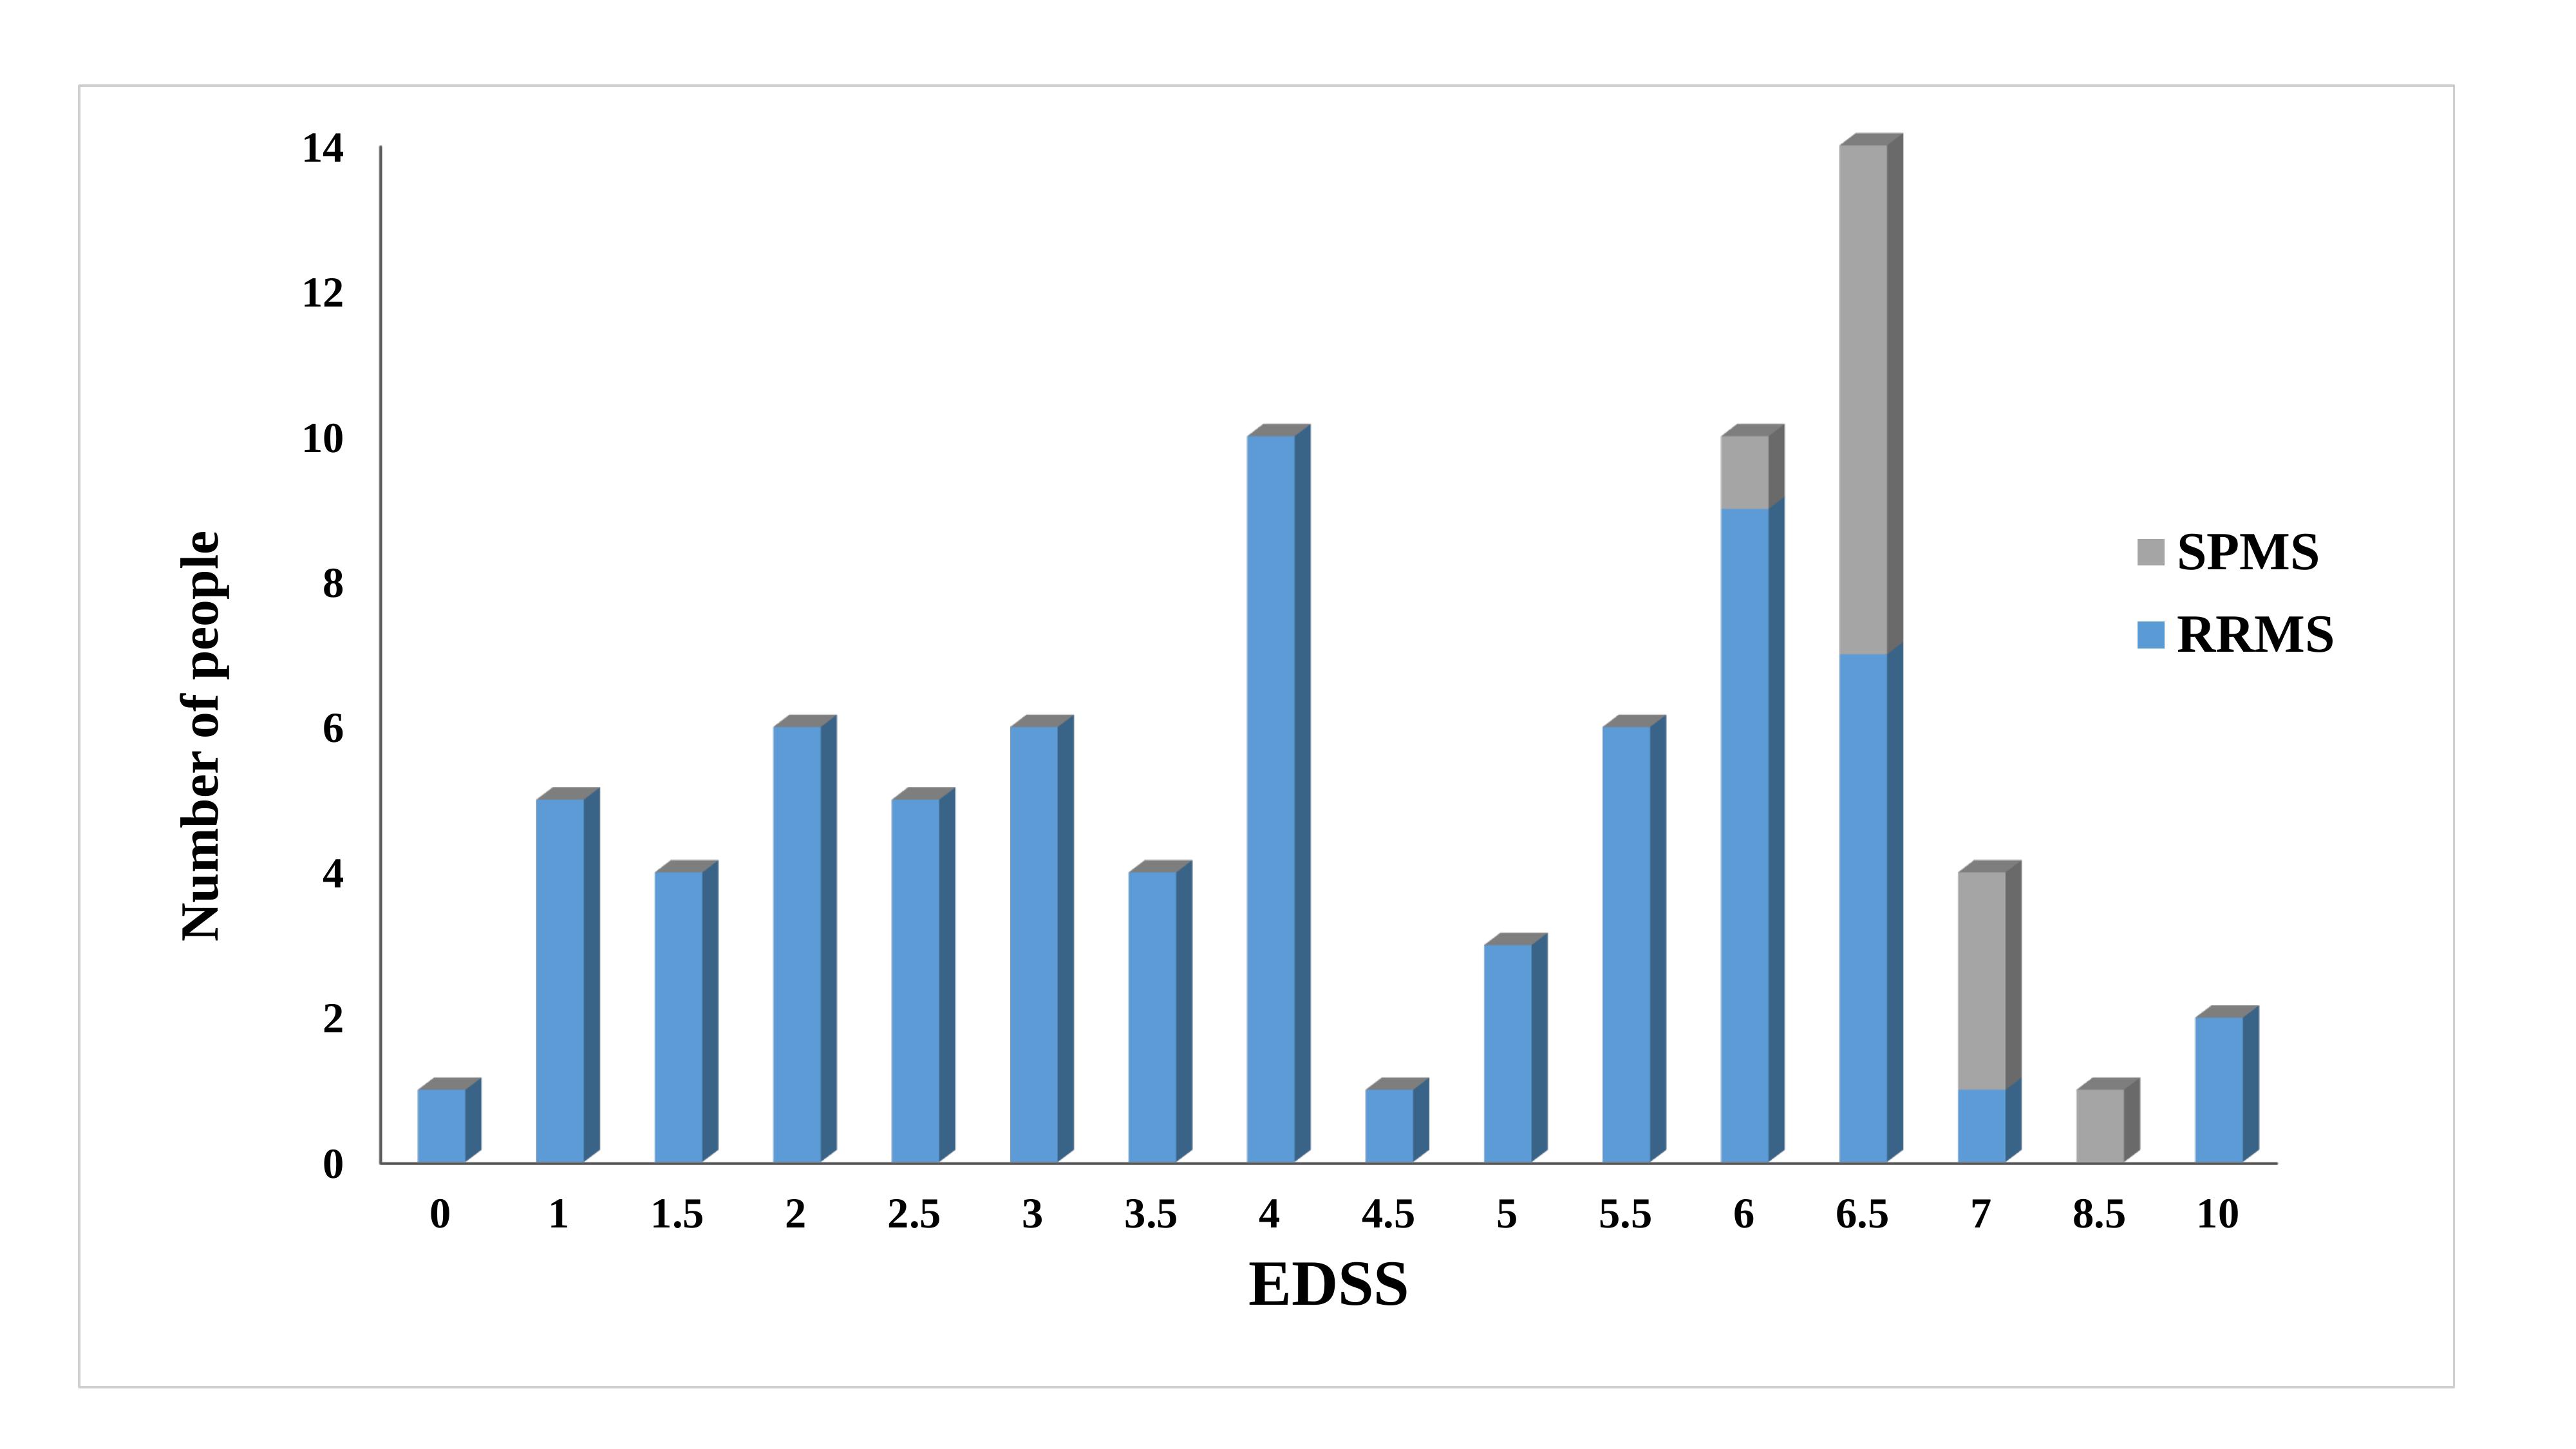
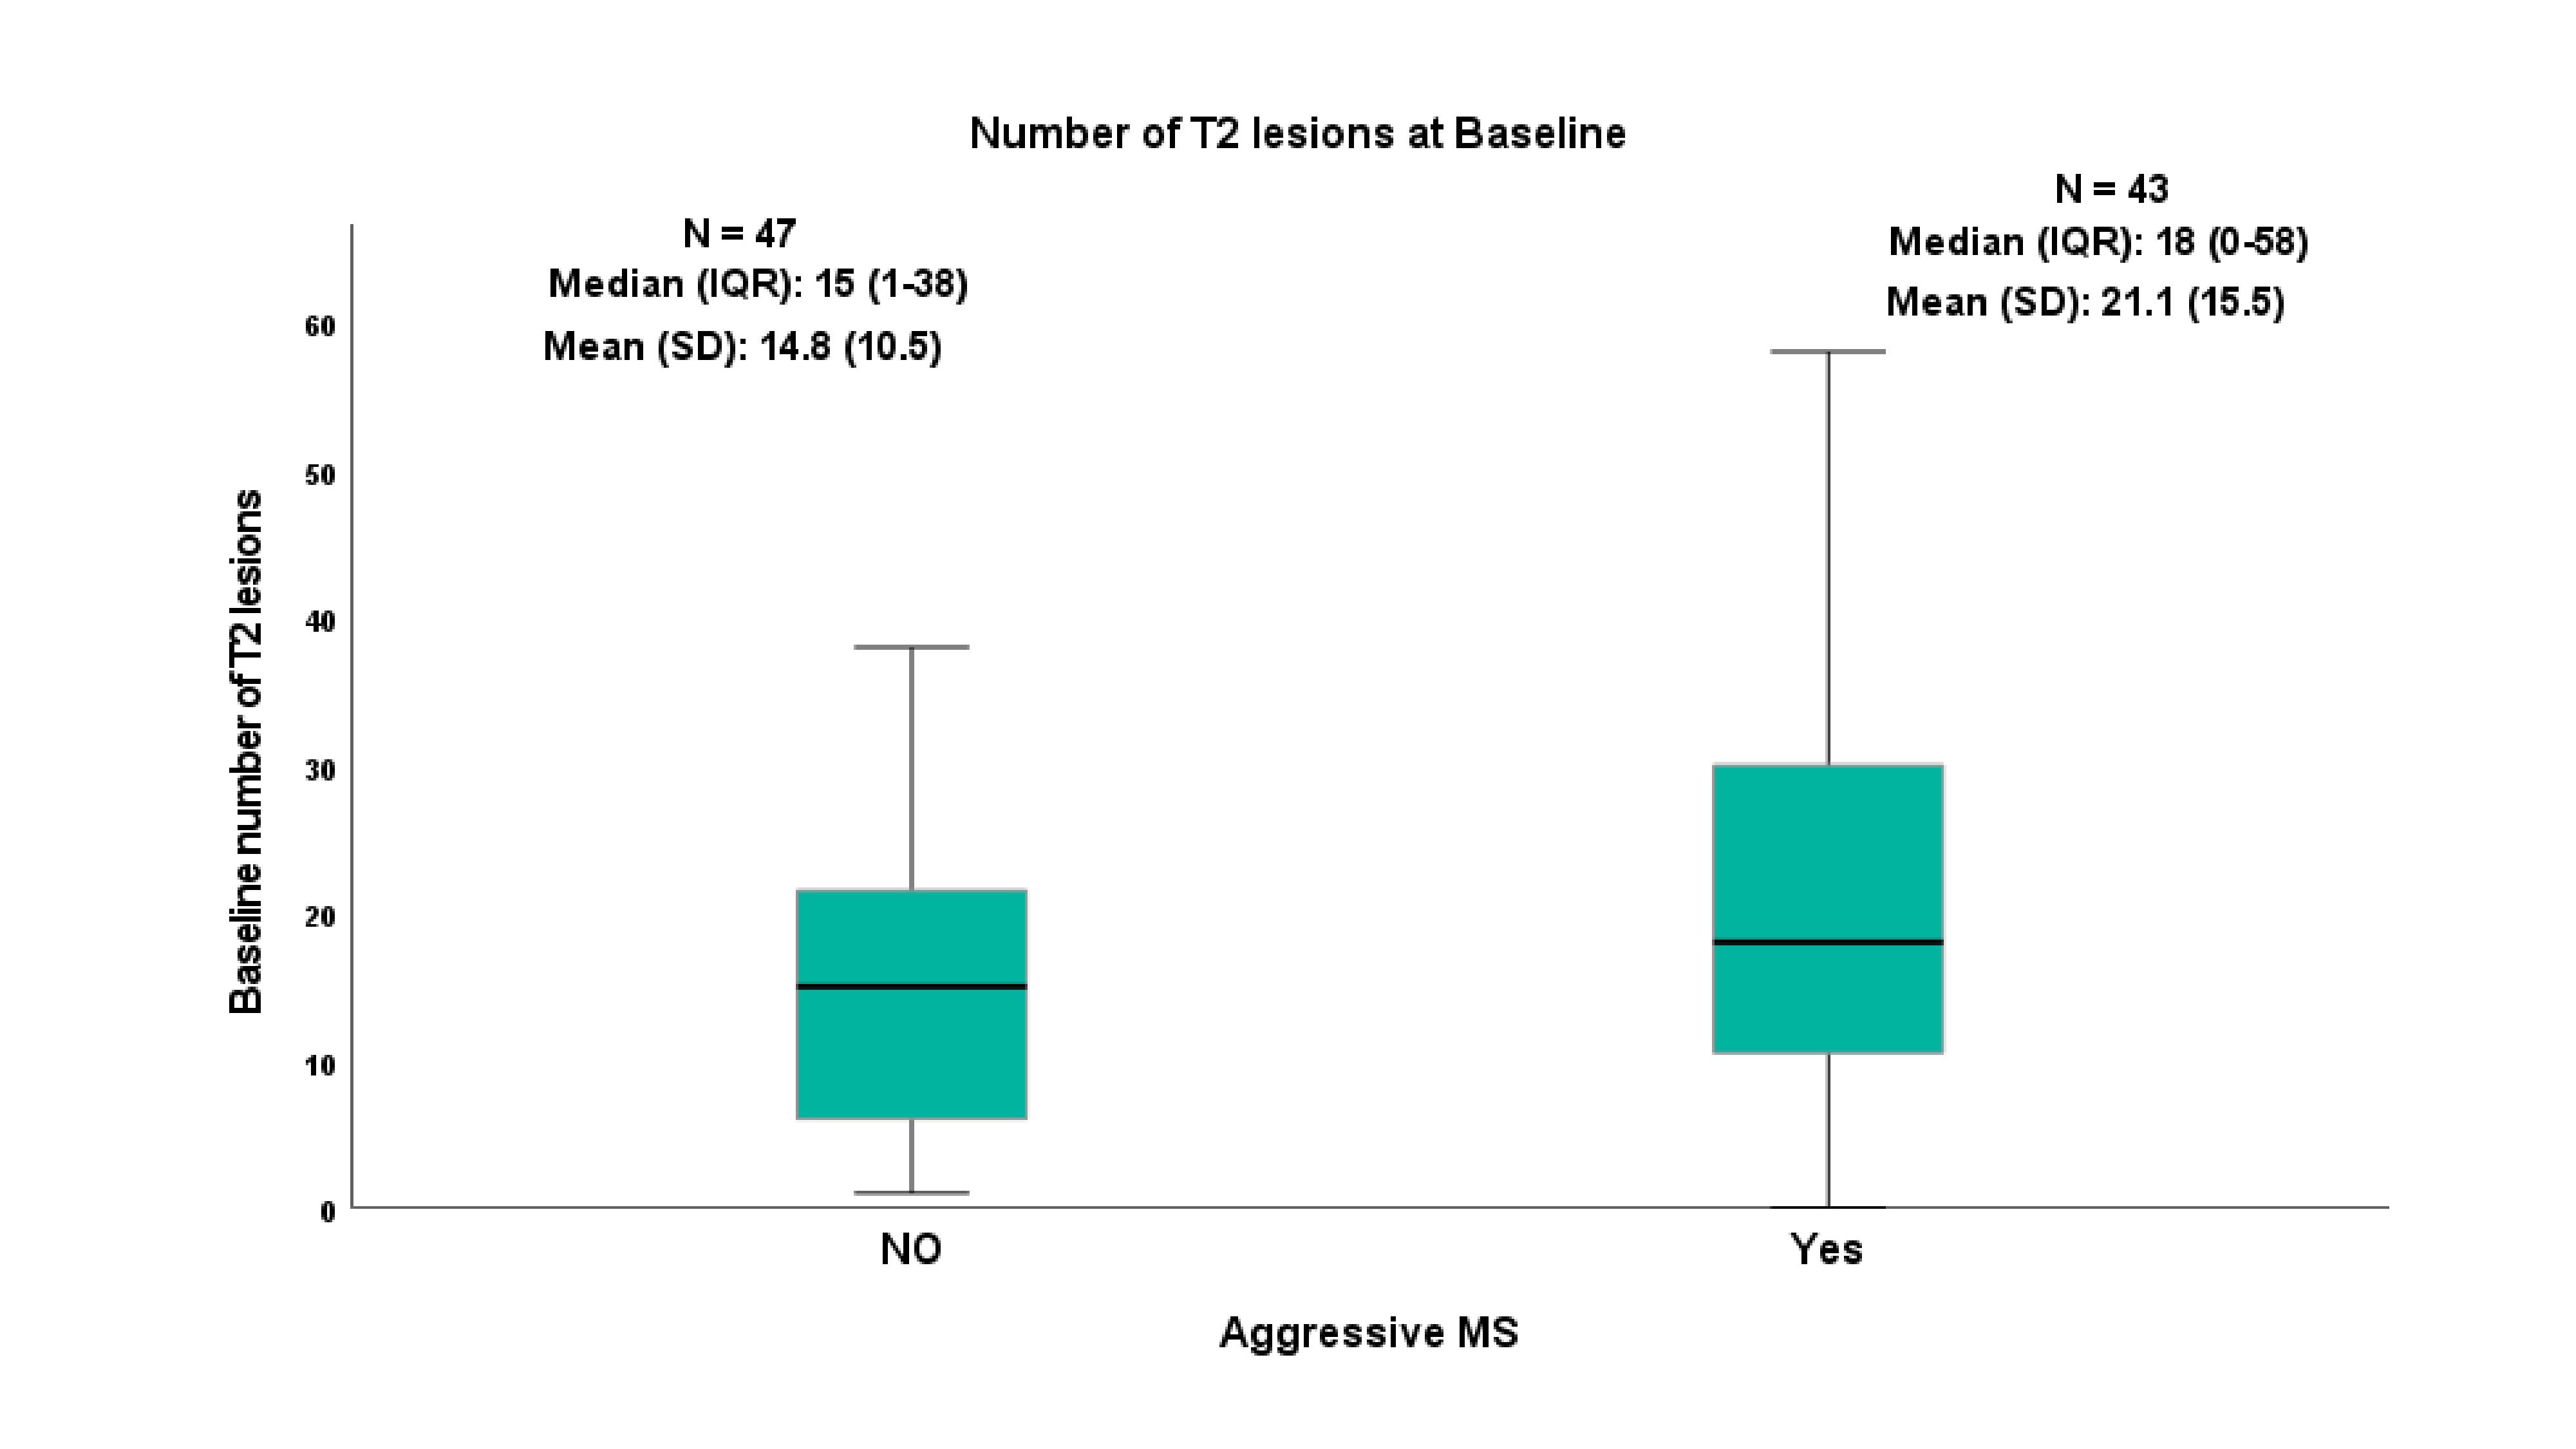
Baseline and follow-up Inter-Caudate-Diameter (ICD) and Third-Ventricular-Width (TVW) measures correlated positively with Expanded Disability Status Scale (EDSS), ≥10 or more of WMLs showed a high sensitivity in predicting progression, at ≥10 years. A steeper rate of lesion volume increase was observed in subjects converting to Secondary-Progressive MS. The sensitivity and specificity of both ICD and TVW, to predict disability at ≥10 years were 60% and 64% respectively.Conclusion
Despite advances in brain imaging and computerised volumetric analysis, ICD and TVW remain relevant as they are simple, fast and have the potential in predicting long-term disability. However, in this study, despite the statistical significance of these measures, the clinical utility is still not reliable.Acknowledgements
We thank Andre Venn and Anna Podlasek, Medical Statisticians at the University of Nottingham for their advice on statistical analysis. Thanks to Anwar A. Sayed for his support and feedback. This work was supported in part by Nottingham University Hospital and Princess Nourah bint Abdulrahman University for Health and Rehabilitation Sciences in Saudi Arabia.References
1. Fisniku LK, Brex PA, Altmann DR, et al. Disability and T2 MRI lesions: a 20-year follow-up of patients with relapse onset of multiple sclerosis. Brain. 2008;131(3):808-817. doi:10.1093/brain/awm329
2.Tintore M, Arrambide G, Otero-Romero S, et al. The long-term outcomes of CIS patients in the Barcelona inception cohort: Looking back to recognize aggressive MS. Multiple Sclerosis Journal. 2020;26(13):1658-1669. doi:10.1177/1352458519877810
3. Pontillo G, Cocozza S, Di Stasi M, et al. 2D linear measures of ventricular enlargement may be relevant markers of brain atrophy and long-term disability progression in multiple sclerosis. European Radiology. 2020;30(7):3813-3822. doi:10.1007/s00330-020-06738-4
4. Cappelle S, Pareto D, Tintoré M, et al. A validation study of manual atrophy measures in patients with Multiple Sclerosis. Neuroradiology. 2020;62(8):955-964. doi:10.1007/s00234-020-02401-3
5. Pittock S, Mayr W, McClelland R, et al. Change in MS-related disability in a population-based cohort: a 10-year follow-up study. Neurology. 2004;62(1):51-59. doi:10.1212/01.WNL.0000101724.93433.00
6. Dalton C, Brex P, Jenkins R, et al. Progressive ventricular enlargement in patients with clinically isolated syndromes is associated with the early development of multiple sclerosis. Journal of neurology, neurosurgery, and psychiatry. 2002;73(2):141-147. doi:10.1136/JNNP.73.2.141
7. Filippi M, Brück W, Chard D, et al. Association between pathological and MRI findings in multiple sclerosis. The Lancet Neurology. 2019;18(2):198-210. doi:10.1016/S1474-4422%2818%2930451-4 sclerosis and clinically isolated syndromes: A 30-year follow-up. Journal of Neurology, Neurosurgery and Psychiatry. 2021;27(8):1-8. doi:10.1136/jnnp-2020-325421
8. Rush C, MacLean H, Freedman M. Aggressive multiple sclerosis: proposed definition and treatment algorithm. Nature reviews Neurology. 2015;11(7):379-389. doi:10.1038/NRNEUROL.2015.85
9. Kunchok A, Lechner-Scott J, Granella F, et al. Prediction of on-treatment disability worsening in RRMS with the MAGNIMS score. Multiple sclerosis (Houndmills, Basingstoke, England). 2021;27(5):695-705. doi:10.1177/1352458520936823
10. Ng CF, Remli R, Tan HJ. Longitudinally Extensive Transverse Myelitis in Highly Active Relapsing-remitting Multiple Sclerosis. Neurology India. 2021;69(5):1412-1413. doi:10.4103/0028-3886.329533
Figures