5395
Evaluation of T1 relaxation time measurement using magnetic resonance spectroscopy unobstructed by the presence of fat: A liver phantom study.1Department of Radiological technology, Kurume University Hospital, Kurume, Japan, 2Department of Radiological Technology, Faculty of Medical Technology, Teikyo University, Tokyo, Japan, 3Department of Radiology, Kurume University School of Medicine, Kurume, Japan
Synopsis
We investigated the usefulness of magnetic resonance spectroscopy (MRS) for water T1 relaxation time independent on the presence of fat in the liver phantom. Then,T1 relaxation time measurements were performed using inversion recovery-spin echo, modified look locker, variable flip angle, and MRS on a 3T-MRI system. T1 relaxation time measurement by the MRS water signal is less affected by the presence of fat and more accurate than the other methods. This technique does not use special research sequences and can be realized on clinical MRI scanner where MRS can be performed.
Purpose
The T1 relaxation time of the liver comparing precontrast and postcontrast of gadoxetic acid administration can be a good predictor of hepatic fibrosis (1,2). There are various methods for measuring T1 relaxation time; however, fat deposition can affect the T1 relaxation time in the liver(3,4). There are reports of measuring T1 relaxation time in water without the influence of fat, but it is cannot be used in a clinical MRI scanner (5-7). Therefore, using a clinical MRI scanner, we investigated the usefulness of magnetic resonance spectroscopy (MRS) for water T1 relaxation time independent on the presence of fat in the liver phantom.Methods
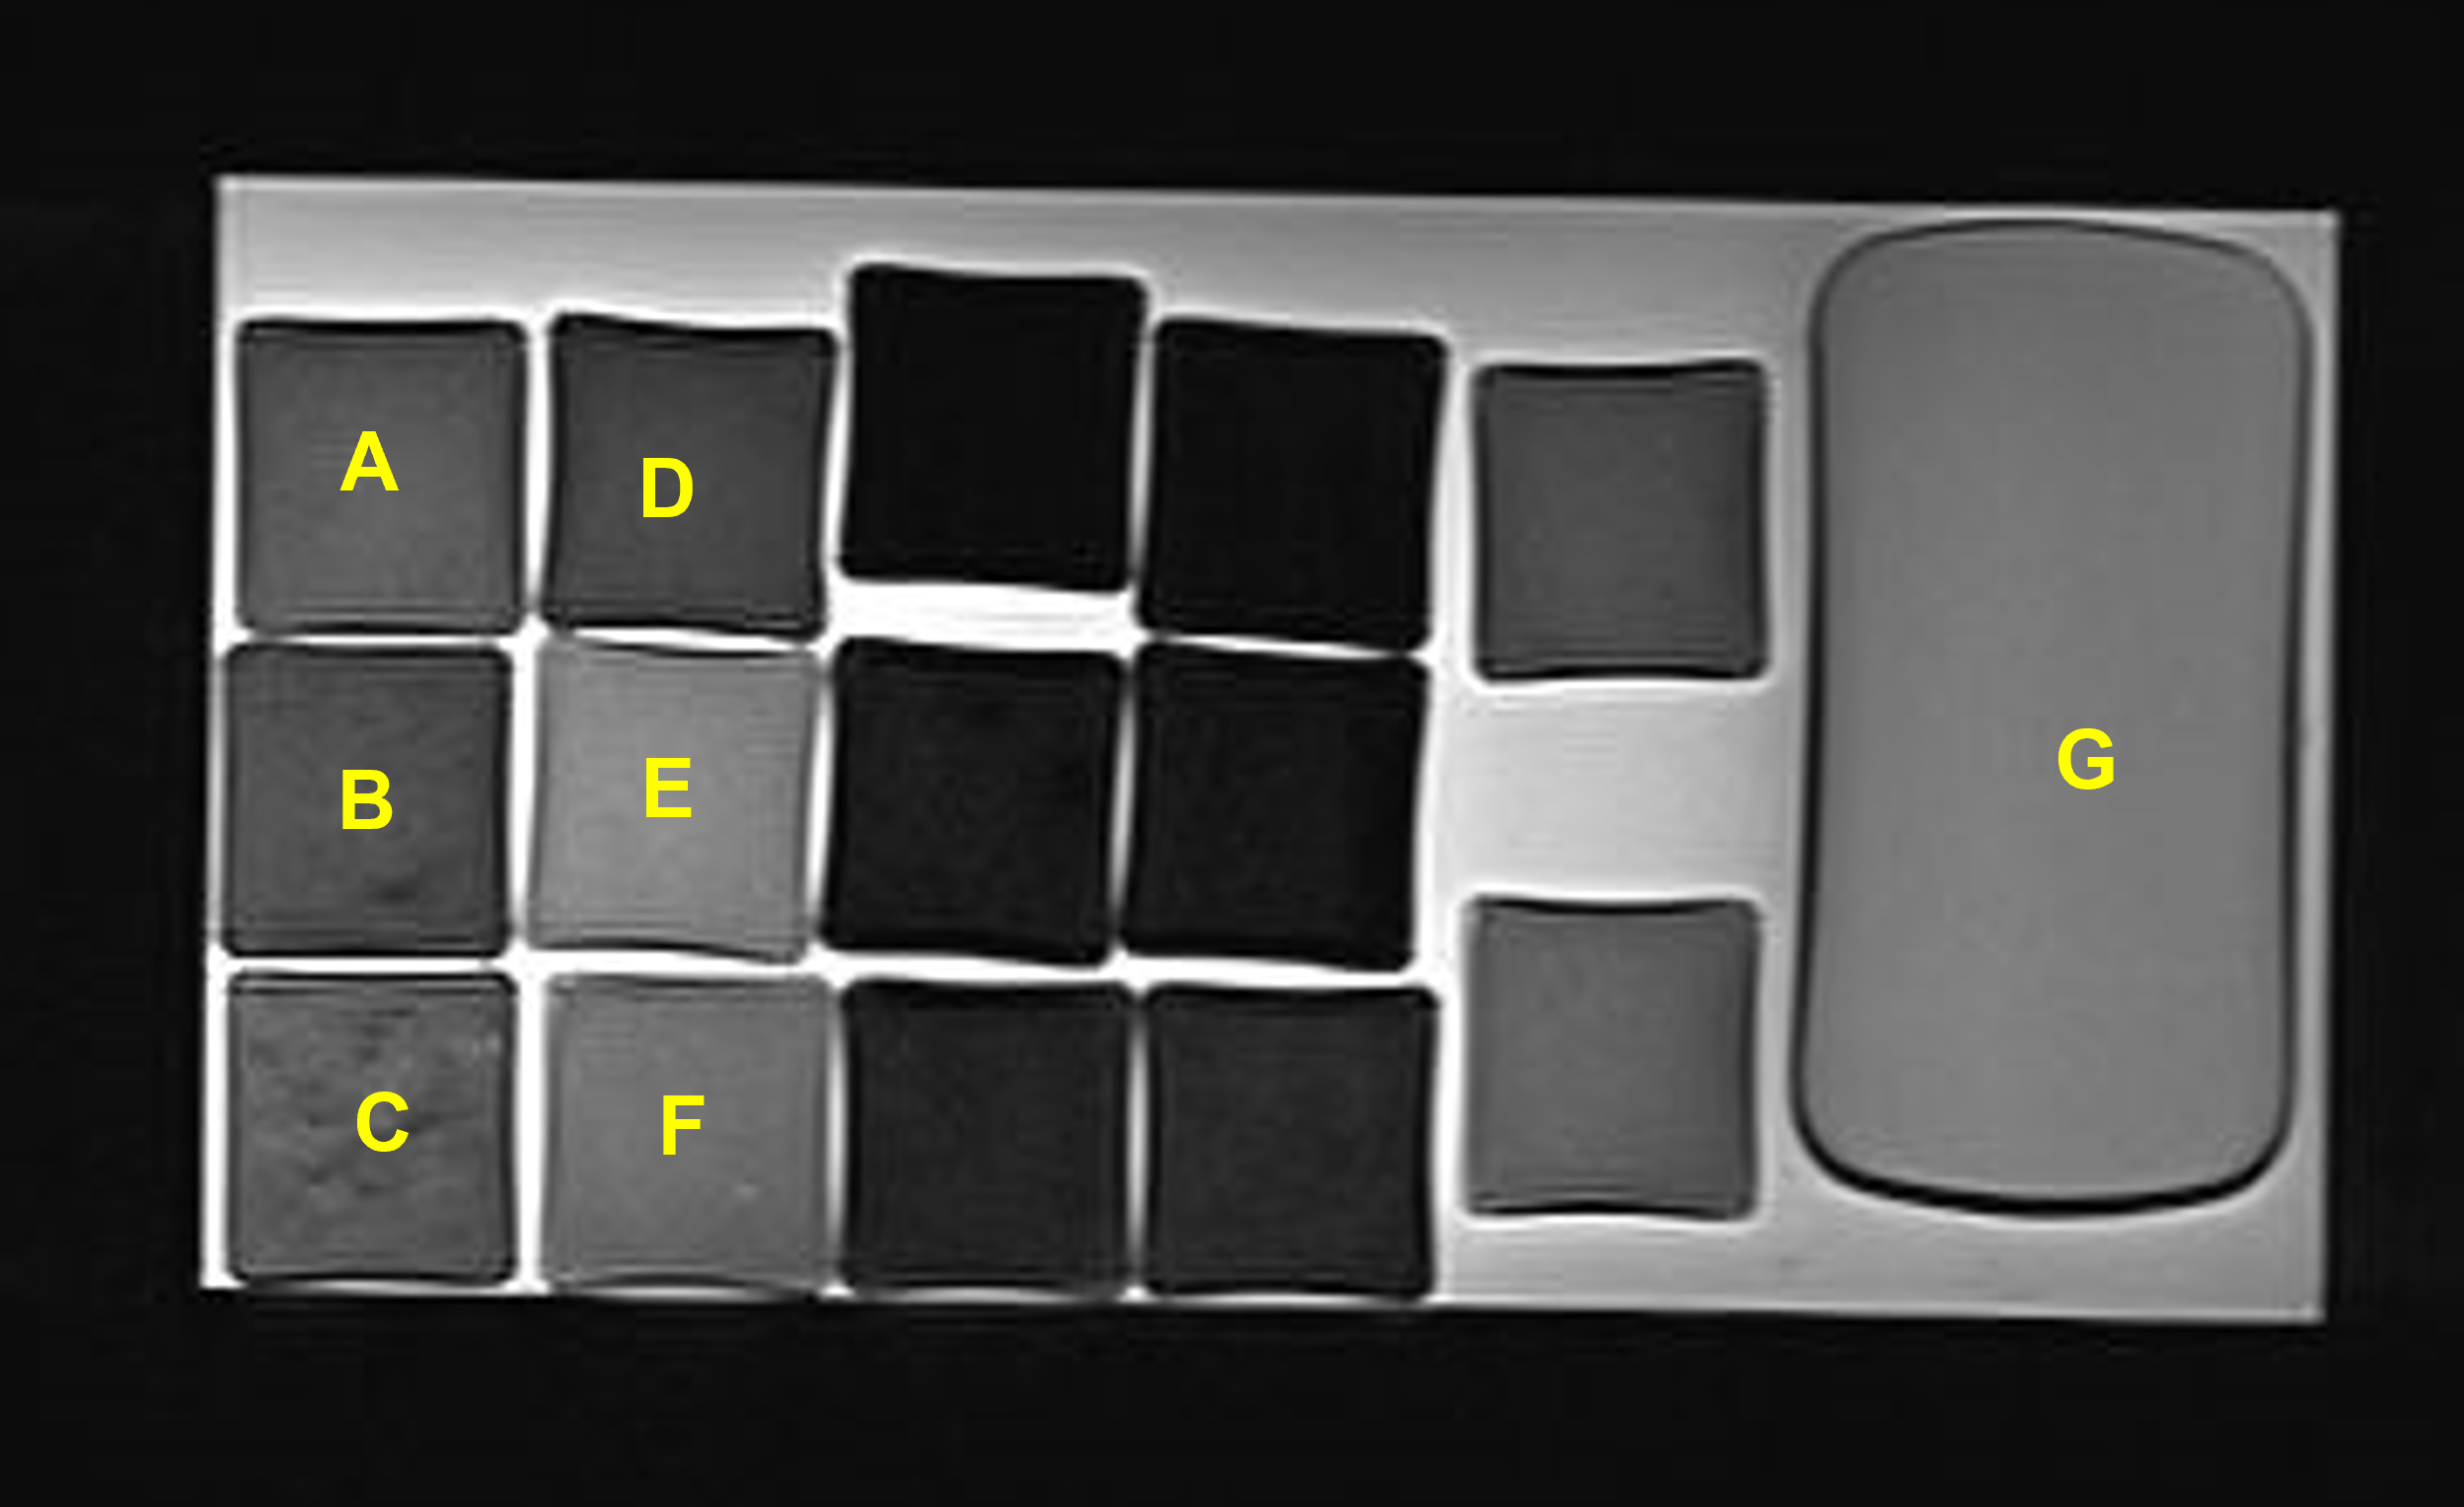
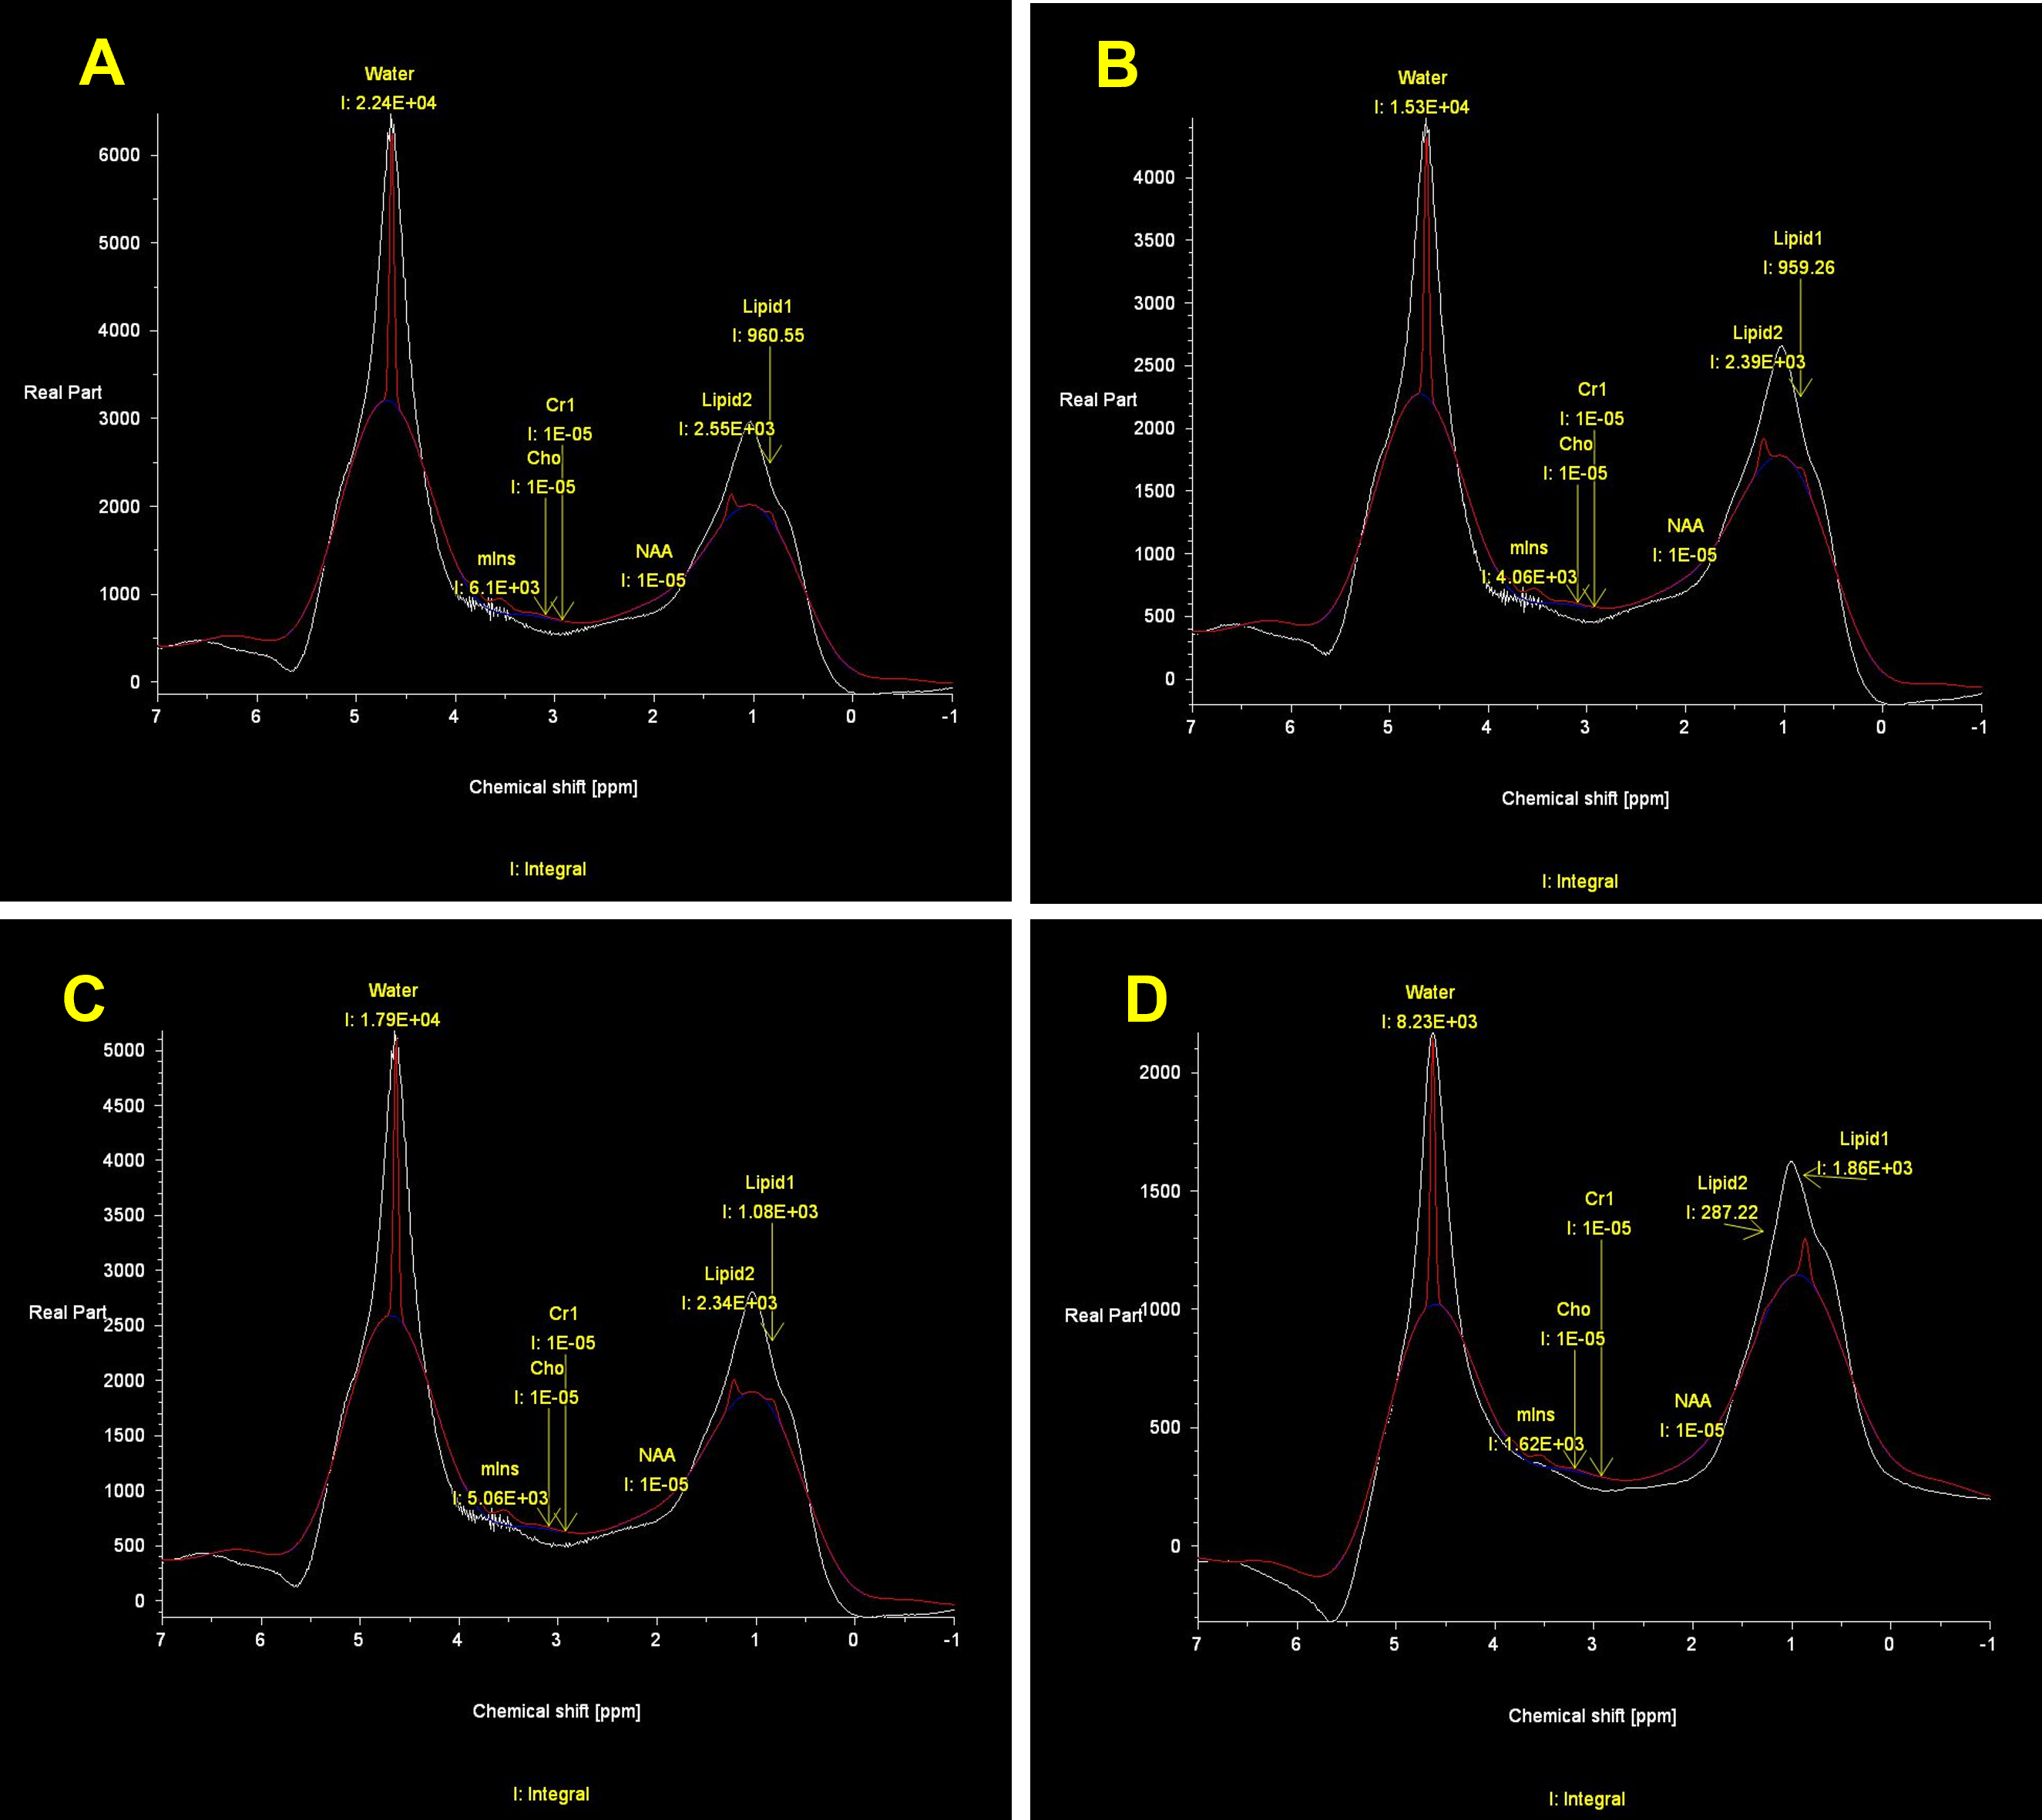
A total of six phantoms with the actual fat content of 0, 5, 20% were created to simulate the liver precontrast (T1 relaxation time, about 800 ms) and post gadoxetic acid administration (T1 relaxation time, about 400 ms). Water-soluble cutting oil was used for fat of the phantoms. All phantoms were solidified with 4% agar (Fig. 1.). T1 relaxation time of the phantoms were measured three times each using inversion recovery-spin echo (IR-SE), modified look locker (MOLLI), variable flip angle (VFA), and MRS on a 3T-MRI system (Magnetom Vida; Siemens). A type of MRS sequence was STEAM without water suppression. Theoretically, the MRS method can be used to determine the T1 relaxation time of the water component alone from a water spectrum (4.7 ppm) of a multi-TR acquisition (5). The TR of MRS were set to 5000, 3000, 2000, 1000, 750, and 500 ms, each with acquisition time of 14-16 seconds. The integral values for water and fat were obtained from the MRS analysis software provided with the MRI scanner, and the T1 relaxation time was obtained from the theoretical equation of signal intensity by the least-squares method using Microsoft Excel. The T1 relaxation time determined from the water (4.7 ppm) and lipid (1.3 ppm) spectra were MRSw and MRSlip, respectively (Fig. 2.). In addition, the T1 relaxation time acquired from all TRs and three TRs (5000, 750, 500 ms) were defined MRSw full and MRSw 3p, respectively. To assess the influence of the number of MRS data on T1 relaxation time, MRSw full and MRSw 3p were compared. The dependence of T1 relaxation time on fat content was evaluated using the T1 relaxation time at 0% fat of each precontrast and postcontrast phantom as a reference.Results and discussions
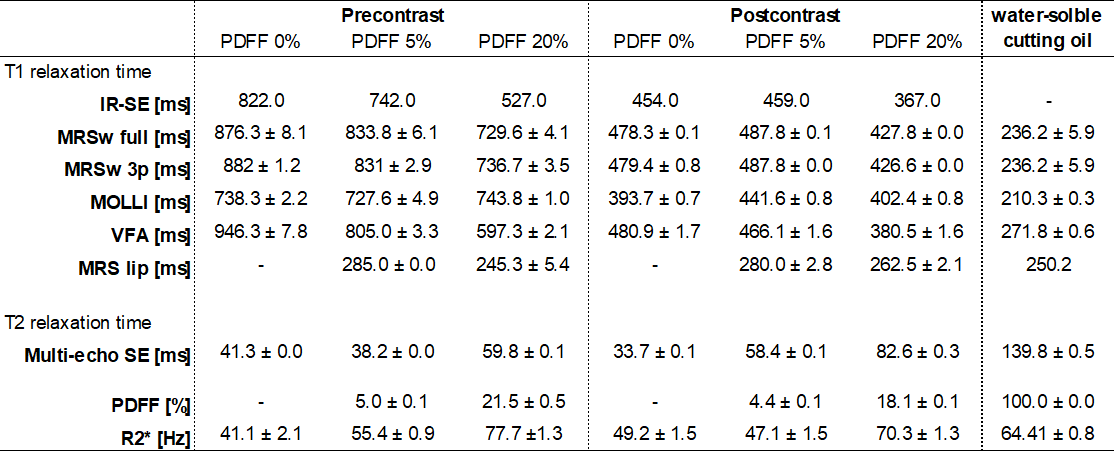
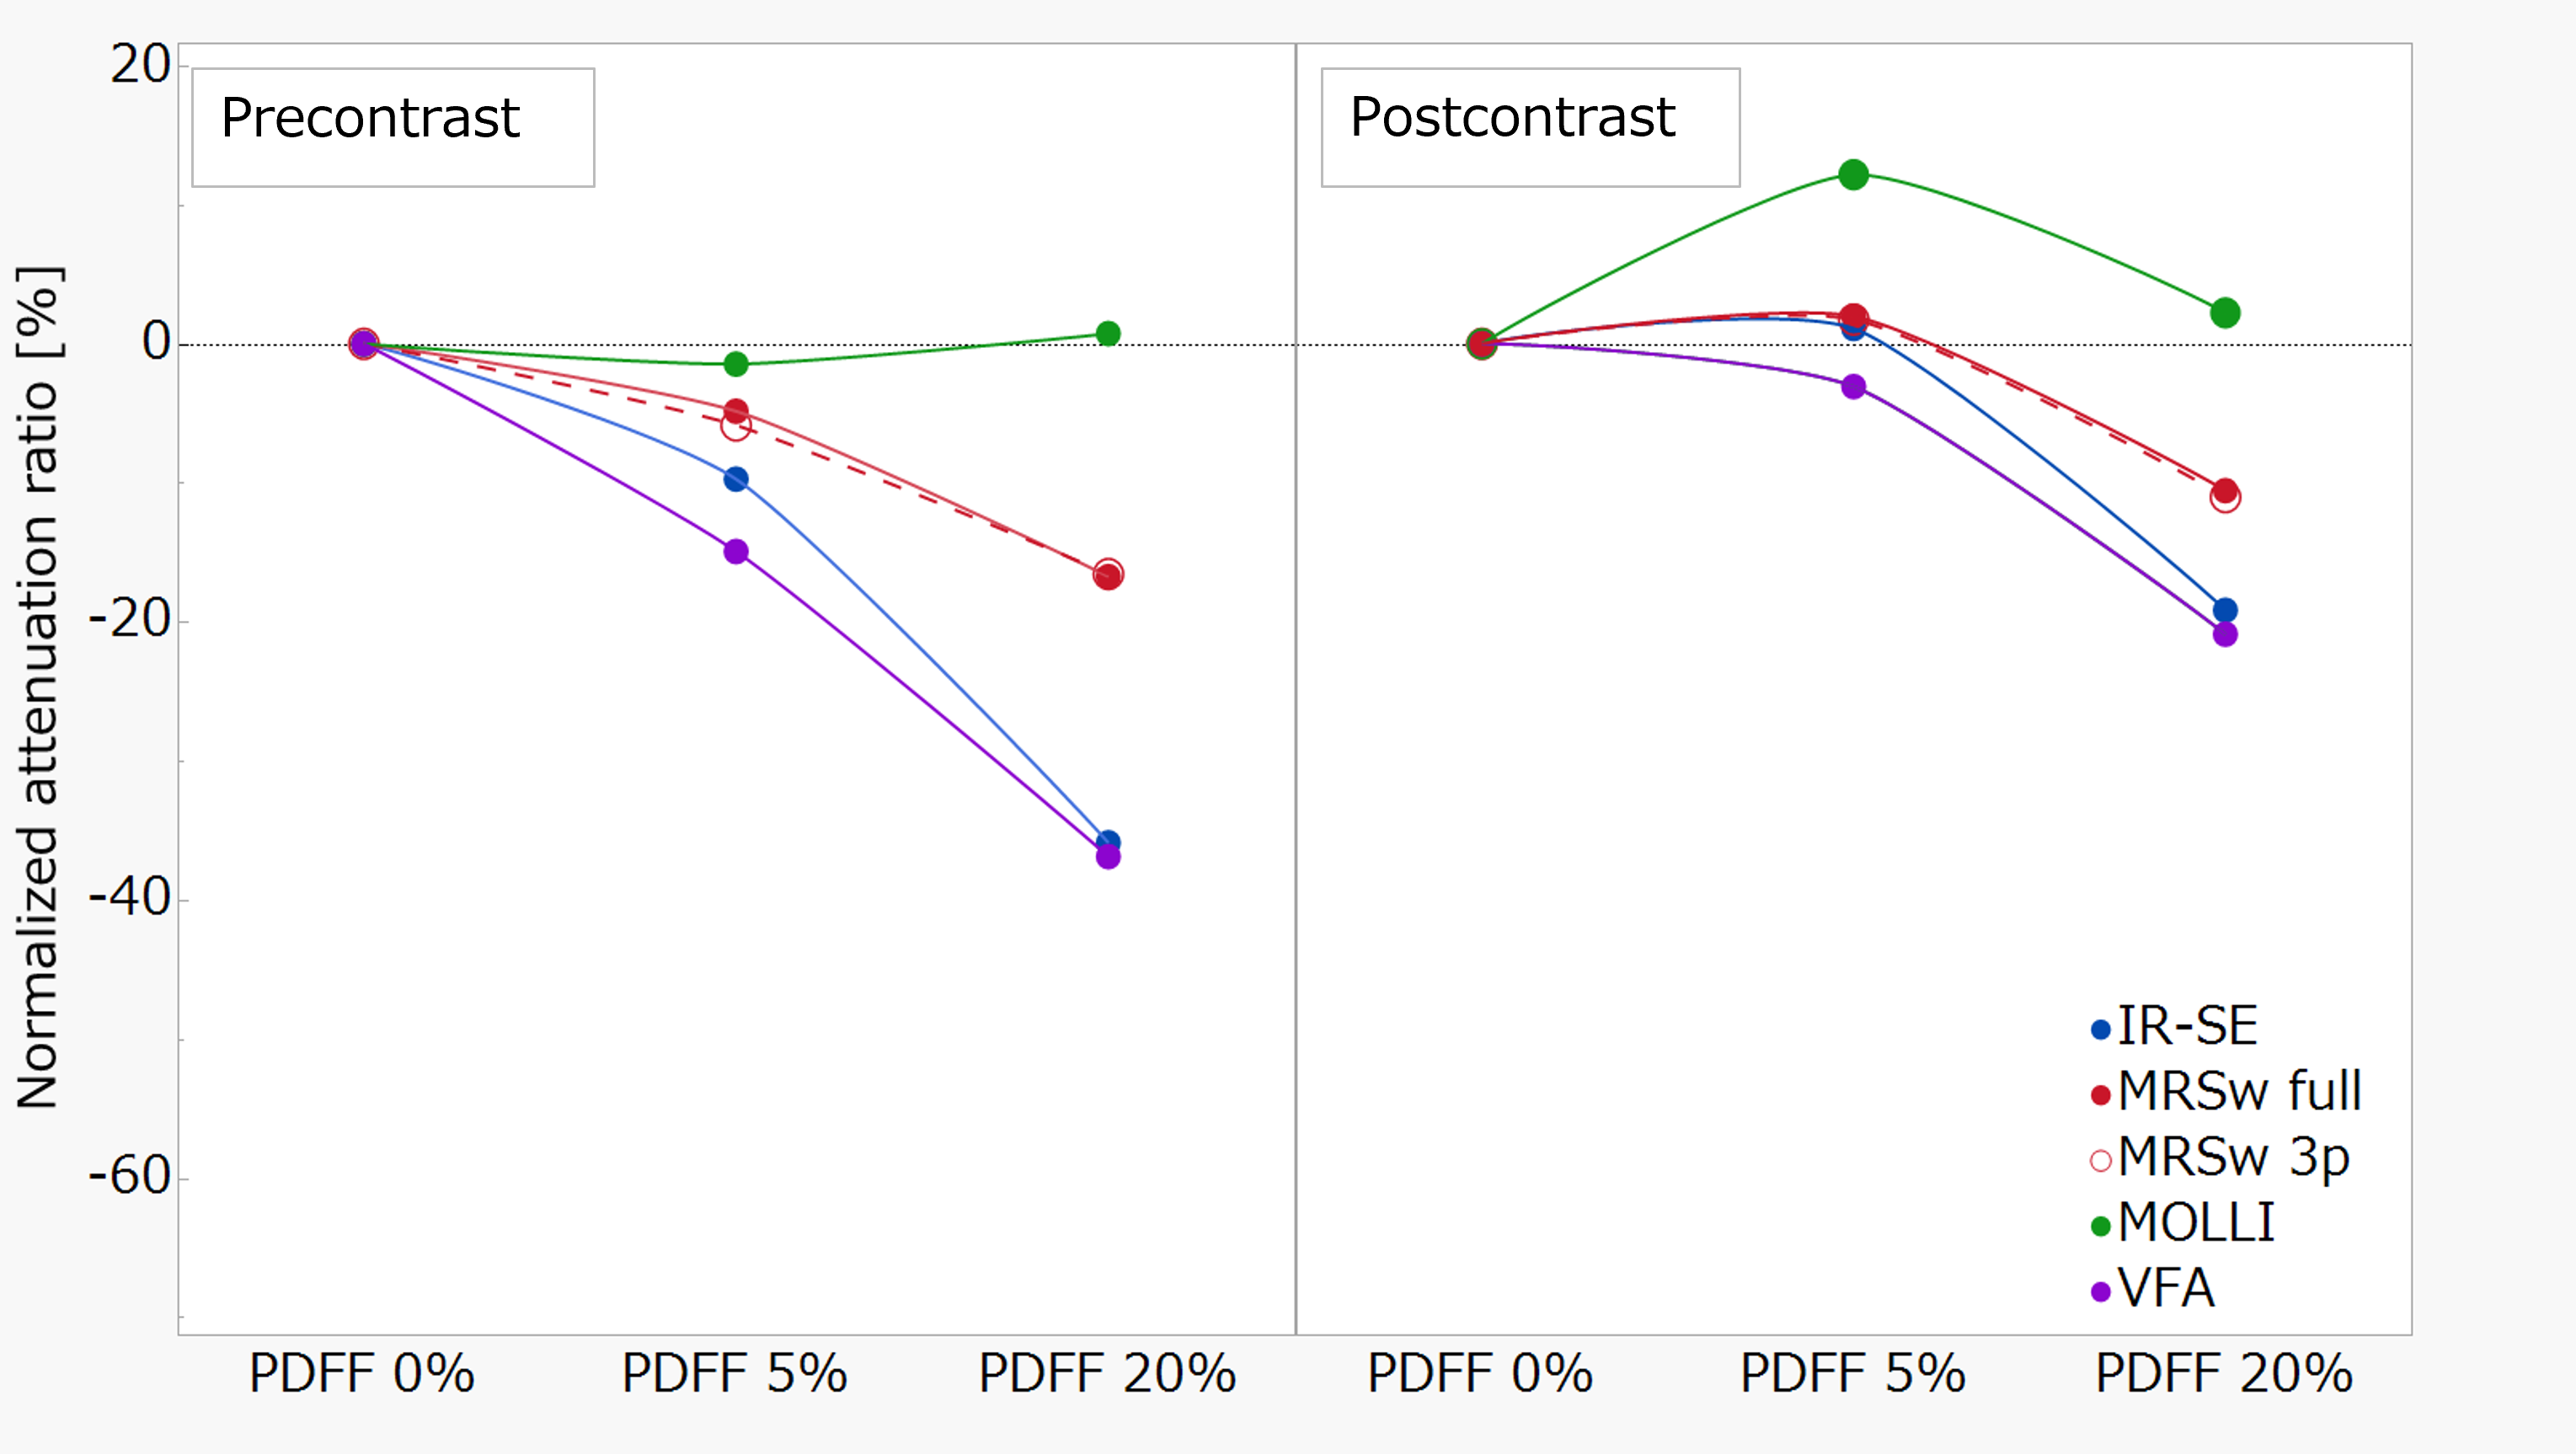
In both precontrast and postcontrast phantoms, T1 relaxation time acquired by all methods (excluding MOLLI) tended to be decreased with increasing fat content (Precontrast; IR-SE, 822.0 ms–527 ms; MOLLI, 738.3 ms–743.8 ms; VFA, 946.3 ms–597.3 ms; and MRSw full, 876.3 ms–729.6 ms. Post contrast; IR-SE, 454.0 ms–367.0 ms; MOLLI, 393.7 ms–402.4 ms; VFA, 480.9 ms–380.5 ms; and, MRSw full, 478.3 ms–427.8 ms) (Table 1.). The MRSlip obtained from the fat-containing phantom was able to measure T1 relaxation time equivalent to those of the water-soluble cutting oil. Precontrast T1 relaxation time with IR-SE decreased by 37% with increasing fat content, while MRSw full and MRSw 3p only decreased by 17% (Fig. 3.). MOLLI should have decreased T1 relaxation time with each increase in fat content, but T1 relaxation time was probably affected by fat as it remained almost the same for all phantoms. The difference between MRSw full and MRSw 3p were a few percent, almost equal.Conclusion
T1 relaxation time measurement of water signal only by MRS of water signal is more accurate at lower fat concentrations and slightly affected by higher fat concentrations; however, its influence is smaller than that of other methods. Reducing the number of MRS data points to three does not result in a substantial change compared to full data, thus, acquisition time is reasonable for clinical use. This technique does not use special research sequence, is feasible with a common clinical MRI scanner capable of imaging MRS and has the potential to more accurate assessment of fibrosis in the liver.Acknowledgements
We thank the departments of radiology and radiological technology at the Kurume university hospital supported this study.References
1. Okada M, Murakami T, Yada N, et al. Comparison between T1 relaxation time of Gd-EOB-DTPA-enhanced MRI and liver stiffness measurement of ultrasound elastography in the evaluation of cirrhotic liver: Comparison Between T1 Map and FibroScan. J. Magn. Reson. Imaging 2015;41:329–338.
2. Kim JE, Kim HO, Bae K, Choi DS, Nickel D. T1 mapping for liver function evaluation in gadoxetic acid–enhanced MR imaging: comparison of look-locker inversion recovery and B1 inhomogeneity–corrected variable flip angle method. Eur. Radiol. 2019;29:3584–3594.
3. Kellman P, Bandettini WP, Mancini C, Hammer-Hansen S, Hansen MS, Arai AE. Characterization of myocardial T1-mapping bias caused by intramyocardial fat in inversion recovery and saturation recovery techniques. J. Cardiovasc. Magn. Reson. 2015;17:33.
4. Ferenc E. Mozes, Tunnicliffe EM, Pavlides M, Robson MD. Influence of fat on liver T 1 measurements using modified Look-Locker inversion recovery (MOLLI) methods at 3T: Influence of Fat on Liver T 1 Measurements. J. Magn. Reson. Imaging 2016;44:105–111.
5. Hamilton G, Middleton MS, Hooker JC, et al. In vivo breath-hold 1 H MRS simultaneous estimation of liver proton density fat fraction, and T 1 and T 2 of water and fat, with a multi-TR, multi-TE sequence: T1, T2, and PDFF Assessed by Breath-Hold MRS. J. Magn. Reson. Imaging 2015;42:1538–1543.
6. Mozes FE, Tunnicliffe EM, Moolla A, et al. Mapping tissue water T1 in the liver using the MOLLI T1 method in the presence of fat, iron and B0 inhomogeneity. NMR Biomed. 2019;32:e4030.
7. Liu C-Y, Noda C, Ambale-Venkatesh B, Kassai Y, Bluemke D, Lima JAC. Evaluation of liver T1 using MOLLI gradient echo readout under the influence of fat. Magn. Reson. Imaging 2022;85:57–63.
Figures