5387
Absolute quantification of hepatic 31P metabolites at 3 T using a phantom replacement technique – How to set it up1Institute for Clinical Diabetology, German Diabetes Center, Leibniz Institute for Diabetes Research at Heinrich Heine University, Düsseldorf, Germany, 2German Center for Diabetes Research (DZD e.V.), München-Neuherberg, Germany, 3Department of Endocrinology and Diabetology, Medical Faculty, Heinrich Heine University, Düsseldorf, Germany, 4Department of Radiology and Nuclear Medicine, Maastricht University Medical Center, Maastricht, Netherlands
Synopsis
Keywords: Data Analysis, Spectroscopy, 31P-MRS, Absolute Quantification; Quadrature Coil
Phantom replacement techniques for the quantification of absolute concentrations of hepatic phosphorous metabolites are an established tool for studying energy metabolism in vivo. However, many consideration need to be taken into account. Here, we present how to correct localized in vivo 31P-MRS data in order to report molar concentrations of ATP and inorganic phosphate and how to set up the experiments for obtaining the required correction factors. Correction factors include T1 correction, coil loading, excitation pulse profile as well as B1 inhomogeneity of the surface coil in all three spatial directions.
Introduction
The detection and quantification of phosphorous metabolites in the human liver provides valuable information for studying metabolic diseases. It was previously shown that the concentrations of adenosine triphosphate (ATP) and inorganic phosphate (Pi) are decreased in type 1 and type 2 diabetes mellitus (T1DM and T2DM)1,2,3, while this was not the case for healthy volunteers. Therefore, reporting such results in molar concentrations instead of relative units is of added value and furthermore also allows for better comparisons with other biochemical assays4. In order to obtain absolute concentrations, a phantom replacement experiment can be performed. This method, first described by Meyerhoff et al.4, depends on a precisely adjustable phantom. Reproducibility and clinical applications of 31P-MRS measurements for quantification of metabolite absolute concentration were already presented in previous work from our group3,5,6. Here, we aim to guide researchers through the necessary steps that need to be taken and the setup required to convert data from localized in vivo 31P-MRS measurements into absolute concentrations.Setup
For the phantom replacement approach, a large (5 L) matching phantom with known concentration ($$$c_{phantom}$$$ of 50 mM K2HPO4 and 0.1 mM Gd-DTPA) as well as an external reference (glass sphere filled with 530 µl methylphosphonic acid (98 %), fixed on the coil) are required. The absolute concentrations can be obtained through coil loading correction by comparing the signal ratios of the in vivo amplitude $$$A_{invivo}$$$ and the phantom amplitude $$$A_{phantom}$$$ with their corresponding reference amplitudes $$$A_{invivo}^{ref}$$$ and $$$A_{phantom}^{ref}$$$ as shown in Equation 1. The in vivo data has to be additionally corrected with $$$f_{distance}^{y,z}$$$, based on the relative coil position due to possible B1 inhomogeneity (Figure 1 displays planning and coil placement within the matching phantom). To account for varying distances between the coil and liver, depending on body size and the amount of subcutaneous fat, phantom data in a wide range of z‑distances (distance between coil and voxel) of 8 to 13 cm (1 cm steps) were acquired and fitted as a linear function (Figure 2). Additionally, phantom data with coil displacement along the y-axis from ‑5 to 5 cm (1 cm steps) were acquired, fitted with a nonlinear fit and averaged for different z‑distances (Figure 2). The x-offset was shown to have no influence because of the parallel arrangement of both coil elements and is therefore neglected (see coil details under methods). Next, the in vivo data was corrected for the profile of the excitation pulse with the correction factor $$$f_{frequencyoffset}$$$, which is determined by acquiring phantom data for different offset frequencies between ‑800 and 400 Hz, corresponding to the position of the individual 31P metabolites (Figure 3).The complete equation for calculating a molar concentration $$$c_{corr}$$$ from the acquired in vivo amplitude $$$A_{invivo}$$$ is described as:
$$$c_{corr}=\frac{A_{invivo}}{A_{invivo}^{ref}}\times \frac{A_{phantom}^{ref}}{A_{phantom}}\times c_{phantom}\times f_{distance}^{y,z}\times f_{frequencyoffset}\times f_{T_1}\times f_{liverfat}$$$ Eq. 1
The correction factors used in Equation 1 are obtained by reading the intensity of the matching phantom data fits for the actual in vivo values for z-distance, y-offset and frequency offset. Finally, the signal is corrected with $$$f_{T_1}$$$ for the T1 relaxation time of the metabolite of interest based on the literature value at 3 T reported by Schmid et al7 and with $$$f_{liverfat}$$$ for the volume occupied by liver fat content acquired in an additional measurement as reported by Longo et al8,9.
Methods
All data were acquired on a clinical 3 T MR system (Philips Achieva dStream, Best, The Netherlands). For 31P-MRS, a custom-created curved rigid quadrature surface coil (transmit-receive coil; RAPID Biomedical, Rimpar, Germany) with total 31P loop size of 220x160 mm was used. In addition, the scanners’ 1H body coil was used for 1H decoupling, Nuclear Overhauser Enhancement (NOE) and scout images to ensure proper placement of the 31P coil. The matching phantom spectra were measured with the same acquisition parameters as the in vivo protocol. For this, a 3D Image Selected In vivo Spectroscopy (ISIS) sequence with a 3.83 ms hyperbolic secant (HS) adiabatic pulse (1.63 kHz bandwidth) for excitation, repetition time (TR) of 6 s, 13 min total acquisition time, 2048 samples (N), 3 kHz spectral bandwidth (BW), broadband decoupling (WALTZ-4) and continuous wave (CW) NOE was performed. Both, the acquisition voxel and the automated Philips shim aligned and had dimensions of 60x60x60 mm.For the acquisition of the external reference spectra, a pulse-acquire sequence with the same HS adiabatic excitation pulse as the phantom sequence, 130x80x80 mm shim size, TR of 8 s, 2.3 min total acquisition time, 8192 N, 6 kHz BW and no 1H decoupling or NOE was applied. Typical linewidth were around 7 Hz for the matching phantom and external reference spectra.
All matching phantom and reference spectra were processed and fitted using the jMRUI software and AMARES algorithm with in-house established prior knowledge, zero order phasing, and 15-20 Hz visual apodization. The parametric fitting for the correction factors was carried out with the GraphPad Prism software.
Conclusion
Non-invasive 31P-MRS using a phantom replacement technique allows the computation of molar concentrations of 31P metabolites in the human liver. This method can serve as a valuable tool for quantitative, reliable and continuous monitoring of metabolic diseases as well as lifestyle interventions in humans.Acknowledgements
No acknowledgement found.References
1. Szendroedi J, Chmelik M, Schmid AIG, Nowotny P, Brehm A, Krssak M, Moser E, Roden M. Abnormal hepatic energy homeostasis in type 2 diabetes. Hepatology 2009; 50(4): 1079-1086
2. Gancheva S, Bierwagen A, Kaul K, Herder C, Nowotny P, Kahl S, Giani G, Klueppelholz B, Knebel B, Begovatz P, Strassburger K, Al-Hasani H, Lundbom J, Szendroedi J, Roden M. Variants in Genes Controlling Oxidative Metabolism Contribute to Lower Hepatic ATP Independent of Liver Fat Content in Type 1 Diabetes. Diabetes 2016; 65(7): 1849-1857
3. Kupriyanova Y, Zaharia OP, Bobrov P, Karusheva Y, Burkart V, Szendroedi J, Hwang JH, Roden M. Early changes in hepatic energy metabolism and lipid content in recent-onset type 1 and 2 diabetes mellitus. J. Hepatol. 2021; 74(5): 1028-1037
4. Meyerhoff DJ, Karczmar GS, Matson GB, Boska MD, Weiner MW. Non-invasive Quantitation of Human Liver Metabolites Using Image-guided 31P Magnetic Resonance Spectroscopy. NMR Biomed. 1990; 3(1): 17-22
5. Laufs A, Livingstone R, Nowotny B, Nowotny P, Wickrath F, Giani G, Bunke J, Roden M, Hwang JH. Quantitative liver 31P magnetic resonance spectroscopy at 3T on a clinical scanner. Magn Reson Med. 2014; 71(5): 1670-1675
6. Jonuscheit M, Korzekwa B, Wierichs S, Kupriyanova Y, Roden M, Schrauwen-Hinderling V. Reproducibility of localized 31P-magnetic resonance spectroscopy using different surface coils for assessing human hepatic energy metabolism. Proc. Intl. Soc. Mag. Reson. Med. 30 2022; 1079
7. Schmid AI, Chmelik M, Szendroedi J, Krssak M, Brehm A, Moser E, Roden M. Quantitative ATP synthesis in human liver measured by localized 31P spectroscopy using the magnetization transfer experiment. NMR Biomed. 2008; 21: 437-443
8. Longo R, Pollesello P, Ricci C, Masutti F, Kvam BJ, Bercich L, Croce LS, Grigolato P, Paoletti S, de Bernard B. Proton MR spectroscopy in quantitative in vivo determination of fat content in human liver steatosis. J Magn Reson Imaging. 1995; 5(3): 281-285
9. Hamilton G, Yokoo T, Bydder M, Cruite I, Schroeder ME, Sirlin CB, Middleton MS. In vivo characterization of the liver fat ¹H MR spectrum. NMR Biomed. 2011; 24(7): 784-790
Figures
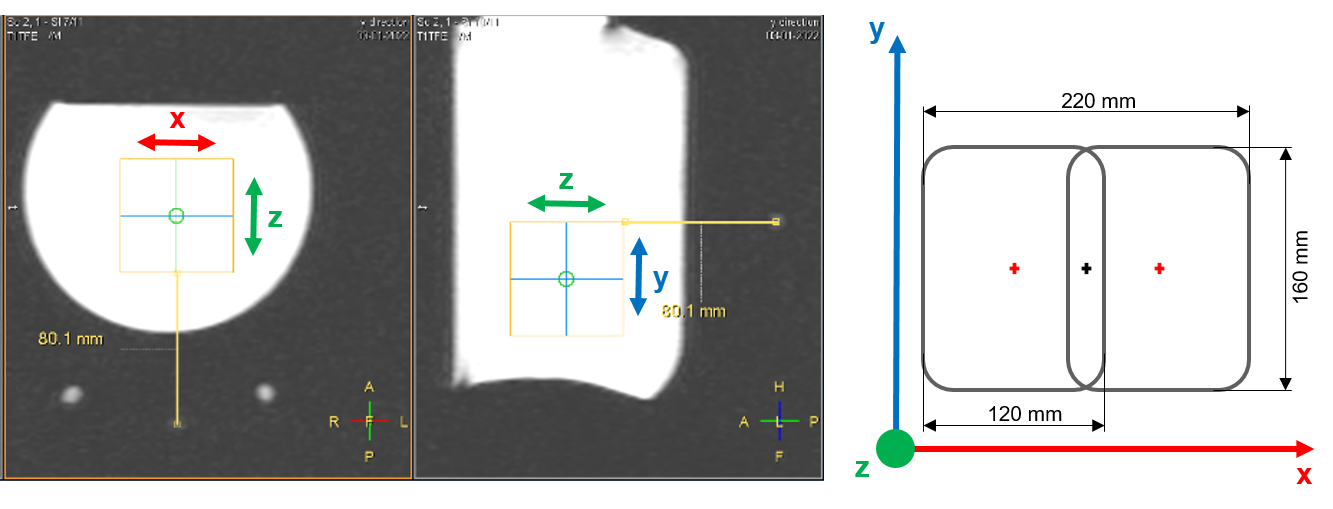
Figure 1: Overview for the 3D ISIS localization planning and coil placement within the matching phantom. Left: The localization voxel is shifted to a distance of 11 cm from the coil center. Right: Coil element dimensions of the 31P quadrature coil with relative coordinate system for orientation. The z-axis (green) displays the distance between the reference spheres (red and black crosses) and the localization voxel. The x- and y-axis (red and blue) represent the plain of the coil elements.
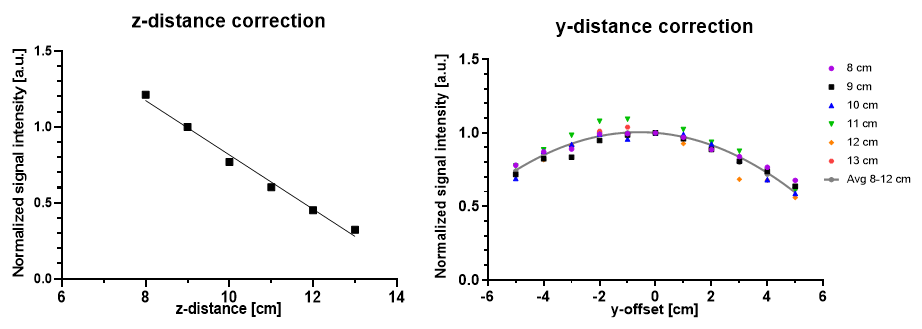
Figure 2: Fitting of distance based correction factors. Left: Normalized amplitudes of the 3D ISIS spectra at different z-distances from 8‑13 cm. All data points were normalized to the amplitude acquired at 9 cm z-distance. Right: Normalized amplitudes of the 3D ISIS spectra at z-distances from 8‑13 cm with additional y‑offset from 0±5 cm. Each individual z-distance dataset was normalized to their corresponding amplitude acquired at 0 cm y-offset.
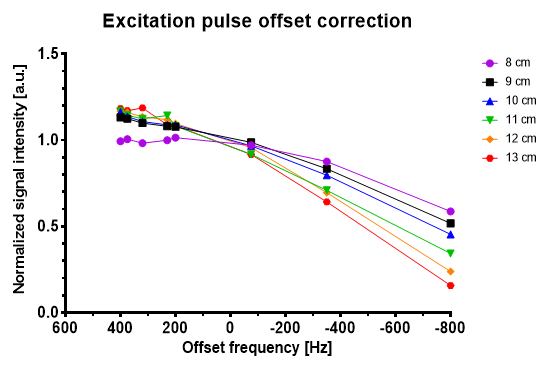
Figure 3: Normalized amplitudes of the 3D ISIS spectra for different z‑distances from 8‑13 cm with additional offsets frequencies of the excitation pulse. In total, eight different offset frequencies corresponding to the chemical shift position of the 31P metabolites of interest were acquired. Each individual z-distance dataset was normalized to their corresponding amplitude acquired at 0 Hz offset frequency.